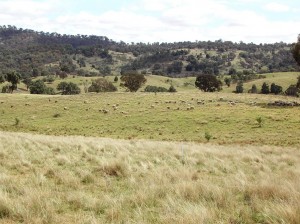
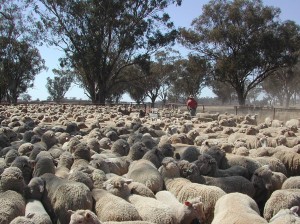
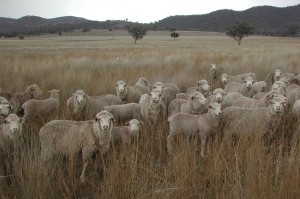
Spring lambing ewes grazing native grass pastures need help to achieve high weaning percentages
High weaning percentages for spring lambing ewes grazing native perennial grass based pastures on the North-West Slopes of NSW can be achieved by integrating forage sources such as oats, lucerne or tropical grasses into the forage base, or providing protein and energy supplements at key times.
Key findings
- On-farm monitoring showed all native perennial grass pastures had available green herbage mass levels below the minimum level in the critical June to September period for spring lambing ewes.
- Weaning percentage increased from ~70 to >110%, when forage oats and/or lucerne were included in the feedbase.
- Raising ewe fat score to meet target fat score at joining resulted in higher weaning percentage.
- Pasture herbage mass was easily and accurately assessed by estimating pasture height and density.
- A simple spreadsheet-based feed calculator that utilised the livestock months (LSM) concept enabled changes in pasture types/areas and sheep numbers to be rapidly computed, providing a visual output of the likely match between feed supply and animal requirements for a whole farm.
 |
 |
| Monitoring of sheep and pastures at 15 farms in Northern NSW provided insights into the relationships between feedbase, ewe condition, weaning percentages and profit. | |
Read more about this research
The issue
Many producers on the North West Slopes of NSW are seeking answers about how to best manage their native grass based pastures and how to integrate their use with other forage sources in order to raise weaning percentages. Most properties have a high proportion of native pastures and run both sheep and cattle enterprises. Native pastures in the region are dominated by summer-growing perennial grasses that have low forage value and are frost susceptible, leading to a ‘green feed, protein and energy drought’ particularly in winter-spring each year. They are characterised by having a large amount of dead material that carries over from year to year and so are generally used for store stock and wool production. Current management of native pastures tends to be ad-hoc.
This study used on-farm data collected through 2008 and 2009 from up to 15 commercial properties to examine the relationship between green feed availability, ewe fat score and sheep enterprise performance.
Production limits of native grass pastures
Grasslands dominated by summer-growing, native perennial grasses occupy more than 44% of the Namoi Catchment in northern NSW. The major native grasses are frost susceptible, produce little green growth in winter-early spring and generally have low metabolisable energy (ME), crude protein and digestibility. Therefore, they are generally not suited to livestock enterprises that involve fattening or breeding, yet about one-third of graziers surveyed produced lambs solely from native perennial grass-based pastures that did not receive any fertiliser or legume inputs with little or no supplementation provided (Lodge 2011c). In recent times there has been a trend towards increasing numbers of cattle and a marked decline in sheep numbers, thereby raising the feed demands from native perennial grass based pastures with the false expectation that high weaning percentages can be attained for both sheep and cattle enterprises.
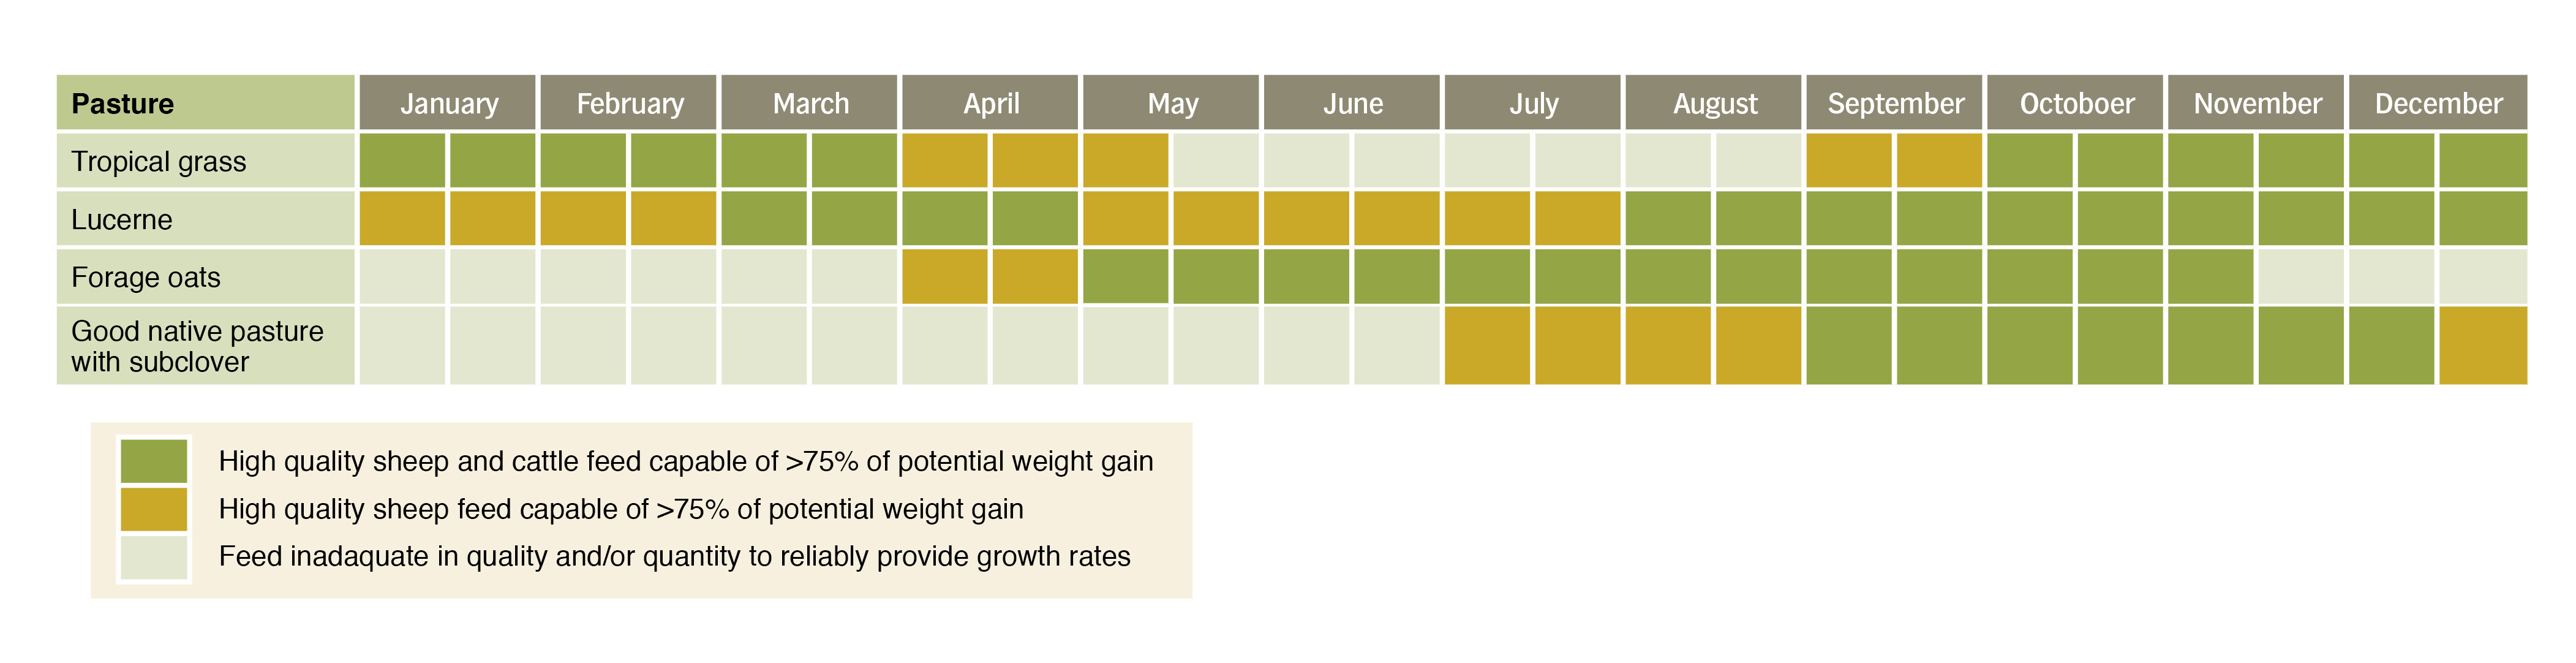
A mis-match in the seasonal feed quality and quantity of native pastures and the known demands for grazing livestock exists in northern NSW. Native pastures, however, are increasingly being used in both ewe and cow breeding enterprises. Based on known forage quality and seasonal growth rates for both C3 and C4 native perennial grasses, most native perennial grass-based pastures cannot meet the digestibility, protein and energy requirements of breeding livestock, unless their use on-farm is integrated with other forage sources such as over-sown subterranean clover (Trifolium subterraneum), lucerne (Medicago sativa), sown temperate or tropical perennial grass-based pastures, forage oats (Avena fatua), or other forms of supplementation (Figure 1).
|
|
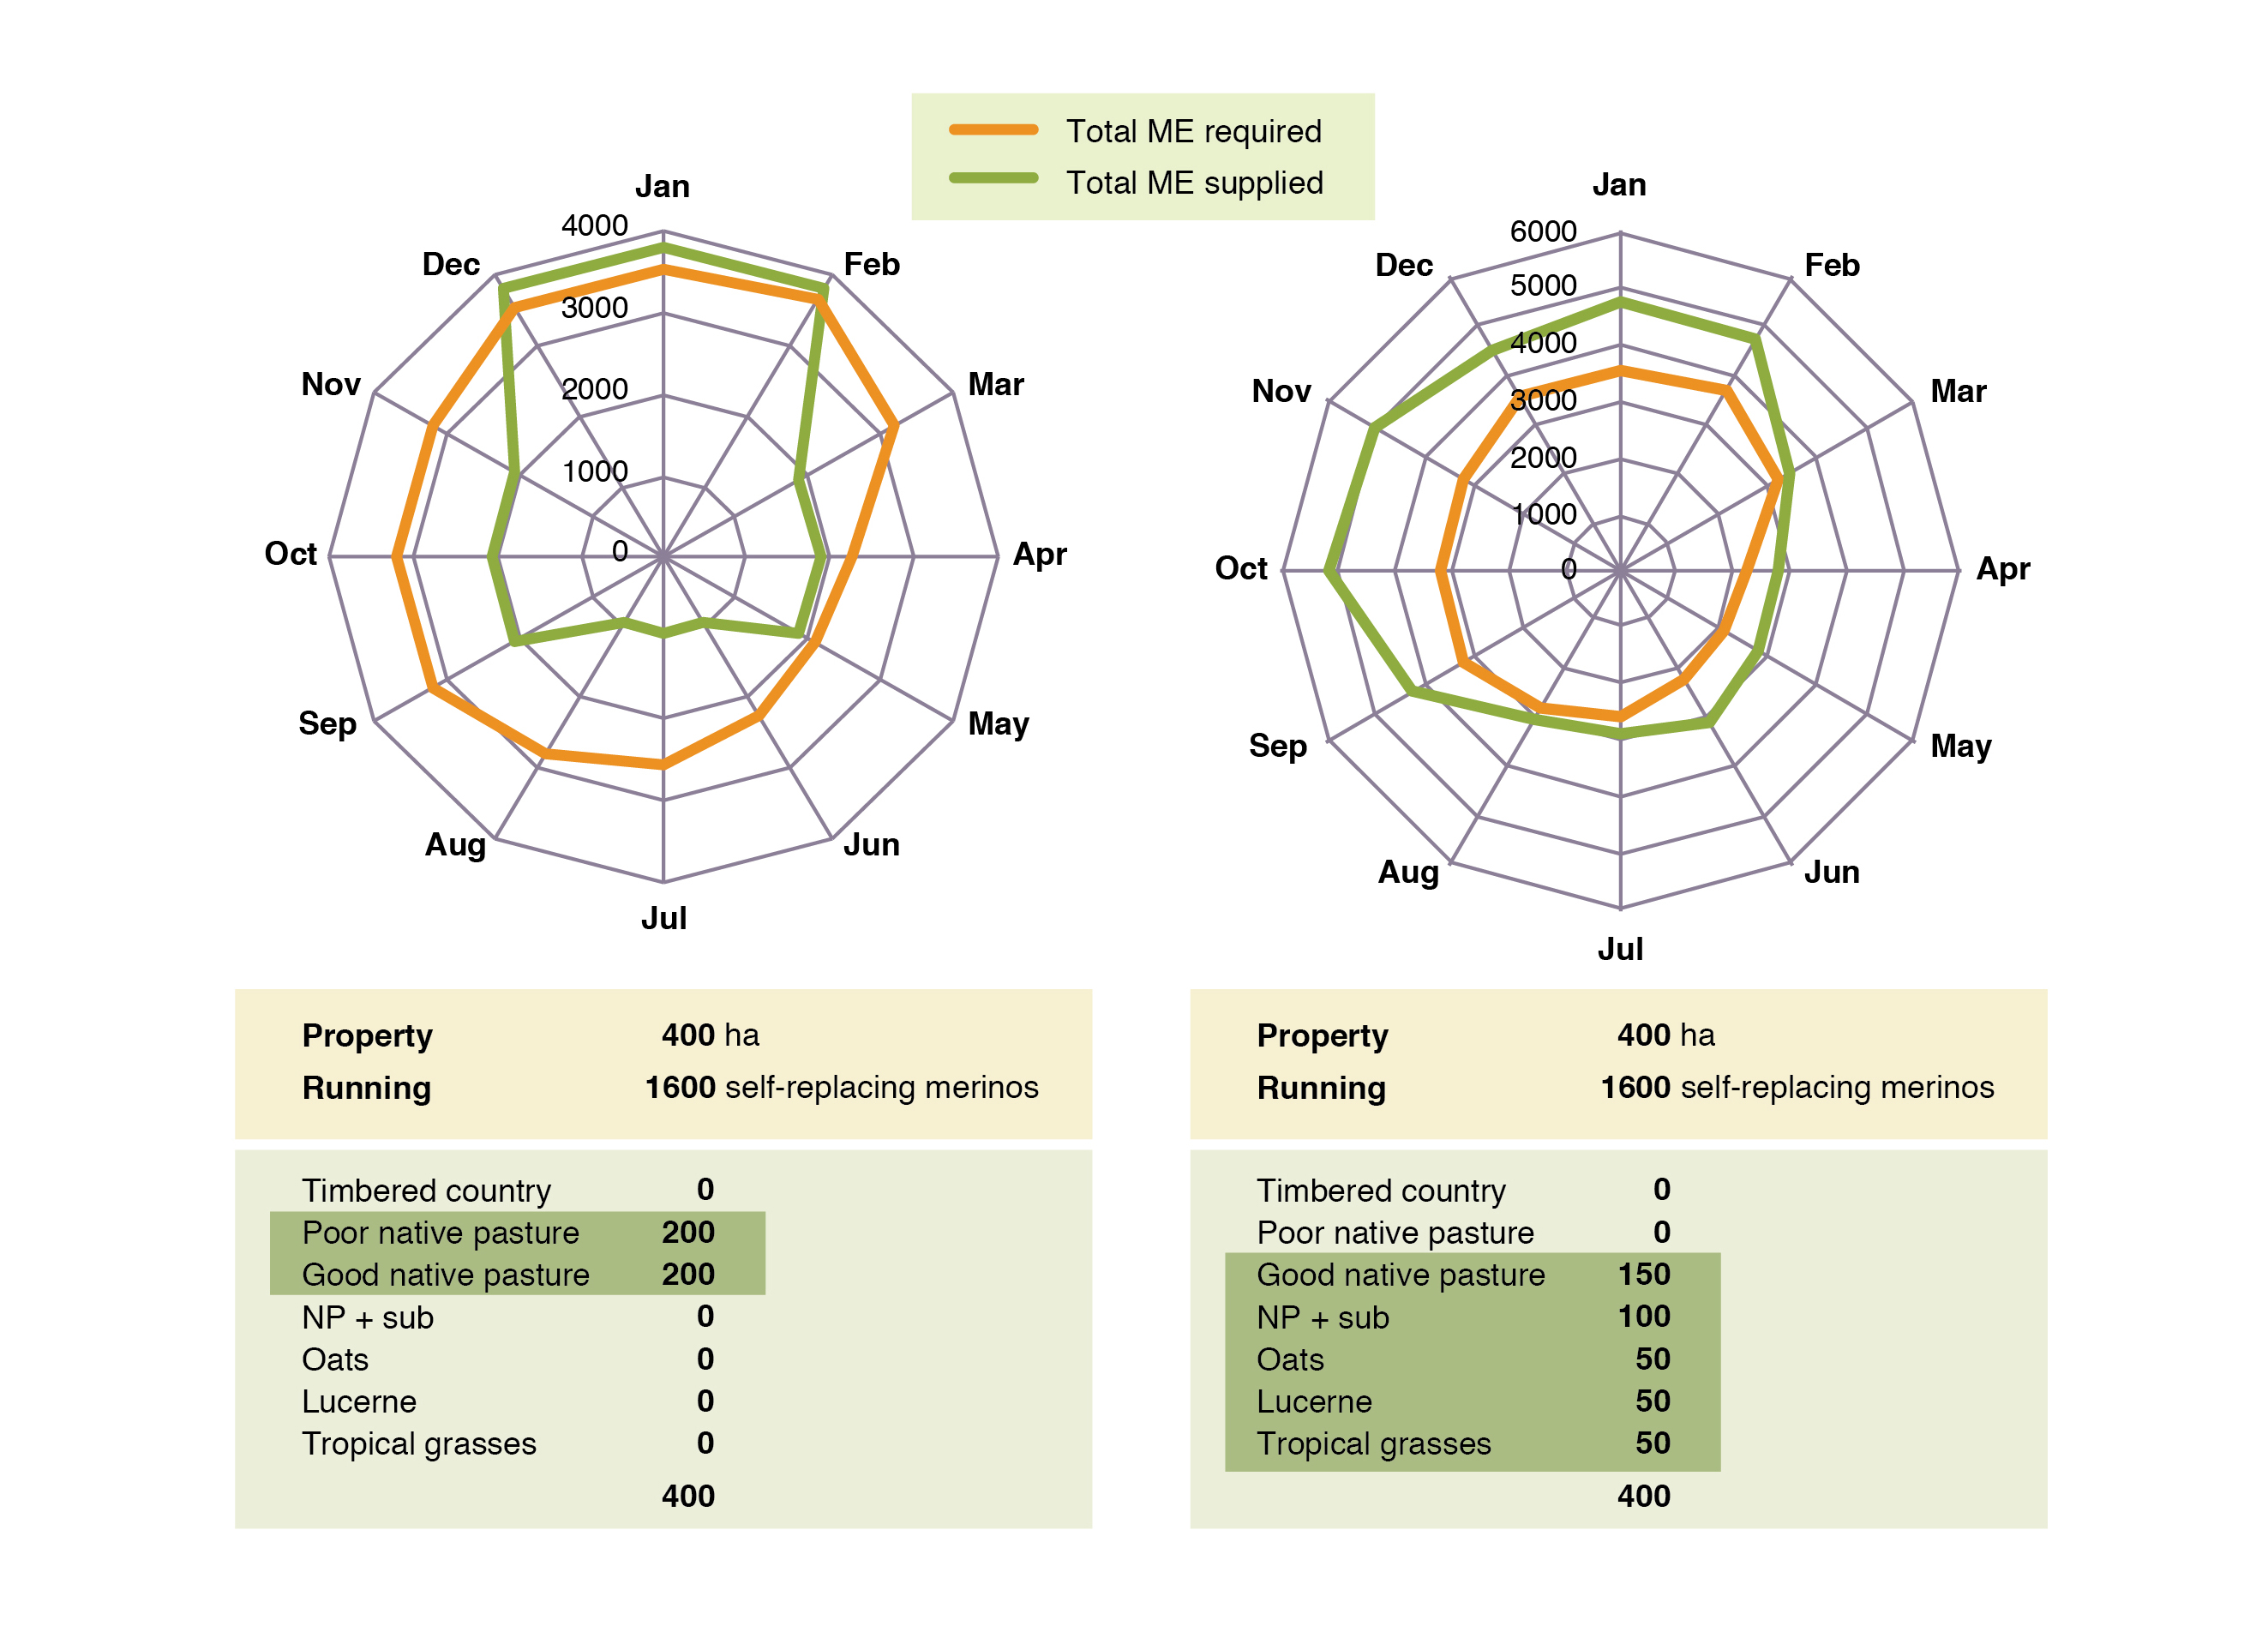
Further, pasture benchmarks (Prograze, See Reference Table 7) for the minimum green herbage mass (68% digestibility) required to maintain satisfactory production levels in a self-replacing Merino enterprise clearly indicate that most native perennial grass pastures fail to supply total ME required, particularly in winter-early spring (Figure 2a). When good native pastures are integrated with a variety of other forages, total ME supplied can be greater than that required for all months (Figure 2b). For a productive self-replacing Merino enterprise the target values are 600 kg of green dry matter (DM)/ha for dry sheep, 700 kg DM/ha for ewes in mid-pregnancy, 1200 kg DM/ha for those in the last month of pregnancy and 1700 kg DM/ha for lactating ewes. Green herbage with a digestibility of 60% is not considered suitable for ewes in late pregnancy or for lactation. For these benchmarks, pastures are assumed to have 500 kg DM/ha of dead material (47% digestibility) and a legume content of 15%.
|
|
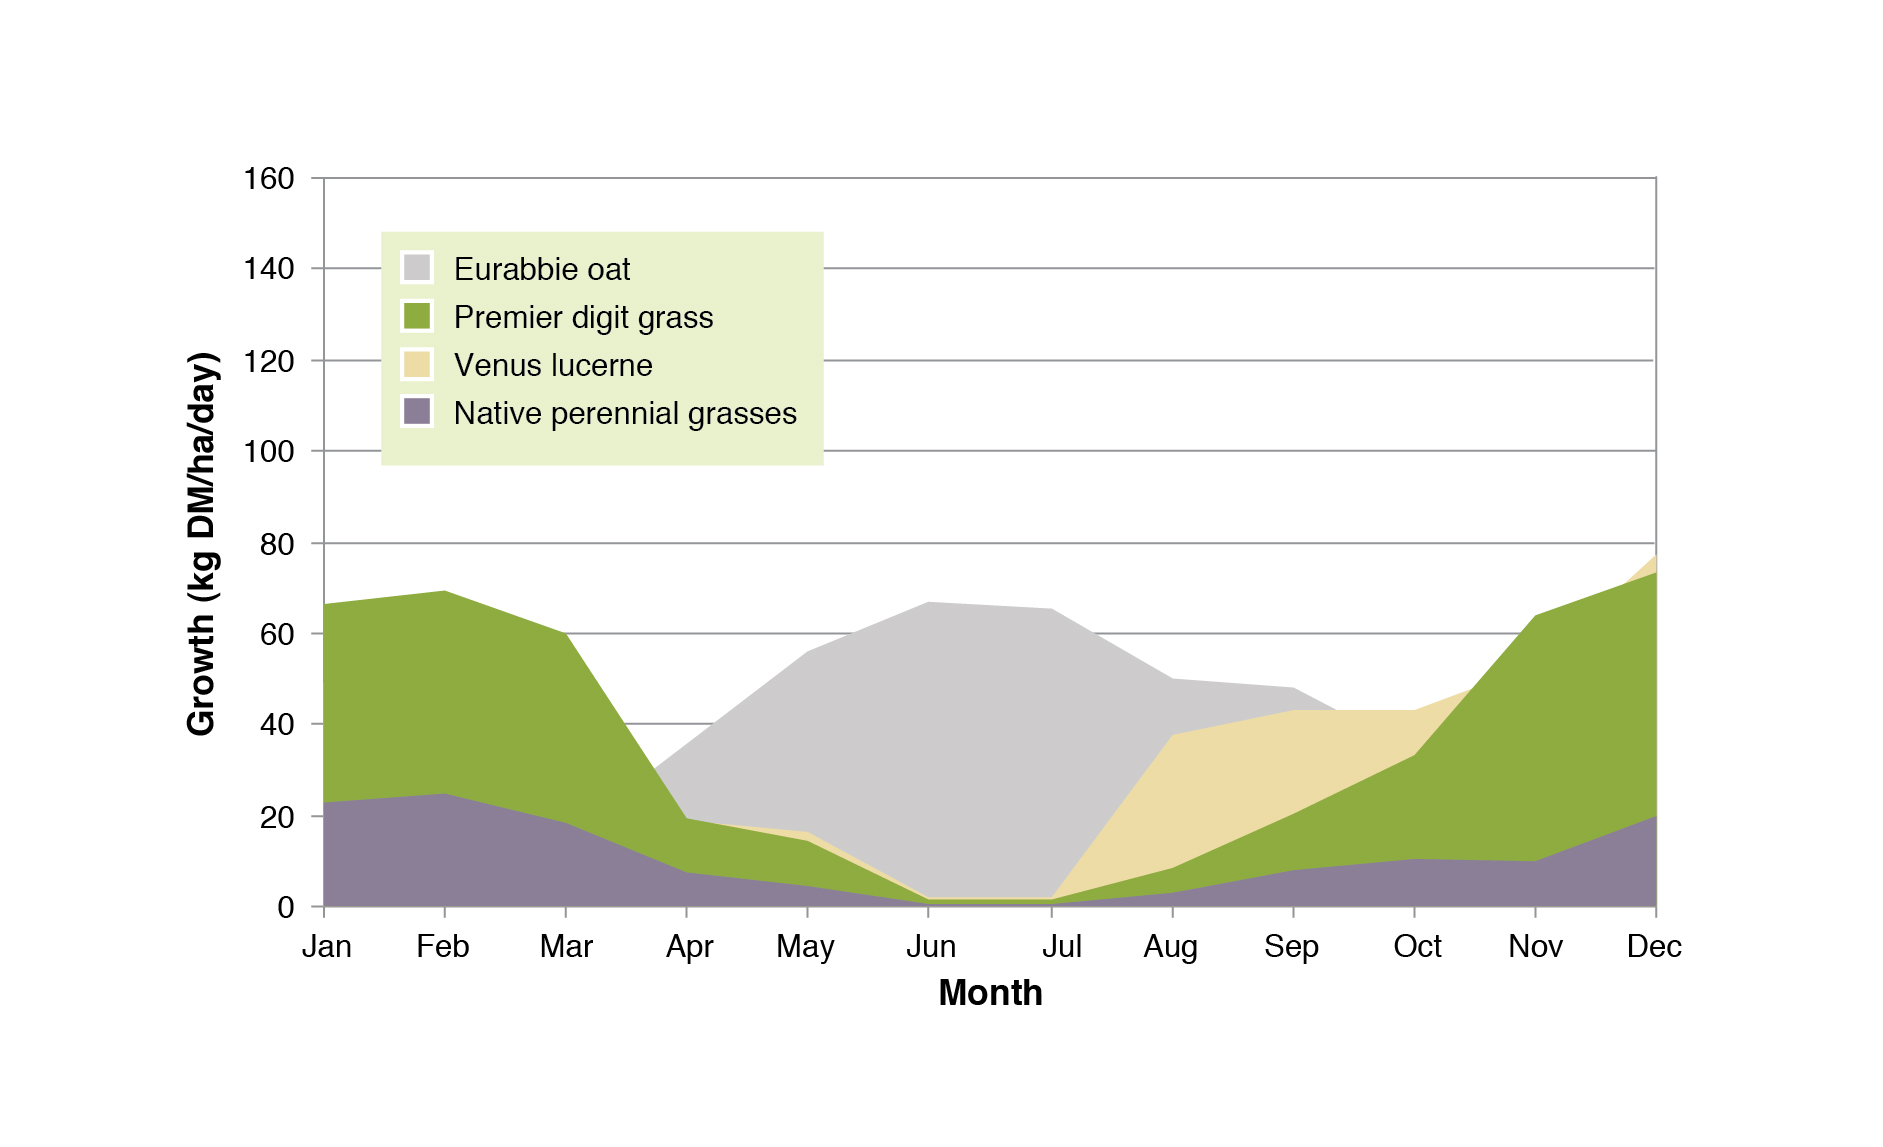
Daily pasture growth rates show how pastures could be integrated
Successful producers have demonstrated the importance of understanding the growth and dry matter production potential of different species throughout the year, so that different forage sources are always available to meet animal requirements. The value of integrating a range of forange sources across the farm can also be illustrated using daily pasture growth rates (Figure 3, Murphy et al. 2010). These data demonstrate that a forage system which combines Premier digit grass (November to March), Eurabbie oat (May to September) and lucerne (September to November) could provide growth >50 kg DM/ha/d for 11 months of the year.
Further information on pasture growth rates for other regions and a range of species can be found here.
|
|
What was done
On-farm monitoring of pasture and livestock conditions
In both 2008 and 2009, up to 15 individual commercial properties (18 individual properties over 2 years) on the northern slopes of NSW were monitored to gather on-farm data related to ewe production and pasture/forage systems. The on-farm data was used to examine the relationship between green feed availability, ewe fat score and sheep enterprise performance. All sites were grazed by spring-lambing Merino ewes joined to either Merino or terminal sires. The available feedbase varied from farm to farm, but for specific analyses were categorised into four key groups;
- poor native pasture (unfertilised, predominantly C4 grasses),
- good native pasture (a mixture of C3 and C4 grasses, fertiliser applied and legume oversown and/or supplementation used),
- native pasture, but with supplementation and lucerne available, and
- native pasture, but with oats and lucerne available.
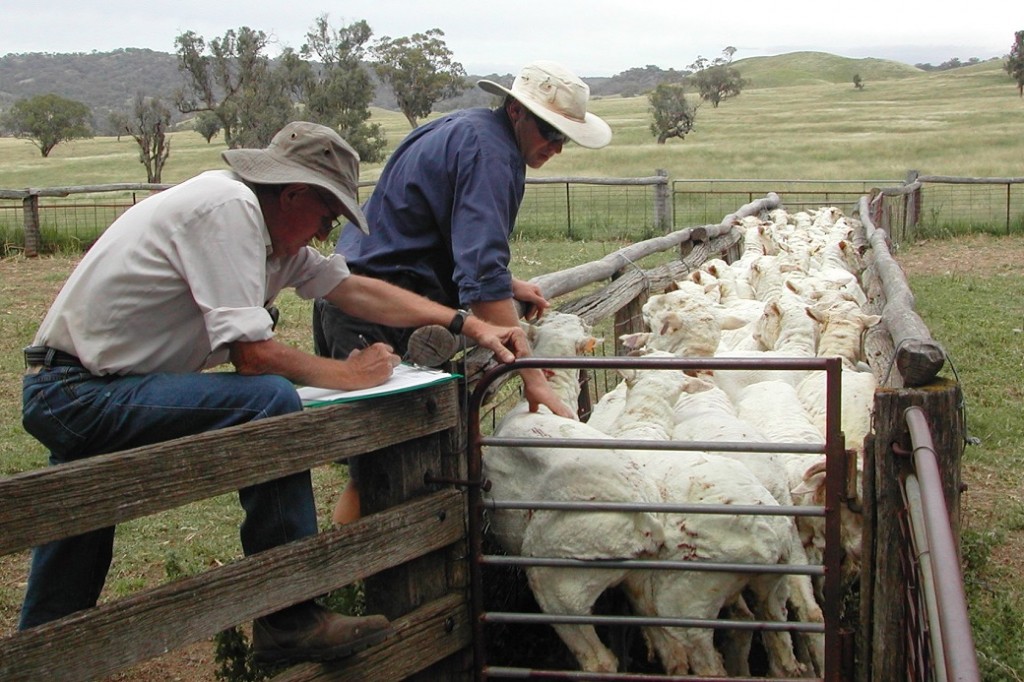
Livestock monitoring
For individual sheep mobs on each property (23 in 2008 and 21 in 2009), data were collected on weaning percentage (the number of lambs weaned as a proportion of the total number of ewes joined) and mean ewe fat score. Fat scoring* is a simple, objective measure to assess livestock condition and can be aligned to potential reproductive performance. Fat scores were assessed on 40 randomly selected ewes in each mob at the five critical reproductive stages;
- Joining,
- 100 days pregnancy,
- pre-lambing,
- marking, and
- weaning.
*Note, while fat scoring was used as the measure of condition in this study, condition scoring was used at other EverGraze sites. An explanation of the difference between the two measures, conversion rates and recommendations for optimum reproductive performance can be found here on the Lifetimewool website.
|
|
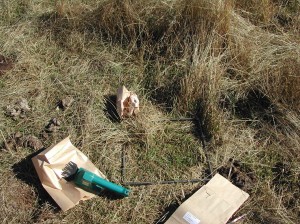
Pasture monitoring
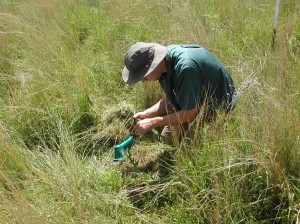
Pasture or forage paddocks that were grazed by a sheep mob were assessed every time the mob entered or was removed from each paddock. If animals remained in a paddock for an extended period, then samples were taken at 6 weekly intervals. At these times total herbage mass, the proportion of green (green herbage mass), the proportion of sown species, litter mass and ground cover were assessed. Since native perennial grass pastures were the focus of the EverGraze project, these were the dominant pasture type sampled, together with lucerne and forage oats.
Mean green herbage mass available to each sheep mob was calculated for;
- lamb weaning to ewe joining,
- joining to 100 days pregnancy,
- 100 days pregnancy to pre-lambing,
- pre-lambing to lamb marking, and
- marking to weaning.
Data were excluded from the analyses if the green herbage mass was mainly stem material and so unlikely to have a digestibility greater than the required 68% (See Reference table 7, Prograze).
 |
 |
| Total herbage mass, green herbage mass, the proportion of sown species, litter mass and ground cover were assessed in each paddock before and after grazing. | |
What was found
Rainfall
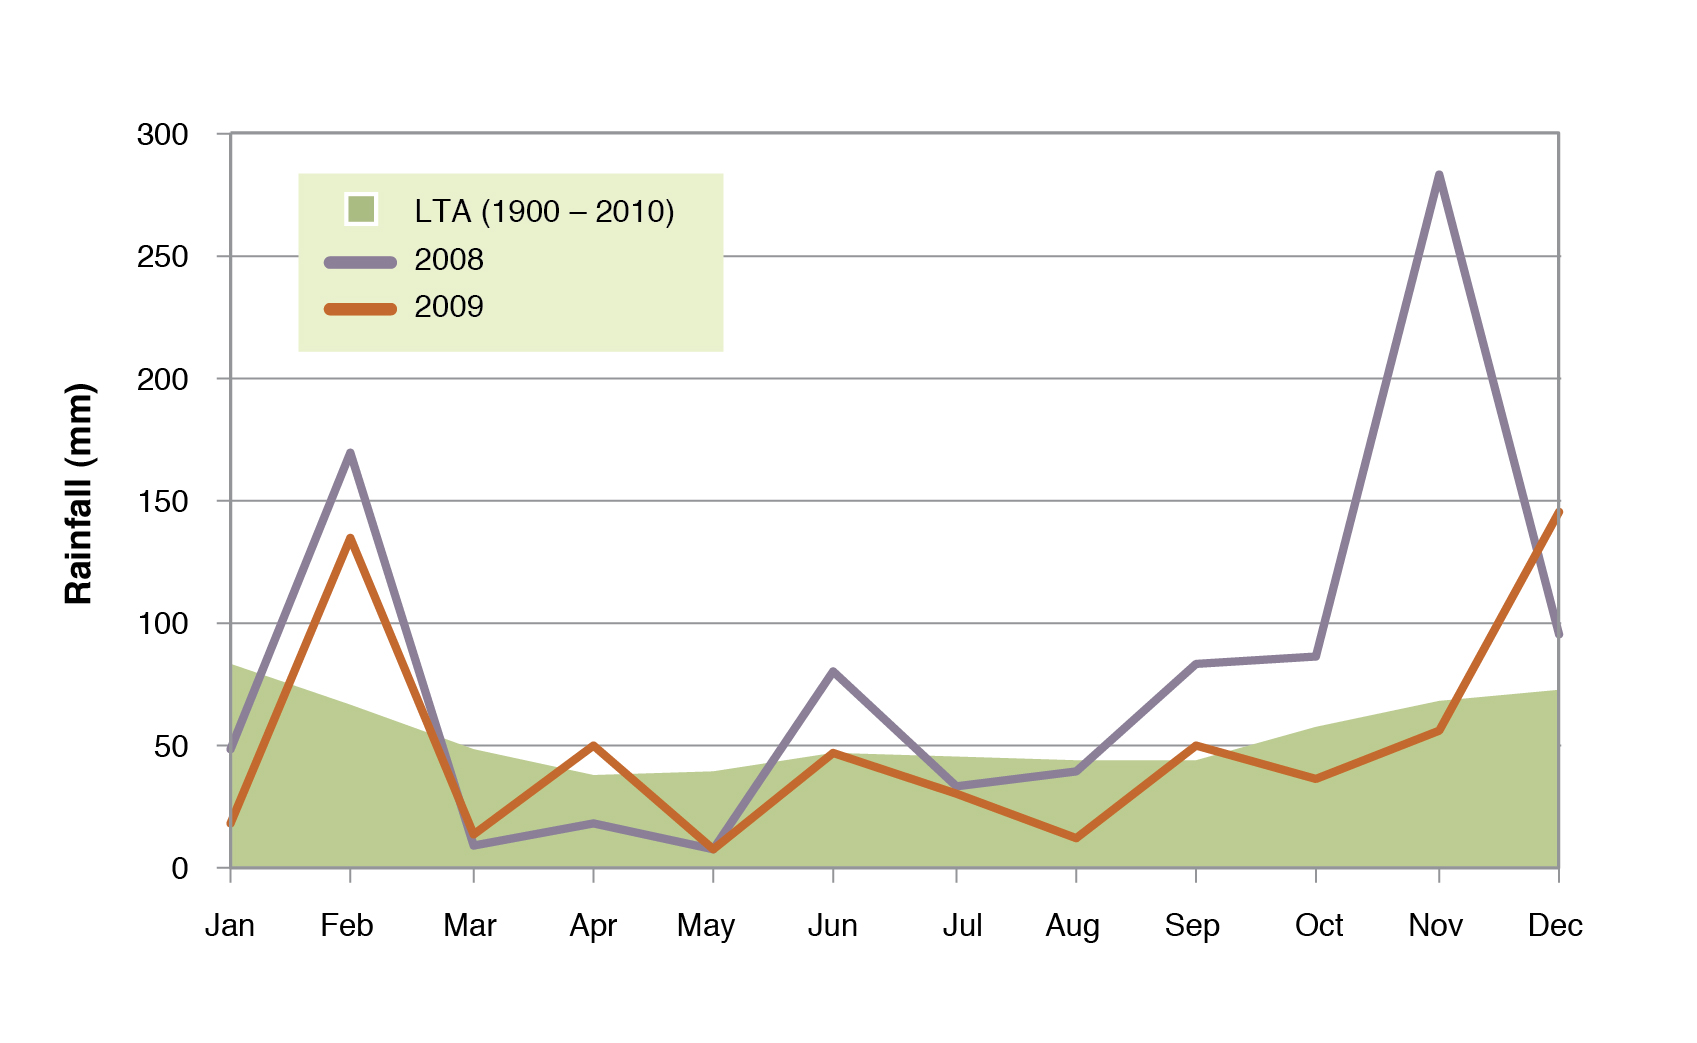
Although total annual rainfall in 2008 and 2009 across the North-West Slopes of NSW was generally average or above average, autumns were very dry, with autumn rainfall in Tamworth, for example, being 74 and 46% below average in 2008 and 2009, respectively (Figure 4).
|
|
Native grass pastures did not meet benchmark levels of green dry matter for ewes during late pregnancy or during lactation.
Ewes require adequate levels of green dry matter during late pregnancy to maximise lamb survival, ensuring adequate lamb birth-weight, and the ewe remains at the birth-site at lambing (see EverGraze Exchange – Lamb survival). During lactation, adequate green feed is required to meet lamb growth and development targets of the lamb while maintaining ewe condition prior to joining. The benchmark values of green dry matter are 1200 kg DM/ha for those in the last month of pregnancy and 1700 kg DM/ha for lactating ewes.
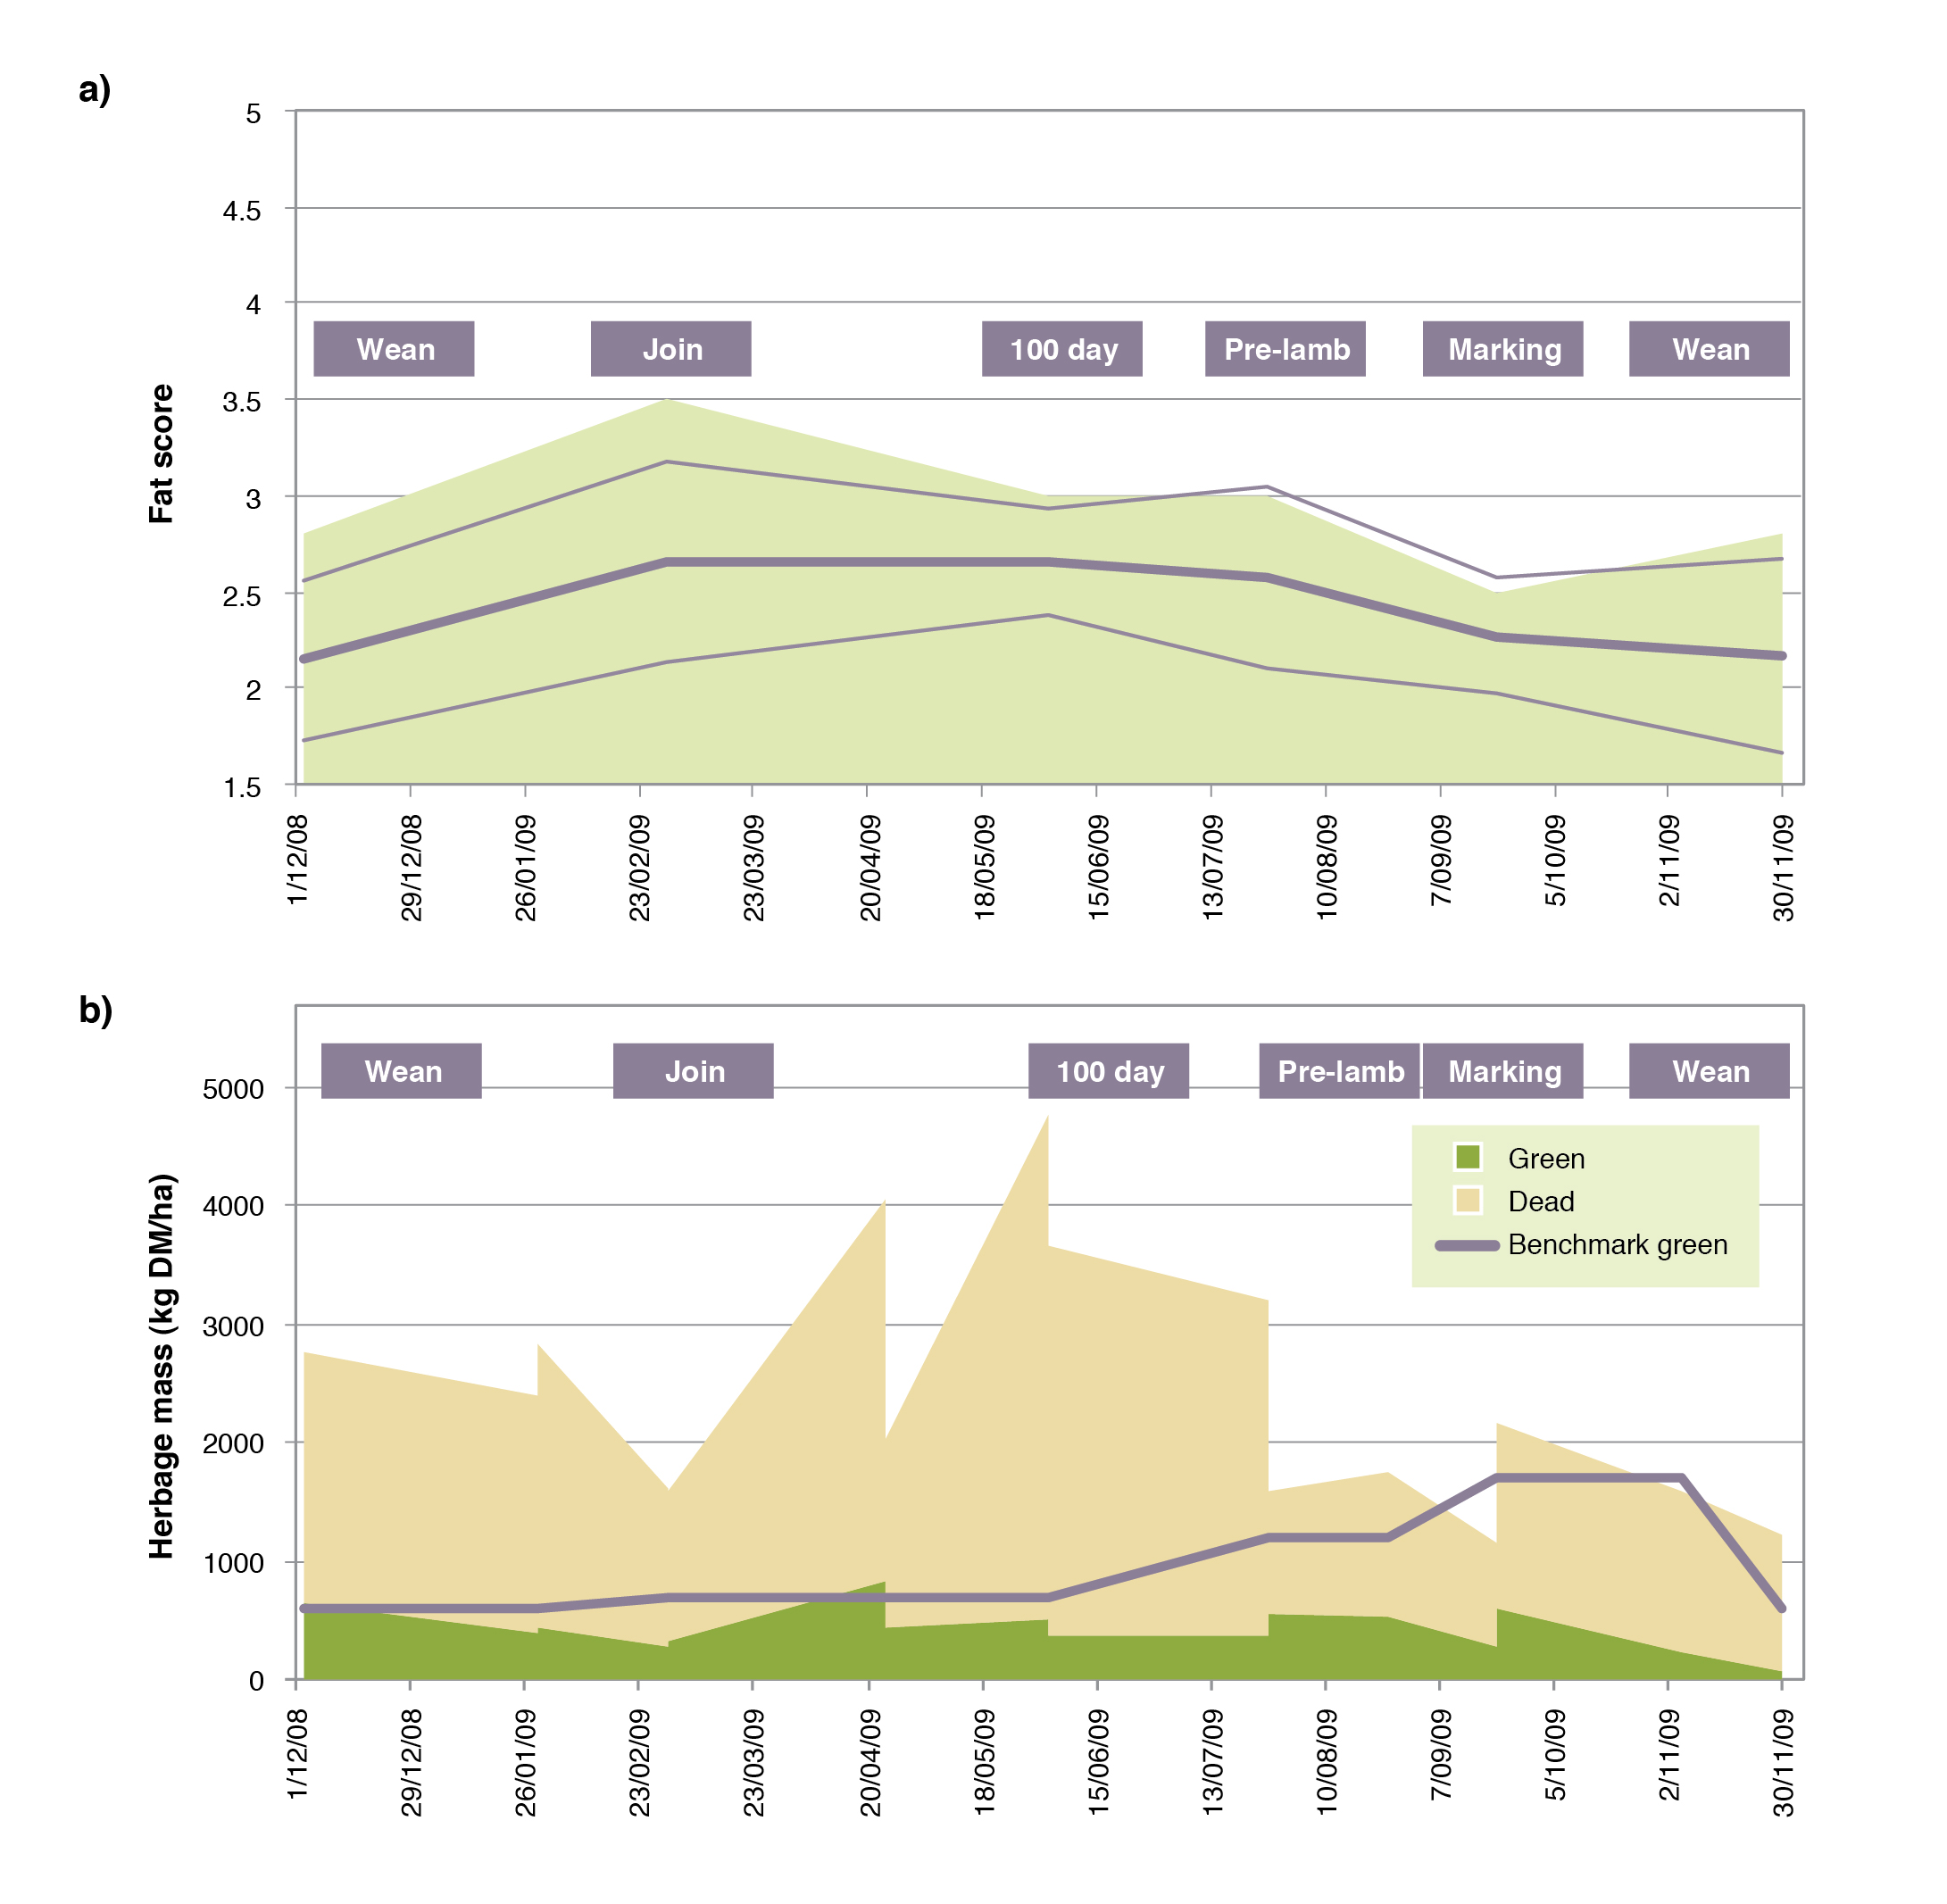
Poor native pastures failed to meet available green herbage mass benchmarks in both 2008 and 2009 (as illustrated by Figure 5b). The dry conditions combined with low temperatures in winter reduced the available green herbage mass of native pastures dominated by frost-sensitive C4 grasses to generally <300 kg DM/ha in the critical June to September period. The resulting ewe fat scores were below benchmarks throughout the two years and are presented in Figure 5a.
Further examination of the data indicated that the required benchmark levels for green herbage mass in late pregnancy and lactation were never met by the native grass pastures (good or poor), and were only met by lucerne and forage oat paddocks on a few properties.
|
|
|
|
|
Ewes on native pastures had lower weaning percentages
Fat score data at each reproductive stage was compared against Lifetimewool targets for mobs of ewes grazing pastures grouped into four feedbase categories, illustrating increased weaning percentages when higher quality forages or supplementation were available (Figure 6, Table 1).
As a result of the inadequate green herbage mass, fat scores of ewes grazing poor native pastures were below minimum benchmarks for the duration of the reproductive cycle, and ewes grazing good native pastures were below benchmarks at joining and lambing. Those mobs recorded very poor lamb weaning percentages (70-82%, Figure 6). Where native pastures were integrated with lucerne, forage oats and/or adequate supplements, condition targets were met and mobs recorded higher weaning percentages (109-115%, Figure 6).
When data for all mobs across both years were analysed there was a significant (P<0.05) linear relationship between lamb weaning percentage and ewe fat score throughout the reproductive cycle. The relationship was strongest for data at joining (r = 0.95) each year, indicating that higher weaning percentages resulted from increased conception rates.
|
|
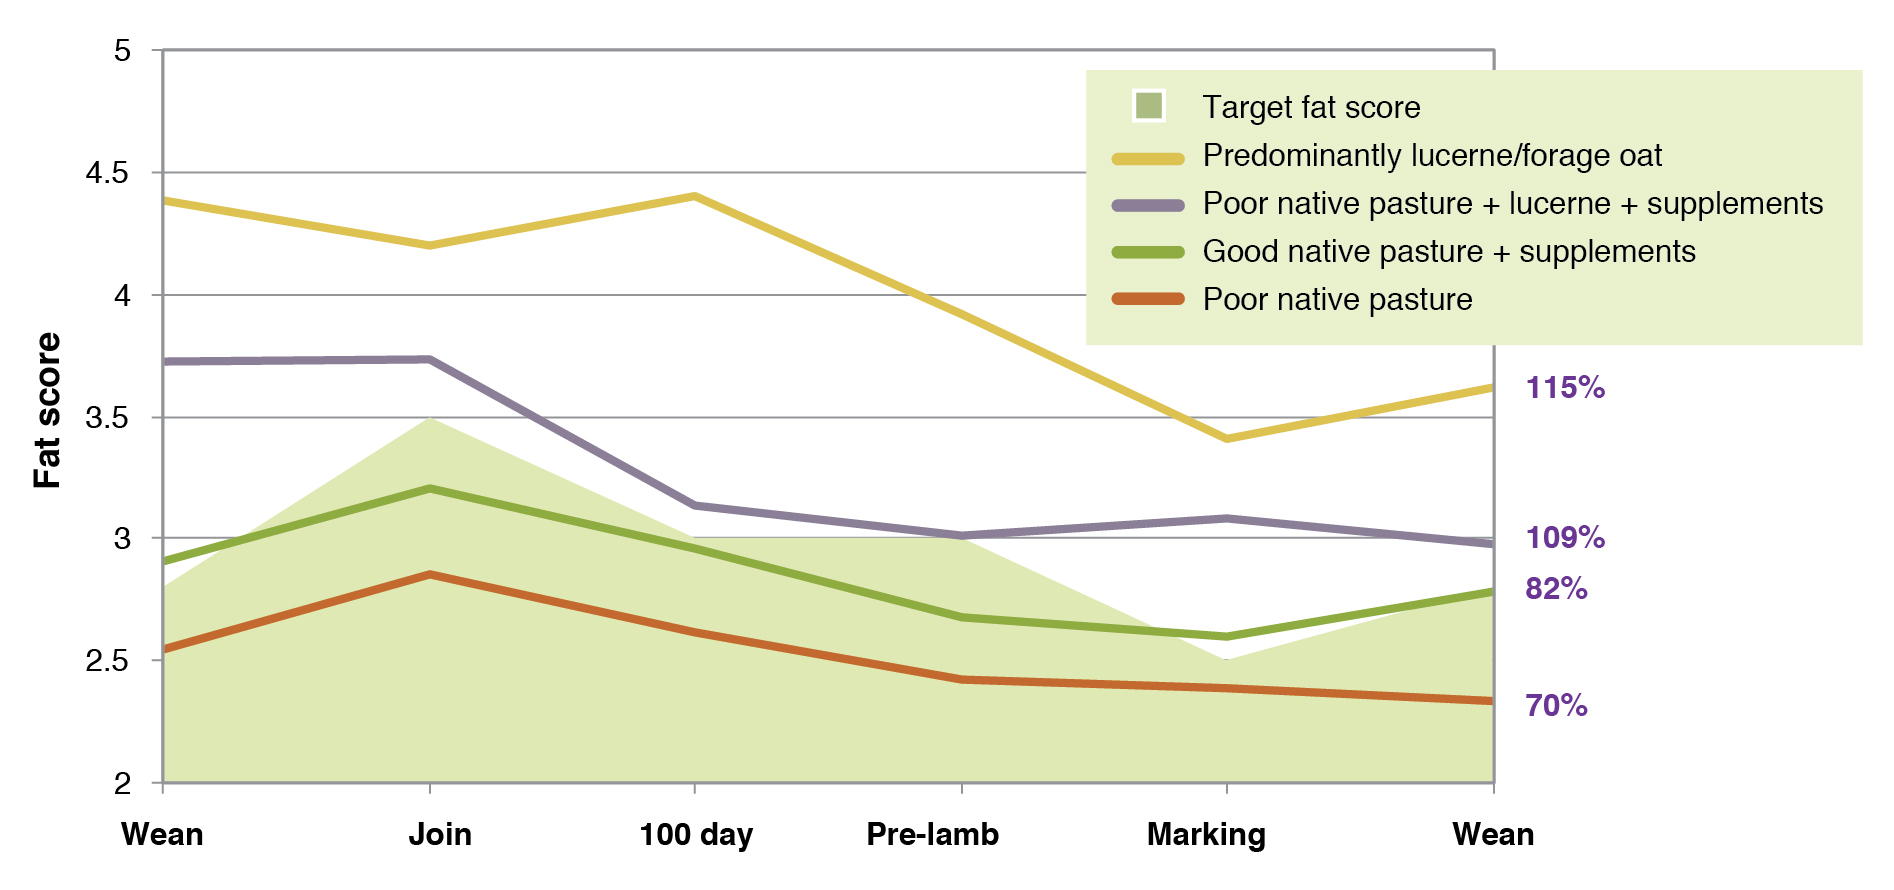
Table 1. Target ewe fat score (in perentheses) at each stage in the reproductive cycle and mean fat score values and lamb weaning percentages in 2008 and 2009 for mobs grazing either an unfertilised poor native pasture, a good native pasture (mixture of C3 and C4 grasses, fertiliser applied and legume oversown and/or supplements used), a poor native pasture (predominantly C4 grasses with lucerne and/or supplements used) or a predominantly lucerne/forage oat system. Values were averaged across mobs and farms.
| Ewe fat scores | |||||||
| Feedbase | Weaning(2.8) | Joining(3.5) | 100 days(3) | Pre-lambing(3) | Marking(2.5) | Weaning(2.8) | Weaning(%) |
| 2008 | |||||||
| Poor native pasture | 3.0 | 3.2 | 2.5 | 2.3 | 2.7 | 2.6 | 72 |
| Good native pasture + supplements | 3.2 | 3.5 | 3.2 | 3.0 | 3.3 | 2.9 | 84 |
| Poor native pasture + lucerne + supplements | 3.7 | 4.3 | 4.3 | 2.7 | 3.8 | 3.7 | 89 |
| Predominately lucerne/forage oats | 3.8 | 4.4 | 4.2 | 4.2 | 3.8 | 4.4 | 121 |
| 2009 | |||||||
| Poor native pasture | 2.5 | 2.9 | 2.6 | 2.4 | 2.4 | 2.3 | 70 |
| Good native pasture + supplements | 2.9 | 3.2 | 3.0 | 2.7 | 2.6 | 2.8 | 82 |
| Poor native pasture + lucerne + supplements | 3.7 | 3.7 | 3.1 | 3.0 | 3.1 | 3.0 | 109 |
| Predominately lucerne/forage oats | 4.4 | 4.2 | 4.4 | 3.9 | 3.4 | 3.6 | 115 |
Using pooled data, lamb weaning percentage was predicted for given ewe fat scores at joining in each year. At the recommended fat score at joining of 3.5, the predicted mean lamb weaning percentage was 84% for the mobs scored and conditions experienced in 2008, and 94% for those in 2009 (Table 2). The benefit of having ewes in higher condition at joining varied with season. In 2009, there was greater benefit to weaning percentage from having ewes in better condition, by utilising a range of forages, and a greater penalty to weaning percentage of having ewes in poor condition, if poor native pasture was utilised.
Table 2. Predicted lamb weaning percentage (%) for ewes with high, low and recommended fat score (FS) at joining in the 2008 and 2009 seasons.
| Condition at Joining | 2008 | Predicted weaning % | 2009 | Predicted weaning % |
| High FS | 4.4 | 107 | 4.2 | 123 |
| Recommended FS | 3.5 | 84 | 3.5 | 94 |
| Low FS | 3.2 | 76 | 2.9 | 70 |
Crunching the numbers
Enterprise case studies were conducted on commercial properties studied during the on-farm monitoring program to identify production parameters (e.g. stocking rates, feedbase, lamb marking and weaning rates) and variable costs (e.g. supplementation, forage crop establishment, and annualised cost of pasture establishment and maintenance). Input was also sought from experienced local livestock advisory staff on typical enterprise performance under each scenario. It was evident that due to the high variability of soil type, feedbase, elevation and rainfall in northern NSW, there was no single ‘recipe’ of pasture combinations that was going to be the most profitable across the region as a whole. The relative profitability of specific management interventions to increase weaning percentage or identify preferred forage base within enterprise options was explored by constructing budgets based on the existing NSW DPI livestock gross margin budgets (2009). A gross margin can be defined as the gross income from an enterprise less the variable costs incurred in achieving it.
For specific feedbase x enterprise combinations on the North-West Slopes of NSW (Table 3), representative gross margin budgets for the region were used to explore:
- benefit of providing grain supplement to ewes during final 50 days of pregnancy to increase weaning percentage by 5% in a Merino x Merino enterprise;
- benefit of providing grain supplement to ewes during final 50 days of pregnancy to increase weaning percentage by 5% in a Merino x Terminal sire enterprise;
- benefit of using grain supplement, forage oat and lucerne to increase weaning percentage by 15% in a Merino x Terminal sire enterprise;
- value of forage oat to ewes and lucerne to lambs in a First Cross ewe enterprise; and
- preferred forage base of lucerne, oat or perennial pasture for 1000 lambs traded to meet market specification of 50 kg liveweight.
The analyses indicates that for enterprises where forage is dominated by native pastures, highest gross margins were achieved when:
- in Merino x Merino or Merino x Terminal sire enterprises, ewes were supplemented during pregnancy;
- in Merino x Terminal sire or first cross ewe enterprises, ewes were grazed on oats and lambs on lucerne;
- in trade lamb enterprises, lambs were grazed on forage oats then a mix of oats and lucerne and finally lucerne alone.
The degree to which these budgets reflect actual returns will be influenced not only by general factors common to all farms, such as prices and seasonal conditions, but also by the individual farm characteristics, such as soil type, crop rotation, pasture quality and management.
Table 3. Regional gross margins for sheep based enterprises generated using data from on-farm monitoring on the North-West Slopes of NSW.
| Livestock system | Area (ha) | Flock size | Weaning % | Gross Margin $ |
Gross Margin $/ha |
Gross Margin $/DSE |
| Merino x Merino on good native pasture fertilised every four years | ||||||
| No supplement | 400 | 762 ewes | 80% | 37,394 | 93 | 23 |
| Grain supplement for ewes | 400 | 762 ewes | 85% | 40,547 | 101 | 25 |
| Merino x Terminal on good native pasture fertilised every four years | ||||||
| No supplement | 400 | 762 ewes | 80% | 45,396 | 113 | 28 |
| Grain supplement for ewes | 400 | 762 ewes | 85% | 48,985 | 122 | 31 |
| Merino x Terminal on good native pasture fertilised every four years | ||||||
| Grain supplement for ewes + forage oat (40ha) for lambs | 400 | 762 ewes | 85% | 49,310 | 123 | 31 |
| Forage oat (50 ha) for ewes + lucerne (60 ha) for lambs | 400 | 857 ewes | 100% | 51,387 | 128 | 29 |
| First cross ewes on good native pasture fertilised every two years | ||||||
| Forage oat (50 ha) for ewes + lucerne (60 ha) for lambs | 400 | 720 lambs | 115% | 49,474 | 124 | 27 |
| Trading lambs to meet market specification | ||||||
| Lambs on an forage oat (31 ha)/lucerne (42 ha)/ native pasture fertilised each year (4 ha) | 77 | 1000 lambs | na | 21,614 | 281 | 27 |
| Lambs on lucerne | 95 | 1000 lambs | na | 18,984 | 200 | 21 |
| Lambs on an forage oat | 60 | 1000 lambs | na | 23,200 | 387 | 26 |
Putting the research into practice
What are the successful producers doing differently?
A range of observations were made of management decisions taken by graziers across the on-farm monitoring program. Leading producers (as identified by peers and advisors, Lodge 2011c) compared with other graziers tended to;
- have higher proportions of lucerne, forage oats (sown in late summer rather than autumn) and native pastures over-sown with subterranean clover and achieved up to 20% higher lambing and weaning percentages,
- confine joining to a 6−8 week period,
- scan ewes at 80−90 days pregnancy to detect dry, single and multiple lamb bearing ewes, using this knowledge to make informed management decisions, and
- sell trade quality lambs (~45 kg liveweight) using contracts.
One leading producer that focused on growing and fattening trade lambs on lucerne and oats indicated their aim was “…to have the most productive pastures to meet target weight gains”. The central operating strategy was to only purchase prime lambs if the forage budget indicated sufficient feed was on hand to grow animals and meet the contract specifications. Ongoing awareness of the market, both in terms of the price of purchased lambs and contracts for finished lambs was crucial. Establishing lucerne by sowing under wheat and planting forage oats early in the season in order to make use of late summer rainfall and fallow moisture, were key tactical decisions.
Establishing and integrating a range of forage sources
The on-farm observations demonstrated that establishing a range of forage sources across the farm is one way to meet livestock condition targets. In an EverGraze case study, John and Laurie Chaffey from Somerton, north of Tamworth, explained how this strategy worked for them. By replacing old cropping paddocks with tropical grasses, lucerne and forage crops, and integrating their management with the existing native pastures, the Chaffey’s were able to fill the autumn feed gap as well as manage water use and soil erosion across the farm. They said the disadvantages were that they had less time on their hands due to the demands of a mixture of land uses, and grazing management was tricky, but not impossible.
The EverGraze principle put the Right Plant in the Right Place for the Right Purpose with the Right Management summarises the key considerations for selecting and establishing pastures. Each pasture species combination has specific soil fertility, moisture and landscape position requirements. These need to be considered together with the existing feed supply and demand profile to select an appropriate species for the right part of the landscape to fill the gaps. Key guidelines for putting the principle into action are provided in the EverGraze Exchange – Pastures for Place and Purpose. Guides to the place and purpose of individual species are provided on the Feedbase and pasture species page.
The MLA Feed Demand Calculator can be used to determine your existing feed supply/demand profile and identify the potential benefit of making changes to the feedbase, stocking rate or calving/lambing time.
Once you’ve selected a pasture species, the EverGraze Pasture Improvement Calculator can be used to determine the cost of establishment and the potential return. It’s important to consider what other options might meet the need, such as using supplements combined with improving the quality of existing native pastures. The EverGraze guide to assessing the costs and benefits of pasture establishment provides further details on economic analysis, including consideration of the intangible costs and benefits.
The NSW DPI Eight steps for pasture establishment (for temperate perennials), and the Tropical perennial grasses guides provide information on successful methods of establishing pastures.
Increasing quality of native pastures
In addition to establishing new species, improved management of native pastures may increase quality of the forage base if targeted grazing management is used to manipulate composition of the sward. The first step is to identify which species are in the pasture. EverGraze Native Pastures for the Eastern Namoi and Native Pastures for the Bundarra District provide guides for identifying native pastures in the region. The presence of subterranean clover together with C3 native species such as weeping grass (Microlaena) and wallaby grass indicate that the pasture will be responsive to increased soil fertility. Subterranean clover can also be oversown into a native pasture, but requires application of fertiliser to achieve best response. Research at Holbrook suggests that this is best undertaken by direct drilling the seed rather than broadcasting. Soil fertility will need to be maintained to ensure the persistence and production of the subterranean clover. Where the pasture is dominated by C4 native grasses and has low legume content, it is less likely to respond to increased soil fertility and ewes grazing these pastures will need to be supplemented to meet condition targets.
 |
 |
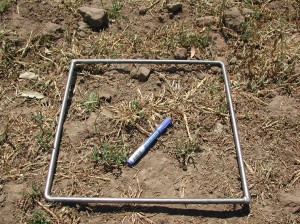
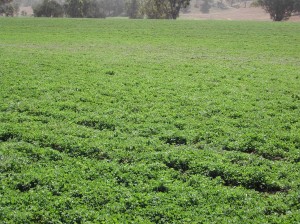
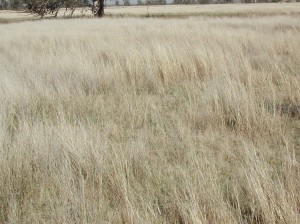
| Poor native pasture showing low levels of available green (left) and good native pasture showing high green herbage mass | |
Tightening up monitoring for effective tactical management
The results from the monitoring sites indicate that productivity gains can be made by meeting ewe fat score and green herbage mass targets throughout the reproduction cycle. Achieving these targets requires that producers:
- are aware of the critical benchmarks for fat (or condition) score, provided on the Lifetimewool website;
- are aware of the Prograze critical benchmarks for green herbage mass provided in Table 7 on the EverGraze reference tables page;
- stay on top of monitoring fat score at each of the critical reproductive stages (this needs to be done physically rather than visually since visual assessments are not accurate, England 2009);
- stay on top of monitoring green herbage mass using the AWI Feed on Offer gallery or the Prograze correlation between pasture height and density provided in Table 8 of the EverGraze reference tables (also see Lodge et al., 2011b).
- Use feed and fodder budgets to make decisions ahead of time for purchase of supplements, moving stock to a new paddock, trading stock or conserving fodder. The EverGraze Feed budgeting and tactical management page or the Lifetimewool feed budgeting page can be used to help with these decisions.
At the monitoring sites, there were no graziers that used fat scoring on a regular basis, and most used experiential knowledge rather than objective measurements to make grazing decisions. There is therefore significant scope for increased lamb weaning percentages simply by putting best practice monitoring procedures in place. Some producers were aware of the Prograze green herbage mass benchmarks and the differing animal nutritional requirements throughout the reproductive cycle and actively managed to provide lucerne, forages and supplements to meet any deficits.
Who gets the green feed?
On many properties there was a constant conflict between the use of quality green feed for cattle production and its availability for ewes and lambs, with the cattle often winning out. Allocation of limited green feed to different livestock classes needs to consider the equivalent cost of feed to meet condition benchmarks or growth targets of each class. The ration development calculator in the Feed Budget Rotation Planner can be used to determine the cost of feeding under each scenario. The Tactical management of green feed calculator can also be used for sheep to compare the benefits of grazing ewes v. weaner sheep v. lambs on available green feed.
What it all means
For commercial sheep mobs monitored as part of the EverGraze project on the North-West Slopes of New South Wales, lamb weaning percentage increased with higher ewe fat score, particularly at joining. Available green herbage mass for native perennial grass based pastures was below the minimum benchmark level for spring lambing ewes, particularly in the critical June to September period. The data reinforced the need to integrate native grass pastures with paddocks of either lucerne or forage oats and/or the provision of adequate protein and energy supplements to achieve high weaning percentages.
Acknowledgements
EverGraze is a Future Farm Industries CRC research and delivery partnership. The Tamworth EverGraze Proof Site team was led by Dr Sean Murphy (2010-2013) and Dr. Greg Lodge (2007-2009) at the Department of Primary Industries, Tamworth NSW. An enthusiastic regional advisory group consisting of farmers, consultants, extension officers and CMA staff provided significant input into the direction, management practices and interpretation of outcomes from the experiment and modelling to make them relevant to farmers.
Authors and contributors
Dr Sean Murphy, Department of Primary Industries, Tamworth, NSW.
Lester McCormick, Department of Primary Industries, Tamworth, NSW.
Further Information
- EverGraze Feed Budgeting and Tactical Management
- EverGraze reference tables
- Lifetimewool fat score targets
- AWI Feed on Offer Library
- EverGraze Livestock Systems EverGraze Exchange
- EverGraze Case Study – Integrating native pastures, John and Laurie Chaffey
- Murphy SR, Lodge GM, McCormick LA, Johnson IR (2010) Using growth and dry matter estimates to devise year-round forage systems for the North-West Slopes of New South Wales. In ‘Food security from sustainable agriculture, Proceedings of the 15th Australian Agronomy Conference, Lincoln, New Zealand’.
- Lodge GM, Brennan MA, Sanson PT, Roworth BR, Stace IJ (2011a) On-farm monitoring of sheep and pasture production in the EverGraze northern New South Wales project. In, ‘Proceedings of the 26th Annual Conference of The Grassland Society of NSW’. (Eds G Lodge, W Wheatley, J Scott). pp. 111-114. (The Grassland Society of NSW Inc.: Orange)
- Lodge GM, Brennan MA, Sanson PT, Roworth BR, Stace IJ (2011b) Using height and density to estimate the herbage mass of different pastures in northern New South Wales. In, ‘Proceedings of the 26th Annual Conference of The Grassland Society of NSW’. (Eds G Lodge, W Wheatley, J Scott). pp. 123-126. (The Grassland Society of NSW Inc.: Orange)
- Lodge GM (2011c) Surveys of grazing industry end-users in northern New South Wales. In ‘Proceedings of the 26th annual conference of the Grassland Society of NSW’. (Eds G Lodge, W Wheatley, J Scott). pp. 107-110. (Grassland Society of NSW Inc.: Orange).
