Tamworth Proof Site climate
Northern NSW has a variable climate compared with most other parts of Australia, receiving weather systems from both northern and southern influences. Climatically, the area can be classified as sub-humid with a summer dominant rainfall distribution. Average annual rainfall in Tamworth (1889-2010) is 667 mm, with just 40% of the annual total occurring in Autumn-Winter and the wettest months being December and January. Frosts occur throughout the region from mid April to September, creating a growing season of seven to nine months. Mean daily maximum temperatures range from 30-34°C in January and from 12-16°C in July. Details of climate and variability throughout the Northern NSW EverGraze region can be found in the Regional Context.
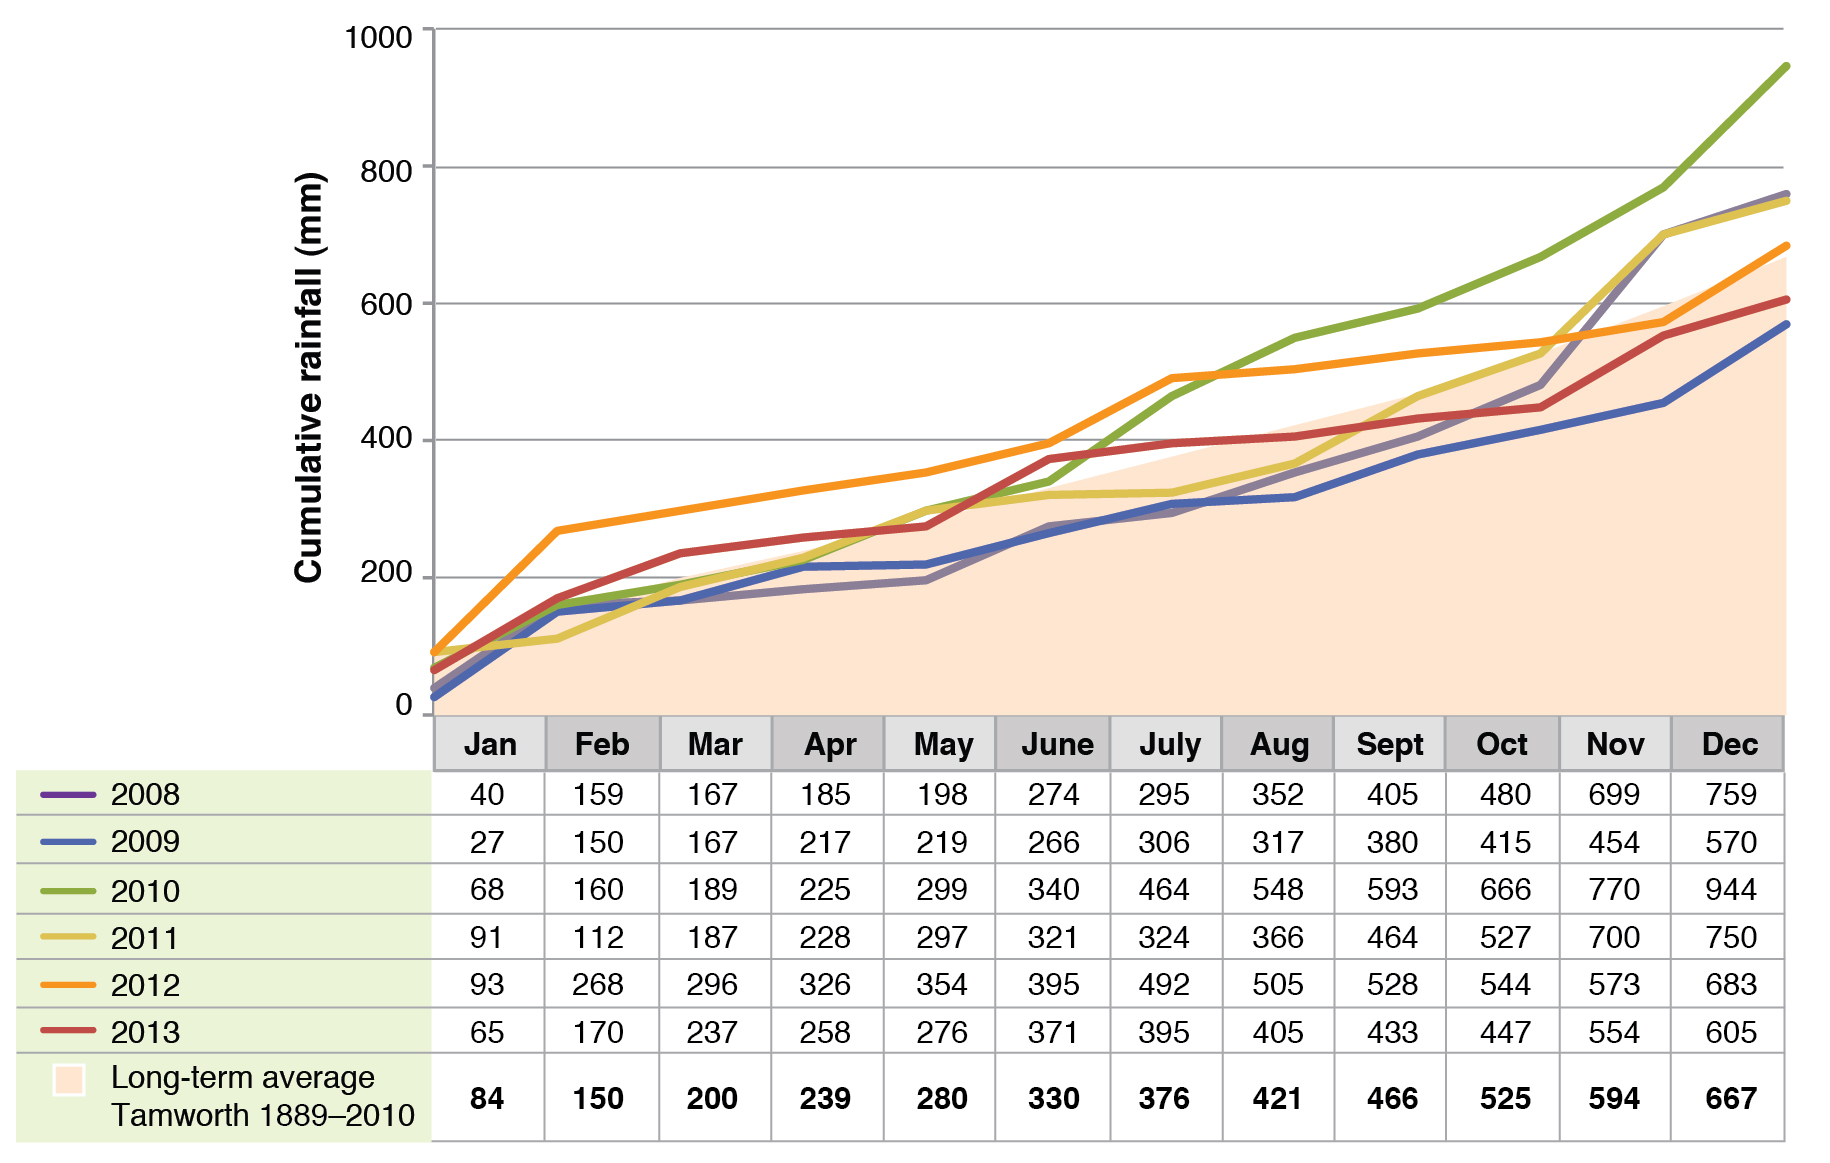
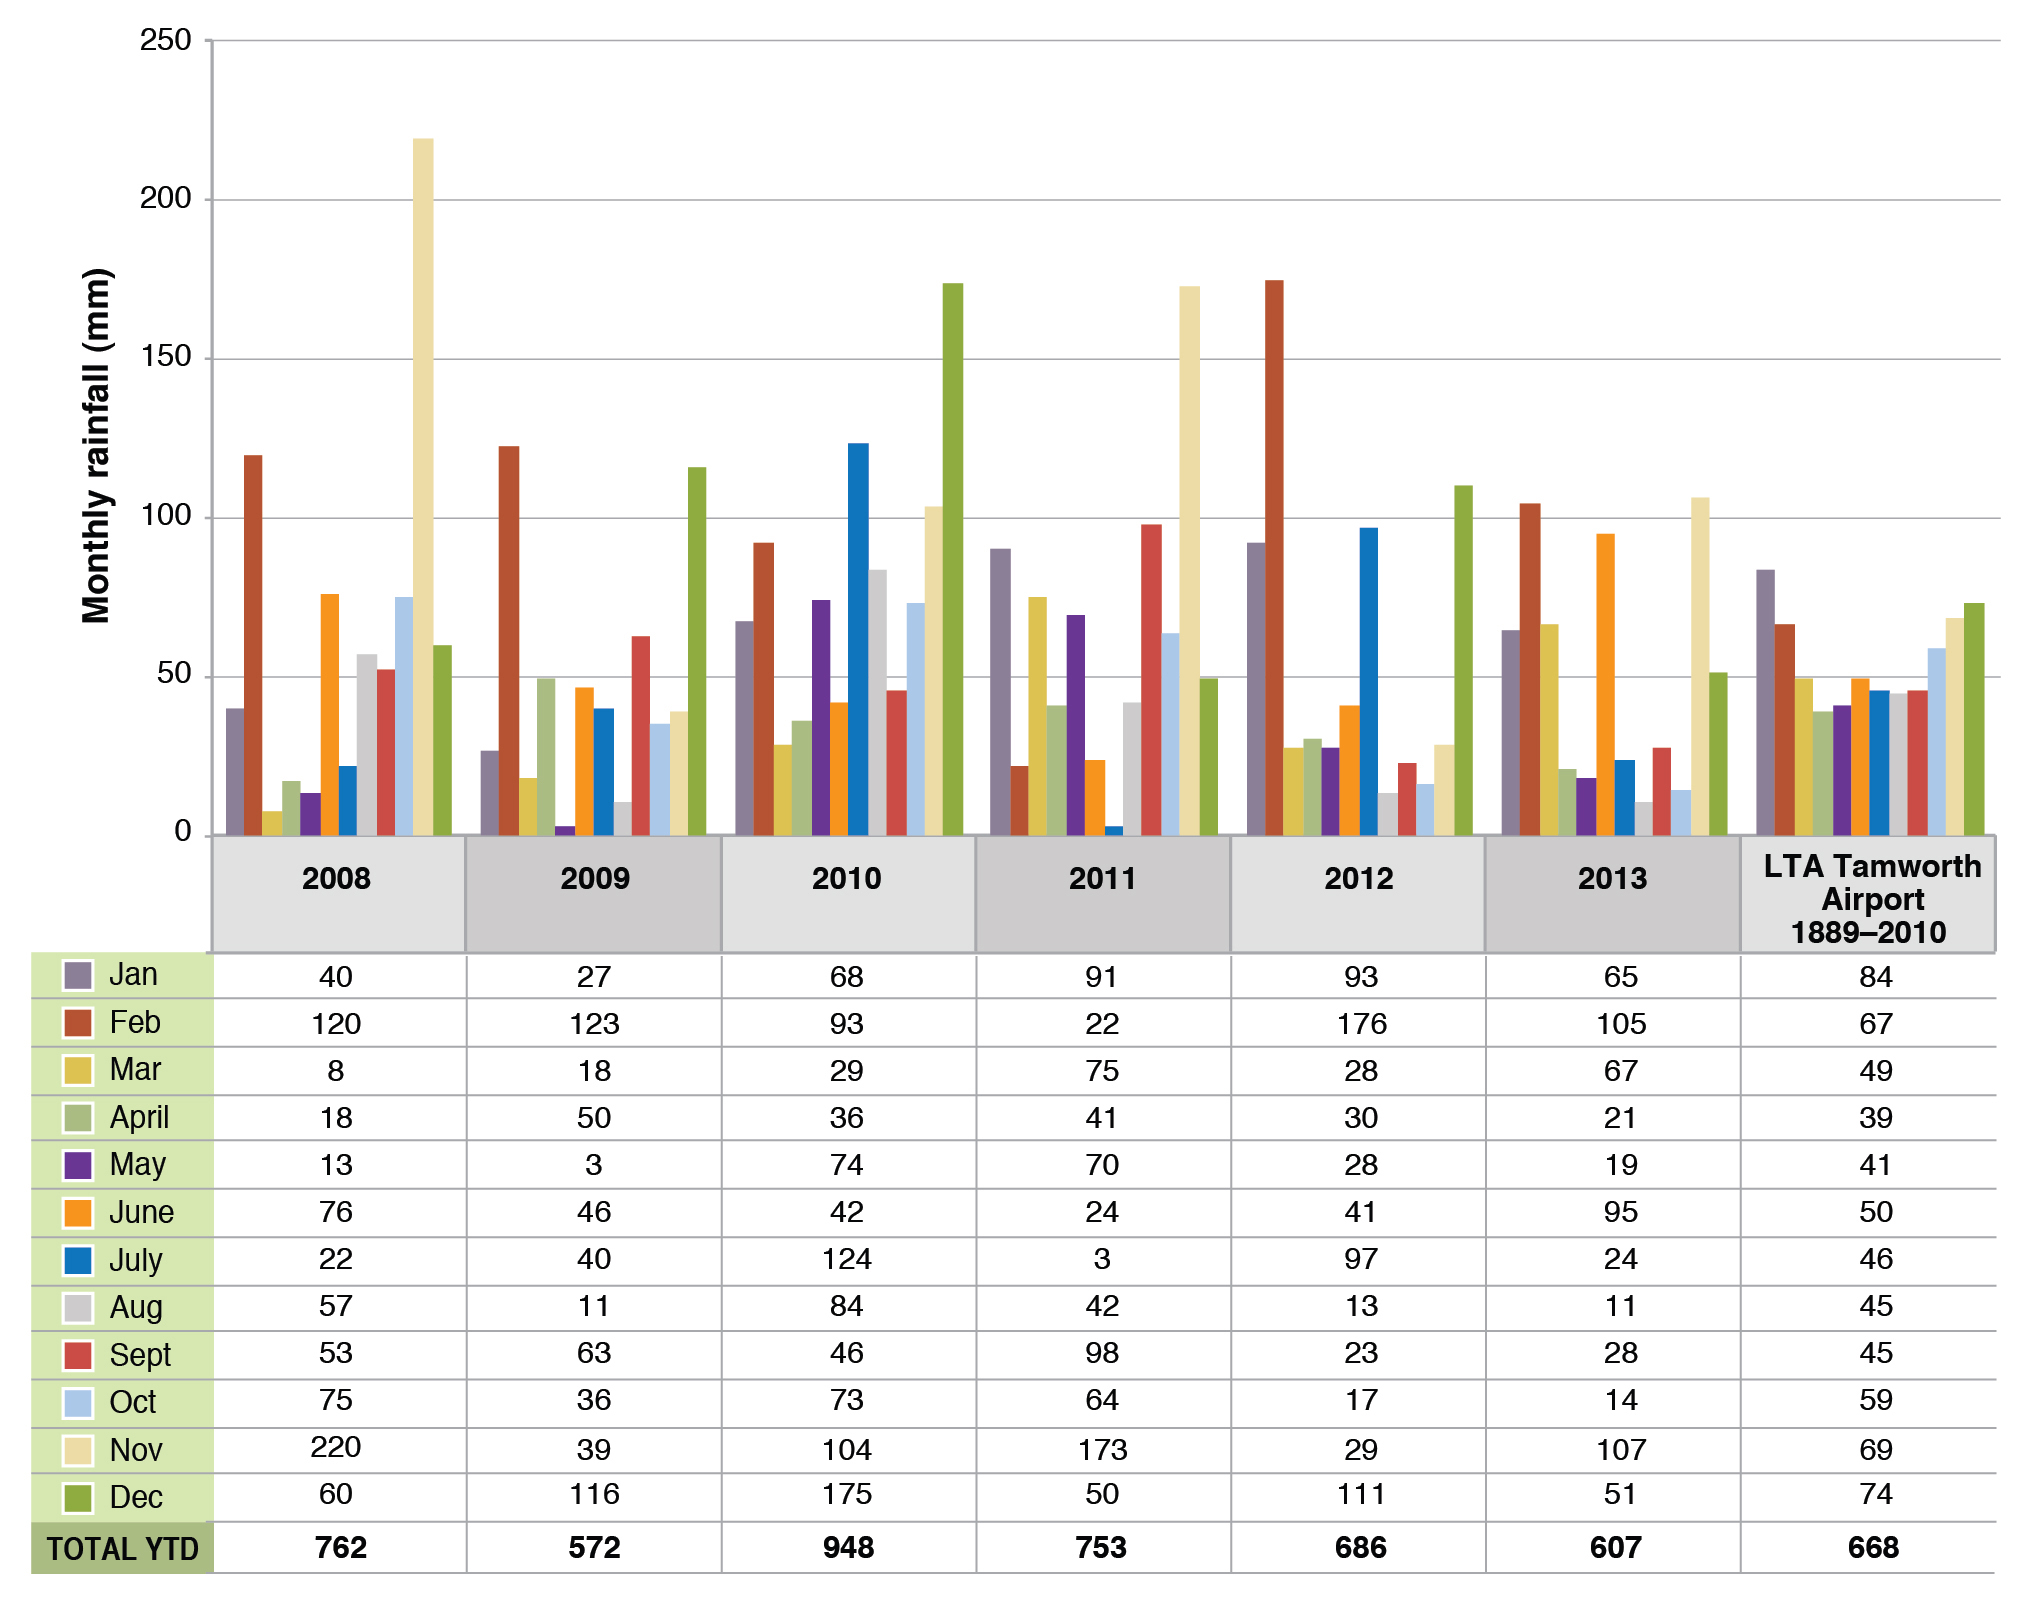
Both annual and seasonal rainfall were variable during the years of the Tamworth Proof Site experiments ( Figures 1 and 2). Annual rainfall was near to the long term average in 2012 (683 mm, decile 5), well above average in 2010 (944 mm, decile 9), above average in 2008 and 2011 (759 and 750 mm, respectively, decile 7) and below average in 2009 and 2013 (570 and 592 mm, respectively, decile 4). Seasonal rainfall was typically variable, with one or more seasons in each year having below average rainfall, except for 2010 where rainfall in all seasons was above average. Autumn is typically the driest season with four years (2008, 2009, 2012 and 2013) having total rainfall below the long-term average. Rainfall totals in the winters (2009, 2011 and 2013) and springs (2009, 2012, and 2013) of three years were below average. Rainfall in summer exceeded the long term average in all years, except 2011.
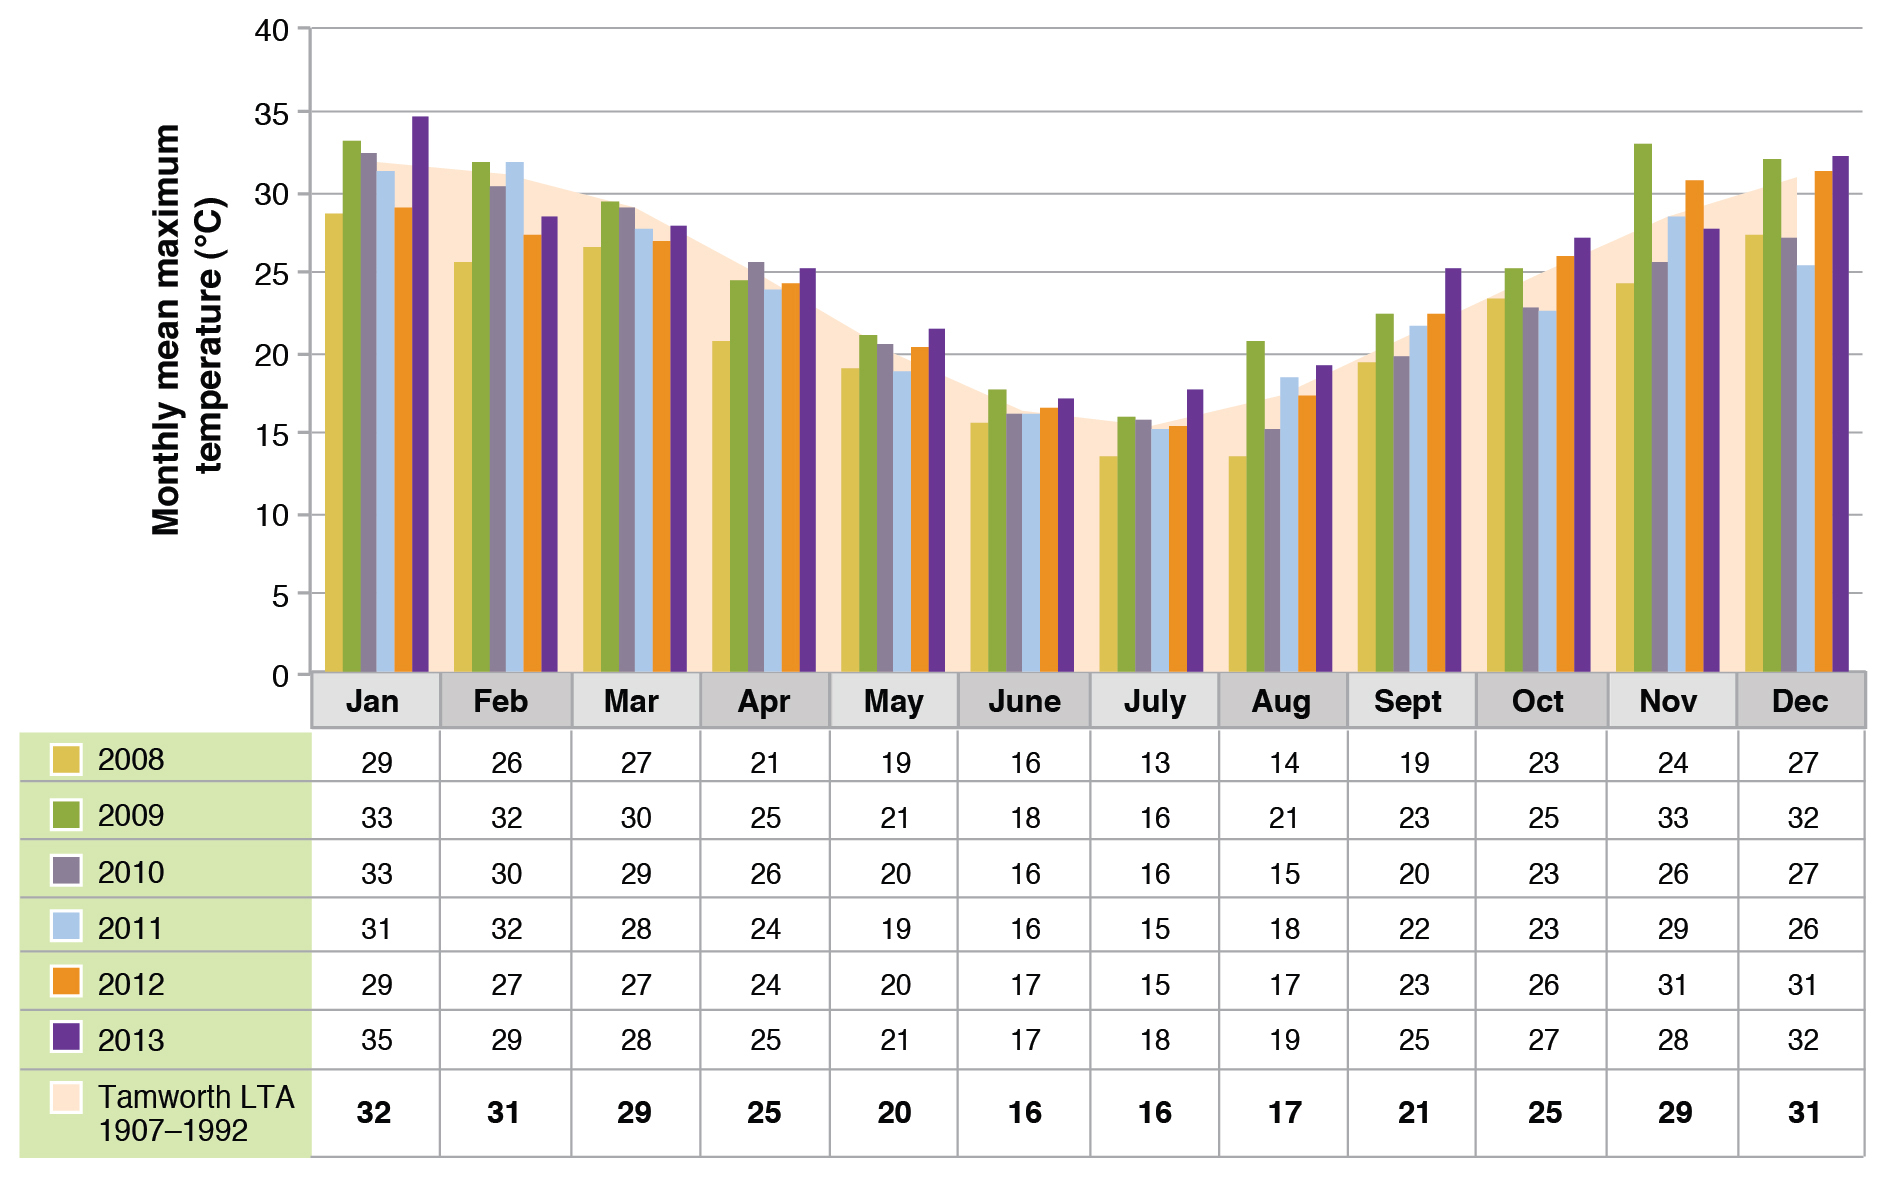
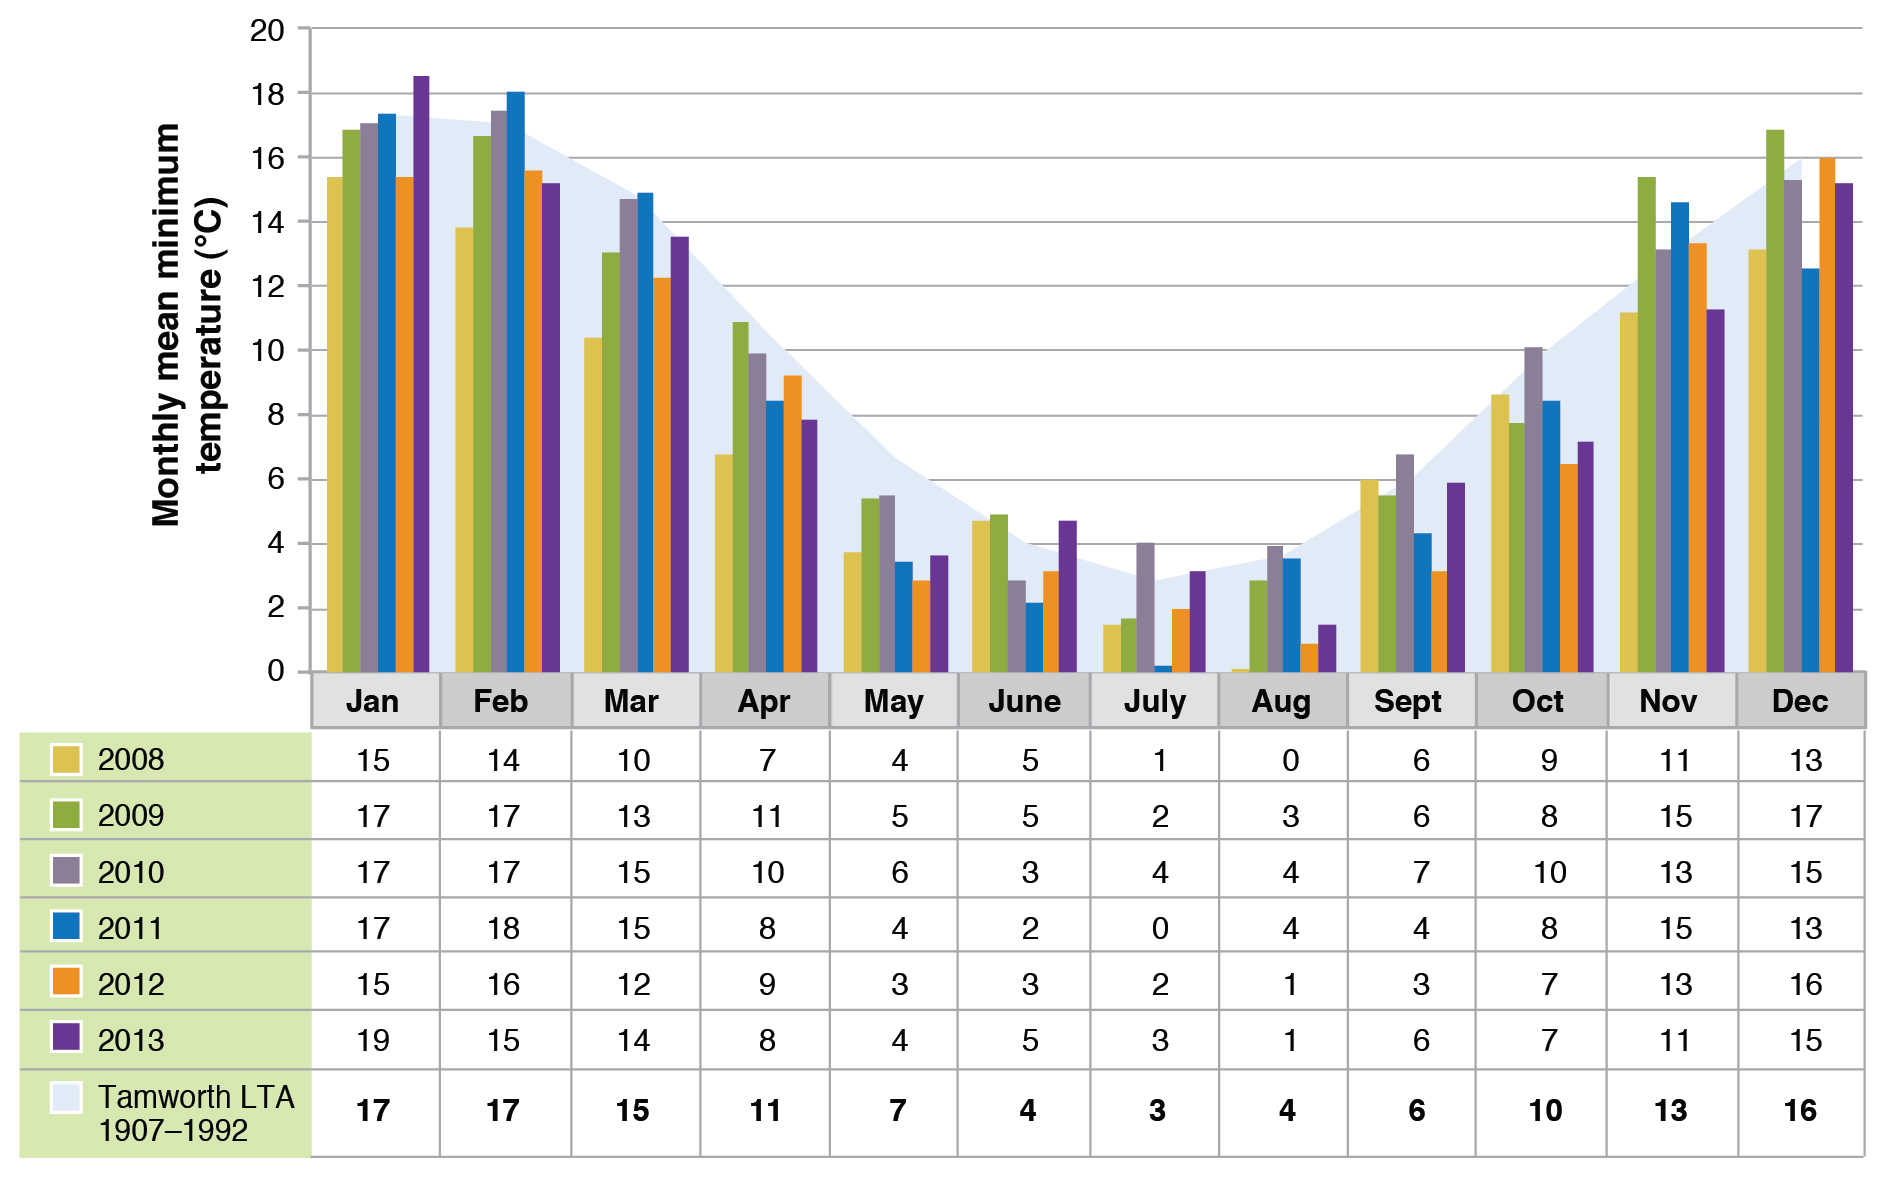
Mean daily maximum and minimum temperatures for each month during the experiment compared with the long term averages for Tamworth are shown in Figures 3 and 4, respectively. Daily maxima tended to be above average in drier seasons (e.g. May to December 2009) and below average in wetter seasons (August to December 2010). Conversely, daily minima tended to be below average in drier seasons and above average in wetter seasons.
|
|
|
|
|
|
|
|