Euroa MLA Producer Demonstration Site – Stocking Rates, Beef Production and Economics
Stocking rates (grazing days)
Records of cattle movements and the resulting dry sheep equivalent (DSE) grazing days (number of days x number of head x DSE rating) were collected at the Euroa Producer Demonstration Site from the beginning of the trial in 2009. At the Longwood site, the control, ryecorn and chicory were included in the monitoring to demonstrate where these species could fill feed gaps in the system. Results are presented in Figures 1 and 2.


Perennial pastures increase carrying capacity
At Longwood, the sown perennials carried on average 22 DSE/ha in 2010 and 22 DSE/ha in 2011, compared to the control which produced 5 DSE/ha and 10 DSE/ha respectively. At Euroa, average stocking rates for the plots were 14 DSE/ha (2010), 19 DSE/ha (2011) and 13 DSE/ha (2012).
High stocking rates on phalaris in autumn and spring
The phalaris at both sites carried very high annual average stocking rates, proving to be particularly productive in autumn and spring. It produced 1638 DSE grazing days/ha in summer 2011 at Longwood and 2932 DSE grazing days/ha at Euroa due to the residual feed available and a response to summer rainfall. At Longwood in 2010, the average stocking rate for phalaris was 27 DSE/ha, compared to an average of 22 DSE/ha.
In 2012 at Longwood, the phalaris provided good grazing over summer, and responded well to the excellent autumn break, providing an abundance of autumn feed. It had the best productivity over autumn (1572 DSE grazing days), almost doubling the grazing days of all the other species.
Fescue helps fill the autumn/winter feed gap
The fescue performed well through autumn and winter, helping to fill the feed gap that occurs during this time. It had quite a bit of summer growth in 2010/12, which was surprising considering this variety is summer dormant, and was grazed in October, November, December and February. The fescue was pasture topped in February and the topping of the plots at Euroa made a significant difference to the quality, palatability and production of it through the spring and summer.
Low stocking rates on the brome
The brome at both sites for every year was the worst performing perennial for annual grazing days. This species was chosen for its ability to provide green feed outside of the growing season, however, it never excelled at this.
In the case of the 2011 summer at both sites, the brome had the lowest stocking rate, with1658 DSE grazing days at Euroa and 378 DSE grazing days at Longwood, compared to the normally summer dormant fescue’s 3216 DSE grazing days and 3216 DSE grazing days respectively. In 2012, the Euroa brome was the worst performing in the autumn, winter and spring, which was very disappointing (Figure 1).
Ryecorn a fast-establishing 2-year clean-up option
Sown in May, the ryecorn was subsequently grazed during the following June and August (Figure 3). It was then harvested for seed and some of this was used to sow a 2010 crop on another part of the farm, which was subsequently cut for silage. The 2009 stubble was grazed before regerminating in autumn 2010. The regerminated crop was grazed three times before the paddock became too wet to graze or cut for silage.
Although the income from grain and grazing in 2009 wasn’t enough to pay for its establishment, the grazing days during winter of the ryecorn’s first year were important to off-set the lost grazing during establishment of perennials. It further added value to the system by providing valuable autumn/winter feed in its second year.
Chicory provided quality summer-autumn feed
In the establishment year, the chicory carried the highest stocking rate (Figure 4). It was first grazed in September 2009 and was subsequently grazed three times before the autumn break in 2010. The excess feed produced over the summer, due to wet conditions, meant that trade steers could utilise the high quantity and quality of feed available. The chicory was then allowed to go to seed prior to slashing in February 2010 to encourage recruitment, which was successful. While this species provided high quality feed for young growing stock and saved on high protein supplements, low fibre levels meant that the cattle could not graze the chicory without adlib access to hay (2kg/hd/day). Persistence of chicory is also uncertain beyond three years.

Beef Production (Kg/beef/ha)
Cattle weight gains were recorded as the stock moved off and on each species. Beef production (kg beef/ha) was calculated as the days on the paddock multiplied by the number of animals multiplied by the weight gains per day. The results for Euroa are presented in Figure 3.
")
It is important to bear in mind that the gains are extremely variable and gut fill is not factored in. Weight variation from paddock to paddock may also be due to the timing of the grazing rather than just the species being grazed. Cattle were grazed in 2010 from autumn to spring, however in 2011 and 2012 they also grazed in summer when pasture growth was good.
Regular monitoring is important for measuring cattle performance
Perhaps more important than a comparison between species, was the value of regular monitoring of cattle weights to understand and respond to variation throughout each season. One example of an action taken in response to the monitoring, was the use of urea in response to a drop in cattle weights at both sites in late May/early June (2011). Cattle were either losing weight or just maintaining weight despite having access to good levels of pasture (Euroa average 1600kg DM/ha, Longwood average 1700kg DM/ha). The Urea was applied in late June/early July across both sites.
When the cattle resumed grazing the plots after the recommended withholding period, their weights increased. If the cattle had not been weighed regularly, the problem may not have been rectified so quickly, proving the importance of regular monitoring.
Green feed over summer 2011 allowed additional gains
In 2011, due to green feed available the cattle at Euroa were able to graze the plots over the summer. The fescue demonstrated the ability to respond to summer rainfall (Figure 2) and the cattle grazed it twice, with the first grazing in early December producing 180kg/ha (1.88kg/day) and the second grazing in early February producing 53kg/ha (0.47kg/day). Overall it was the best performer, and produced high cattle growth rates through winter and spring.
Over the summer of 2011/12 cattle were again able to be grazed at Euroa due to the excess feed; however only their entry weights and exit weights were recorded, not for the individual species.
Highest beef production from fescue and phalaris
The fescue performed very well, with consistent beef production over autumn, winter and spring. The phalaris had high beef production in winter. The drop in winter gains in the first year was associated with removal of hay just before the animals grazed the phalaris, causing significant weight loss for a short period while no roughage was available.
Overall the phalaris and fescue were the stand out performers for 2012, as had high beef production (626 kg beef/ha for phalaris and 698kg beef/ha for fescue) with a fantastic performance over autumn and winter for the phalaris and winter and spring for the fescue.
2012 was an interesting year
2012, was a hard year in terms of performance. Beef production was lower than 2011 despite similar numbers being run. The cattle didn’t enter the plots until late April, when unjoined heifers were grazed until September. From September through to early November, young bulls were grazed. The plots were destocked for 16 days in June (1/6/2012 – 77/6/2012), due to the lack of rain and therefore lack of feed. Issues with pink-eye caused disruptions to grazing through May.
The average weight gain across the species for autumn was higher in 2012 (1.54kg/day) compared to 2011 (0.36kg/day). This supports the overall production (kg beef/ha) results which showed that all the species had a greater production in autumn 2012 (689 kg beef/ha) compared to 2011 (238 kg beef/ha).
The fescue and Yarck cocksfoot produced more kg/beef/ha over the winter, than what was achieved in 2011. The brome was the worst performing species, as it produced a negative result (-76kg/day). During mid to late July, both the Yarck and brome produced negative kg/day, but this became positive once they were grazed again in late August/early September. Once again Urea was used on the Euroa site in mid July, to prevent the loss in beef production that occurred in 2011.
Economics
The average sowing costs of the perennial grasses was $440/ha. The differences between species was due to seed rates and costs, with the brome the most expensive (30 kg/ha at $5.50/kg) and the Uplands the least expensive (5 kg/ha at $8.60/kg). The chicory was the cheapest to sow ($288/ha), while ryecorn ($348/ha) was expensive for an annual crop.

Figure 15: Comparison of Pasture Establishment Costs
Due to the short duration of the Longwood experiment (2009-2011) and the disruptions to grazing resulting from flooding in 2011, the 2010 dataset has been used to provide some insight into the comparative economics between treatments (Table 6). Standard values (from the Farm Monitor project and local data) were used for production costs, with stocking rates and livestock growth rates being the key variables used from the demonstration results. These figures were incorporated into a pasture cost-benefit analysis against the standard control, using the EverGraze Pasture Improvement Calculator.
Table 6. Preliminary cost-benefit analysis for perennials at Longwood
| Control | Phalaris (Longwood) | Chicory* | Ryecorn | |
| Cost of establishment | 0 | 431 | 288 | 348 |
| Kg beef produced at average 0.83 kg/hd/day 2010 | 97 | 448 | 426 | 430 |
| Average stocking rate | 6.5 | 20 | 23 | 11 |
| Income from grain | 550 | |||
| Expected pasture life (years) | 20 | 3-4 | 2 | |
| Gross margin ($/ha) | 146 | 527 | 608 | 430 |
| Return on investment (%) | 33 | 41 | 21 | |
| Net Present Value ($/ha) | 962 | 340 | 45 | |
| Payback period (years) | 6 | 4 | 4 |
*Supplementary feeding for necessary fibre not included in the analysis

Figure 16. Predicted cumulative cash flow for phalaris pasture at Longwood (EverGraze Pasture Improvement Calculator)
Assumptions and definitions
The net present value (NPV) is a measure of the value of all the income generated by the investment over a set period, less the extra costs of the improvements, all discounted to the present. The internal rate of return (IRR) is the discount rate that sets the NPV of the investment to zero – ie the breakeven discount rate for the investment. The breakeven year is the time at which the cash flow for the investment becomes positive.
The key values used in the cost-benefit analysis included additional maintenance fertiliser at (1 kg P/unit DSE and $300 kg/ha single superphosphate), agistment costs during establishment (30c/DSE/week), purchase of additional stock ($50/DSE), opportunity cost of invested capital (12%), expected annual inflation rate (2.5%), marginal tax rate (20%), interest on borrowed funds (8%) and interest on investment funds (5.5%).
Interpretation
Overall, the perennial pasture (Longwood phalaris) used in this example is a profitable investment, provided it survives beyond six years (Figure 15). The chicory had the highest gross margin and the shortest payback period (4 years), but also wasn’t expected to survive for more than 3-4 years. Furthermore, supplementary feeding in this pasture is necessary to provide enough fibre for cattle, and this was not included in the analysis. However, this might be offset by providing out-of-season green feed. The analysis would suggest that ryecorn is not a profitable investment, with expected life two years and payback of four years. However, the value of the ryecorn to provide quick autumn/winter feed, and to clean up a paddock prior to pasture establishment also needs to be considered.
Limitations
The biggest challenge with this analysis was calculating an accurate gross margin and a fair comparison between the control and the plots. The main reason was that the plots were grazed with weaners while the control was grazed with cows and calves. To create an accurate picture, the production data would also need to be considered over the full time-frame of the demonstration. This analysis is currently underway.
Euroa
For the Euroa site, it was possible to develop a gross margin analysis for the years 2010, 2011 and 2012. A summary of the averages compared to the 2009-2011 2-year average Farm Monitor project benchmarking data for cattle enterprises is provided in Table 7. To calculate gross margins, the Victorian Livestock Farm Monitor Project top 20% farms data was used for selling price, animal health (adjusted to $/DSE), contract services ($/ha), freight (adjusted for $/kg sold), repairs and maintenance ($/ha), and other ($/ha). Actual figures from the demonstration were used for beef sold (kg lwt/ha), stocking rate (DSE/ha), supplementary feeding costs ($/DSE), pasture costs ($/ha) and rainfall. The brome has been excluded from the average as it did not persist.
The beef sold was calculated from the weight gain (or loss) on each plot multiplied by the grazing days. Compared to the top 20% of farmers in the region, the average kg beef sold/ha across plots was higher than the average Farm Monitor farm, and close to the top 20% for the tall fescue. As the stock were not grazing all plots simultaneously, it is difficult to form conclusions about the relative beef production between plots. Therefore, for the gross margin analysis, a weighted average for beef production based on stocking rate was applied across the plots.
The average gross margin ($/ha 2010-2012) was $801/ha compared to $364/ha for the average Monitor Project farm and $888/ha for the top 20%. Gross margins for the tall fescue and phalaris exceeded the top 20%. Per 100mm rainfall, the average gross margin was higher than the top 20% of producers in the Monitor Farm Project.
Table 7. Gross margin analysis for Euroa Demonstration Site 2010-2012 compared to Victorian Livestock Farm Monitor Project benchmark averages for 2009-2011.
| Phalaris 2010-2012 | Yarck2010-2012 | Fescue2010-2012 | Uplands2010-2012 | Plot average | 2009-11 2-yr Avge FMP | 2009-11 2-Yr Top 20% | |
| Selling price ($/hd) | 2.04 | 2.04 | 2.04 | 2.04 | 2.04 | 1.74 | 2.04 |
| Beef Sold (kg lwt/ha) weighted average based on stocking rate | 539 | 514 | 591 | 282 | 481 | 337 | 647 |
| Stocking Rate (DSE/ha) | 21 | 20 | 23 | 11 | 19 | 11 | 15 |
| Animal Health ($/ha) | 23 | 22 | 25 | 12 | 18 | 11 | 18 |
| Contract Services ($/ha) | 3 | 3 | 3 | 3 | 3 | 1 | 3 |
| Supp Feed & Agistment ($/ha) | 19 | 19 | 21 | 10 | 17 | 24 | 52 |
| Pasture ($/ha) 100 kg MAP | 60 | 60 | 60 | 60 | 60 | 38 | 68 |
| Freight/ Cartage ($/ha) | 32 | 31 | 35 | 17 | 29 | 16 | 40 |
| Selling Costs ($/ha) | 40 | 33 | 53 | 25 | 43 | 33 | 56 |
| Other ($/ha) | 8 | 8 | 8 | 8 | 8 | 6 | 8 |
| Total Ent. Costs ($/ha) | 194 | 189 | 205 | 135 | 181 | 135 | 245 |
| Gross Margin ($/ha) | 906 | 859 | 999 | 441 | 801 | 364 | 888 |
| Gross Margin ($/DSE) | 43 | 43 | 43 | 40 | 42 | 31 | 60 |
| Gross margin ($/DSE/100 mm rainfall) | 132 | 125 | 146 | 64 | 117 | 47 | 107 |
Investment analysis
Similar to the analysis conducted for the Longwood site, an investment analysis was conducted for the Euroa site based on the gross margin analysis and average stocking rates achieved over the three years of the demonstration. As there was no control at Euroa, the average Farm Monitor stocking rate (11 DSE/ha) and gross margin ($31/DSE) were used as the base case, and were compared to averages achieved for the plots (19 DSE/ha and $42/DSE). Two scenarios were run for the life of the pasture – 10 and 15. Assumptions are presented in Table 8 and results are presented in Table 9 and Figure 16.
The investment analysis indicates that investment in perennials is viable providing they last for longer than six years, and that a stocking rate of 14 DSE/ha is achieved for a 15 year pasture life and 12 DSE/ha for a 20 year pasture life. Gross margin needs to remain above $32/DSE for a 15 year and $28/ha for a 10 year pasture life for the investment to be worthwhile. These figures assume that the average achieved in the Farm Monitor farms is equivalent to an unimproved or annual-based pasture.
Table 8. Assumptions used in Euroa investment analysis
| Assumption | Value |
| Cost of establishment | $440 |
| Stocking rate before improvement | 11 |
| Stocking rate after improvement | 19 |
| Chance of pasture failure | 5% |
| Stocking rate at the end of the pasture life | 13 |
| Number of weeks pasture was grazed (at new stocking rate) in the year of establishment | 30 |
| Agistment cost (during establishment $/week) | $2 |
| Gross margin before improvement ($/DSE) | $31 |
| Gross margin at peak stocking rate ($/DSE) | $42 |
| Capital cost of livestock ($/DSE) | $70 |
| Opportunity cost of invested capital | 12% |
| Expected annual inflation rate | 2.5% |
| Marginal tax rate | 20% |
| Interest on borrowed funds | 8% |
| Interest on investment funds | 5.5% |
Table 9. Results of Euroa investment analysis
| 10 years | 15 years | |
| Net present value | $515 | $1,059 |
| Internal rate of return | 26.4% | 31.2% |
| Breakeven year | 6 | 6 |
| Break even stocking rate | 14.4 | 12.5 |
| Break even gross margin ($/DSE/ha) | 32.00 | 28.88 |
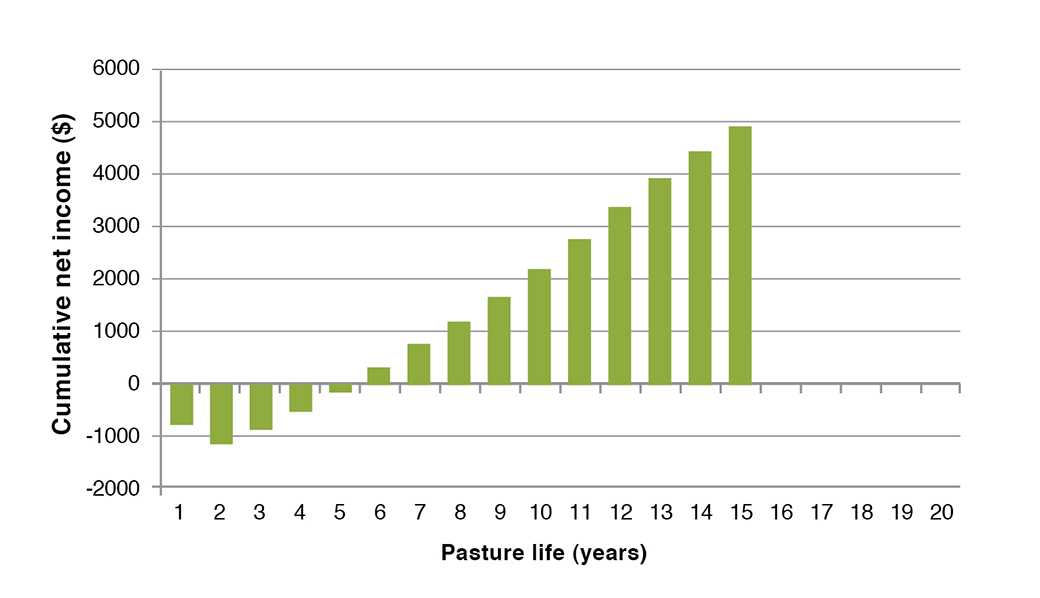
Figure 16. Predicted cumulative cash flow for phalaris pasture at Euroa. (EverGraze Pasture Improvement Calculator)
[/expand]
Acknowledgements
Thanks to the site hosts Andrew and Caroline Walta and John and Mary Kelly for hosting the sites, managing the cattle movements, recording weights, rainfall, grazing data and above all their commitment and passion to this project. Thanks also to the members of the Euroa Grazing Group – the project would not have been such a success without the drive and enthusiasm of the group.
This project was funded by Meat and Livestock Australia (MLA) and the Agriculture Victoria as part of the MLA Producer Demonstration Site initiative. Significant linkages were made between BESTWOOL-BESTLAMB and EverGraze project to boost extension for the demonstration. Smyth Seeds and Stephens Pasture Seeds provided seed for the trial sites.
https://www.evergraze.com.au/library-content/euroa-mla-producer-demonstration-site-stocking-rates-beef-production-and-economics/
Further Information
- Full report – Euroa Producer Demonstration Site
- Case study – Flexible approach fills the gap
- Case study – Perennials increasing productivity
- The place, purpose and management of perennials – Euroa Producer Demonstration Site, Grasslands Society Conference Proceedings 2011
- A simple guide to pasture establishment
- EverGraze Action – Growing and using Chicory on the East Coast
- EverGraze Action – Grazing Phalaris for production and persistence
- EverGraze Action – Growing and using winter active tall fescue in southern Australia
- Primefact – Cocksfoot
