The effect of grazing intensity on production and profit from native pastures at Orange EverGraze Proof Site
Individual animal performance is greater for low intensity grazing systems (1-Paddock) than higher intensity grazing systems ( 4-Paddock and 20-Paddock), but higher stocking rates can be run with increased intensity, due to greater feed on offer (FOO) giving greater production per hectare. When lambs can be retained for longer after weaning (estimated in 62% of years at Panuara), gross margins are higher in a 20-Paddock system. Where substantial investment in infrastructure is required for implementation, return on investment is marginal.
Main findings
Higher feed on offer and stocking rates with increased grazing intensity
- At the Orange EverGraze Proof Site located at Panuara in the Central Tablelands of NSW, the average green feed on offer (FOO) in a 20-Paddock rotational grazing system was often higher than a lower intensity 4-Paddock rotation, and a 1-Paddock set stocked system.
- Stocking rate was the same for all systems when the experiment began in 2008. On average, stocking rate increased with grazing intensity in response to higher FOO between 2009 and 2011 (average 1-Paddock = 6.0 DSE/ha, 4-Paddock = 6.5 DSE/ha, 20-Paddock = 7.8 DSE/ha).
Higher pasture quality and individual animal performance with lower grazing intensity
- Dietary quality, measured by organic matter digestibility (OMD), was higher for ewes grazing the 1-Paddock compared to 4-Paddock and 20-Paddock systems. This resulted in higher average weaning weight of lambs in the 1-Paddock system (33.3 kg) compared to the 4-Paddock (31.1 kg) and 20-Paddock (29.8 kg) systems.
- Ewe condition score was often higher in the 1-Paddock than the 4-Paddock and 20-Paddock systems. The condition score was substantially higher from spring 2009, but differences were still evident when stocking rates were the same in 2008. On average the 1-Paddock had a higher condition score than the Lifetimewool targets while the 4-Paddock and 20-Paddock were lower. For all treatments, condition scores were on average greater than the Lifetimewool targets.
- In the paddock being grazed in the 20-Paddock system, animals were removed when the pasture was grazed to the same green FOO as the 1-Paddock system. The lower animal production in the 20-Paddock system did not appear to be due to limitations in pasture availability.
- There were little difference in wool traits between grazing systems, although by 2012 the 20-Paddock had a finer fibre diameter than the 1-Paddock and 4-Paddock systems.
Higher production per hectare with increased grazing intensity
- Average sale weight of lambs per ha (kg lamb/ha) increased with increasing grazing intensity (average 1-Paddock = 173.4 kg, 4-Paddock = 180.8 kg, 20-Paddock = 207.2 kg). Lamb sale weight was higher because of higher stocking rates from 2009 and because lambs were retained for longer after weaning in 2008.
Higher margins and reduced variability with increased grazing intensity
- For the experimental period the 20-Paddock on average had higher gross margin per ha than the 1-Paddock and 4-Paddock systems. It’s greatest advantage was when lamb prices were high; it was running a higher stocking rate than the 1-Paddock and 4-Paddock systems; and lambs were retained after weaning and grown to a greater weight.
- Modelling demonstrated that over a 40-year period lambs could be retained after weaning in 62% of years. This was of greatest benefit to the 20-Paddock system as it enabled lambs to be sold at similar weights to the 1-Paddock system. Early weaning, which occurred in the experiment in 2009 across all treatments, was required in 18% of years.
- Increases in stocking rate in response to higher FOO were essential for the long-term profitability of a 20-Paddock grazing system. Without an increase in stocking rate there was no difference in the long-term profitability between systems. However, at the same stocking rate, there was less variability in the gross margin of the 20-Paddock system compared to the 1-Paddock system.
Return depends on infrastructure requirements
- Investment in fencing and water infrastructure and additional livestock may be needed when moving from continuous grazing to intensive rotational grazing with an increased stocking rate. If significant investment is needed (i.e. subdividing 4 paddocks into 20) then this investment may not be viable. At lower investment requirements (i.e. subdividing 10 paddocks into 20 or simply mobbing up and using existing paddocks), the investment is viable.
Read more about this research
Is increasing grazing intensity profitable?
[expand title=” ” swaptitle=” ” tag=”h4″ elwraptag=”div” elwrapclass=”expend-collapse-wrapper”]
In the high rainfall zone of southern Australia, fencing to land class and more intensive rotational grazing (with a larger number of paddocks) has been adopted by many producers with objectives such as improving pasture composition, ground cover, pasture utilisation, fertiliser use efficiency, stocking rates and profitability. The shift to an intensive rotational grazing system is often associated with changes to livestock enterprises, phosphorus fertiliser application and stocking rate, making it difficult to determine the direct benefit from grazing management.
Previous research in Victoria at Hamilton on perennial ryegrass (Waller), Broadford on hill country phalaris (Warn), and Balmoral on phalaris (Chapman) have shown mixed results against these objectives depending on the grazing system setup, the livestock enterprise and the feedbase. A discussion of the results across experiments is provided by Saul, 2011. In general, compared to set stocking, rotational grazing resulted in higher pasture growth and utilisation, and a 10-20% increase in stocking rate. Rotational grazing favoured perennial grasses over clovers and broadleaf weeds, and this, combined with reduced selective grazing, resulted in an approximate 5% reduction in individual animal performance in the ewe/lamb systems at Balmoral and Hamilton. For wethers at Broadford, there was no effect of grazing system on per head wool production, although wethers were significantly lighter in the intensive rotational grazing system at the end of each spring, but with no difference in annual average weight. More importantly at Broadford, grazing system had a significant effect on ground cover and the persistence of phalaris which declined significantly under set stocking. Improved pasture utilisation at Broadford also improved the distribution of soil phosphorus, potassium, sulphur and nitrogen, reducing maintenance fertiliser costs in the intensive rotation. Despite the slightly lower individual animal performance with rotational grazing in all experiments, higher stocking rates resulted in higher overall production per hectare. Where an economic analysis was conducted at Broadford, this resulted in higher gross margins (on average $75/ha).
Research at the Orange EverGraze Proof Site aimed to build on the above findings to determine the effect of increasing the grazing intensity on native pastures in a highly variable landscape. Due to the variability in pasture composition, it was anticipated that a high degree of selective grazing would occur in the low intensity, 1-Paddock system, compared to more intensive 4-Paddock and 20-Paddock systems, and that this would influence both livestock production and composition of the native pastures. Related research message pages for the Orange Proof Site describe the benefits of mapping the variable landscape to production zone; and the unexpected lack of difference in pasture composition between the high and low intensity grazing systems (during the experiment period). This latter result was attributed to the ground cover and herbage mass benchmarks and flexible stocking rates used for all treatments; as well as over-riding seasonal effects during the three years of the experiment. This page completes the story, describing the effect of grazing system on lamb and wool production at the Orange Proof Site, and the resulting profitability. Modelling is used to determine effects over a 40-year period with variable climatic conditions, and an investment analysis considers the potential return on capital if fencing and infrastructure is required for implementation.
[/expand]
What was done?
[expand title=” ” swaptitle=” ” tag=”h4″ elwraptag=”div” elwrapclass=”expend-collapse-wrapper”]
A full description of the Orange Proof Site is provided under What was done. A summary of the grazing treatments and relevant livestock measurements are provided below.
[/expand]
Grazing systems
[expand title=” ” swaptitle=” ” tag=”h4″ elwraptag=”div” elwrapclass=”expend-collapse-wrapper”]
Three systems were grazed with Merino (Centre-plus) ewes which were joined to White Suffolk rams at the beginning of April to lamb in September. Sheep were either removed and placed in containment areas, or stocking rates were reduced, when the benchmark targets of 80% ground cover and herbage mass of 800 kg DM/ha levels were reached. The grazing systems were as follows:
1-Paddock – animals grazed the entire plot continuously, until benchmark targets were reached.
4-Paddock – sheep were moved between four equally sized paddocks. The time left in each paddock was based on the available feed in relation to the animal requirements and the stage of pasture growth. When animal requirements were higher (e.g. lambing and lactation), animals were moved sooner (i.e. pastures were not grazed as heavily). This normally coincided with high pasture growth rates in spring. Sheep were moved into the most suitable paddock determined by feed on offer, rather than following a set paddock order.
20-Paddock – sheep were moved between 20 paddocks. As with the 4-Paddock system, movements were based on available feed in relation to the animal requirements, pasture growth rate and stage of plant growth. More productive paddocks were grazed for longer or more frequently. The grazing period generally ranged from one to seven days, averaging four days and with rest periods from 30 to 140 days, averaging 70 days. Paddocks were rotated more quickly when pasture was actively growing in spring, which coincided with higher animal requirements. Paddocks were generally grazed in the same order, but were sometimes omitted or grazed out-of-order if there was insufficient pasture quality and feed on offer for the animal requirements, to avoid seed contamination of lambs, or to maintain ground cover on ridgelines.
[/expand]
Livestock and pasture measurements
[expand title=” ” swaptitle=” ” tag=”h4″ elwraptag=”div” elwrapclass=”expend-collapse-wrapper”]
Ewes and lambs (when present on plots) were weighed and condition scored at 4 – 6 weekly intervals. After pregnancy scanning, ewes were adjusted to have the same potential number of lambs per ewe in each plot, generally between reps within the same treatment.
At shearing, fleeces were weighed (including bellies) and mid-side samples collected to determine fibre diameter and yield. The total staple length, staple strength and position of break from each mid-side sample collected were measured with an automatic tester of length and strength (ATLAS).
Green food on offer (FOO) was visually assessed (and calibrated using cuts) at four to six week intervals using BOTANAL techniques in 60 quadrats (0.1 m2) at fixed locations within each plot. Pasture was also assessed pre and post grazing in six of the 20 paddocks in the 20-Paddock.
Diet quality was assessed by collecting five fresh faecal samples per plot on five separate occasions from November 2009 to June 2010. Faecal samples were analysed for nitrogen (to determine crude protein) and ash (to determine organic matter) contents, and this was converted to organic matter digestibility using an equation derived by Wang et al (2009).
[/expand]
What was found?
Higher herbage mass and stocking rates with increased grazing intensity
[expand title=” ” swaptitle=” ” tag=”h4″ elwraptag=”div” elwrapclass=”expend-collapse-wrapper”]
Across the entire grazing system, green FOO was often higher in the 20-Paddock than the 1-Paddock and 4-Paddock systems (Figure 1). Ewe numbers were held constant for the first year of the experiment at 5.4 ewes per ha, although, on average the lambs were retained on the 20-Paddock system for longer (Table 1). In 2009, there was no significant difference in stocking rate, despite ewe numbers being reduced in the 1-Paddock and 4-Paddock systems. In 2010 and 2011, higher FOO in the 20-Paddock system meant stocking rates could be pushed to higher levels than the 1-Paddock and 4-Paddock systems. Compared to the 1-Paddock system, average stocking rates were 10% and 20% higher than the 1-Paddock system. In 2011, stocking rates were 50% higher in the 20-Paddock compared to the 1-Paddock system.
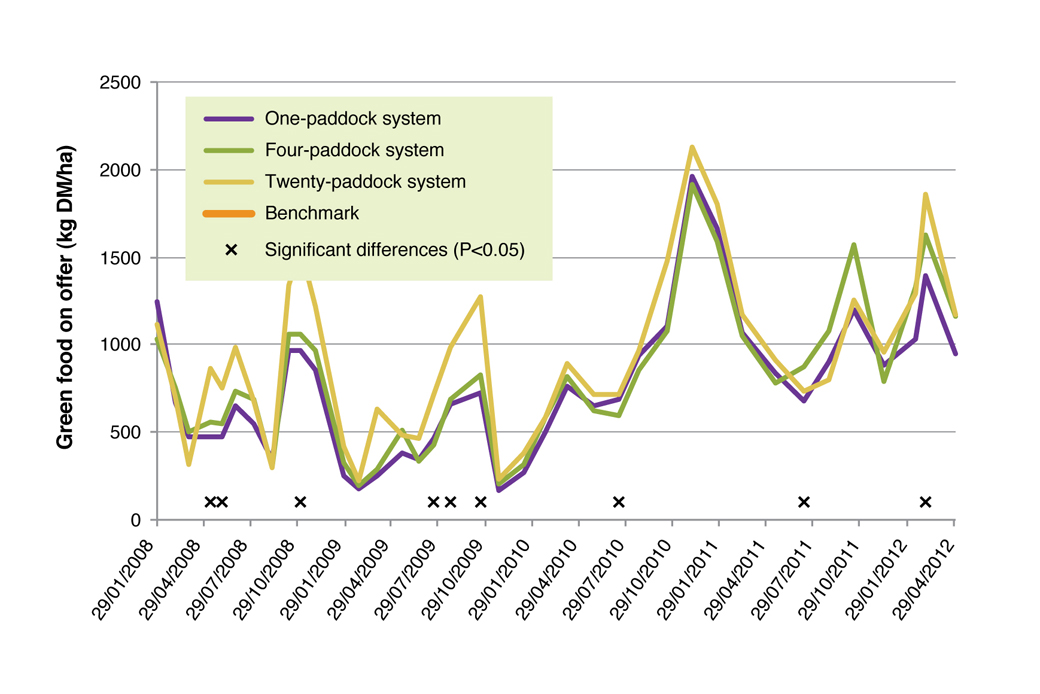
Table 1 Average stocking rate (DSE/ha) between grazing systems
| Production year | 1-Paddock | 4-Paddock | 20-Paddock | sig | *l.s.d. |
| ^2008 | 9.0 | 9.4 | 9.5 | ns | |
| 2009 | 5.1 | 5.5 | 6.6 | ns | |
| 2010 | 5.2 | 6.4 | 7.7 | P <0.01 | 0.970 |
| 2011 | 7.6 | 8.0 | 9.5 | P <0.01 | 0.891 |
| ^Average | 6.0 | 6.5 | 7.8 |
*The least significant difference indicates the minimum difference between results to be considered significant with 95% confidence.
^Stocking rate was set to be the same across all treatments in 2008 and therefore 2008 figures have been excluded from the average.
[/expand]
Higher quality diet with lower grazing intensity
[expand title=” ” swaptitle=” ” tag=”h4″ elwraptag=”div” elwrapclass=”expend-collapse-wrapper”]
Ewes grazing the 1-Paddock system had on average 3% higher dietary organic matter digestibility (OMD) than the 4-Paddock and 20-Paddock systems (Table 2). The measurement showed a change in diet quality with time of year, with highest levels in February 2010 after a period of good rainfall and lowest levels in June 2010. This difference represents ~25 g/day difference in ewe weight gain or loss for the range of OMD and green FOO measured (results from GrazFeed™). Since there was no significant difference in pasture composition between grazing treatments, differences in feed quality intake are likely to be a result of selective grazing. See Variable landscapes can be mapped and managed to production zone for details of grazing patterns in the different treatments.
Table 2. Average OMD (g / g DM) for 1-Paddock, 4-Paddock and 20-Paddock treatments from November 2009 to June 2010. Significant differences (P <0.05) denoted with a subscript letter. There was no significant interaction between time and system.
| Date | 20-Paddock | 4-Paddock | 1-Paddock | Average for time |
| 13/11/09 | 0.541 | 0.552 | 0.548 | 0.547ab |
| 14/01/10 | 0.567 | 0.567 | 0.584 | 0.573bc |
| 18/02/10 | 0.589 | 0.599 | 0.611 | 0.599c |
| 26/03/10 | 0.569 | 0.555 | 0.581 | 0.568b |
| 24/06/10 | 0.529 | 0.516 | 0.559 | 0.535a |
| Average for system | 0.559a | 0.558a | 0.576b |
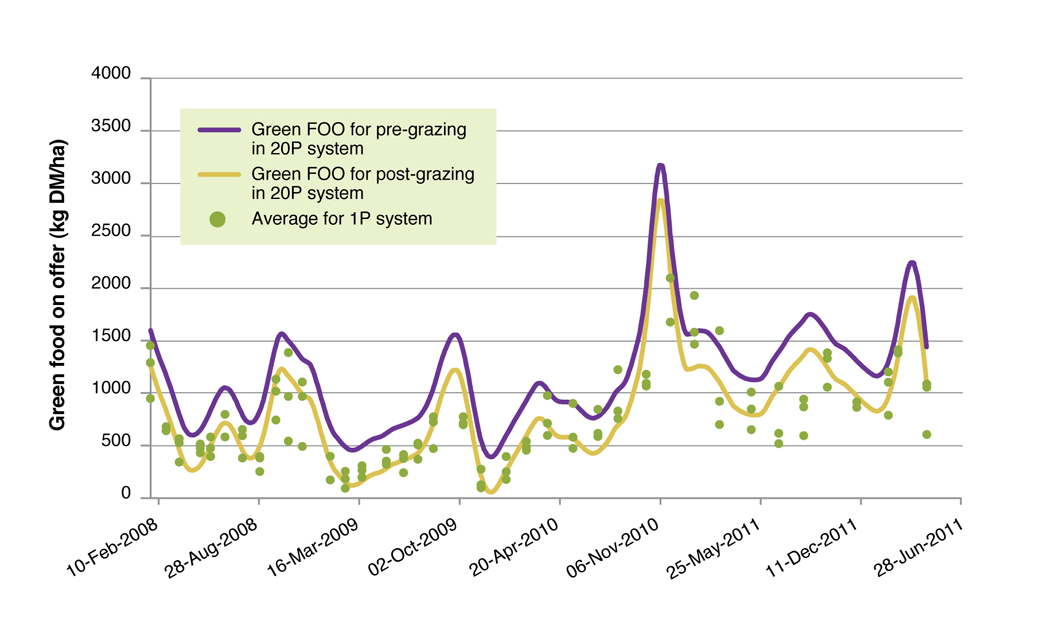
As the 20-Paddock system is divided into 20 separate paddocks, it is only the paddock that the animals are grazing that is important for animal production. When the green FOO of the pasture pre and post grazing in the 20-Paddock system were compared to the average of the 1-Paddock system the post grazing green FOO was similar to the average of the 1-Paddock system (Figure 2). Therefore, it is likely that differences in individual animal production between grazing systems were a result of diet quality, rather than FOO.
Higher ewe condition at lower grazing intensity
[expand title=” ” swaptitle=” ” tag=”h4″ elwraptag=”div” elwrapclass=”expend-collapse-wrapper”]
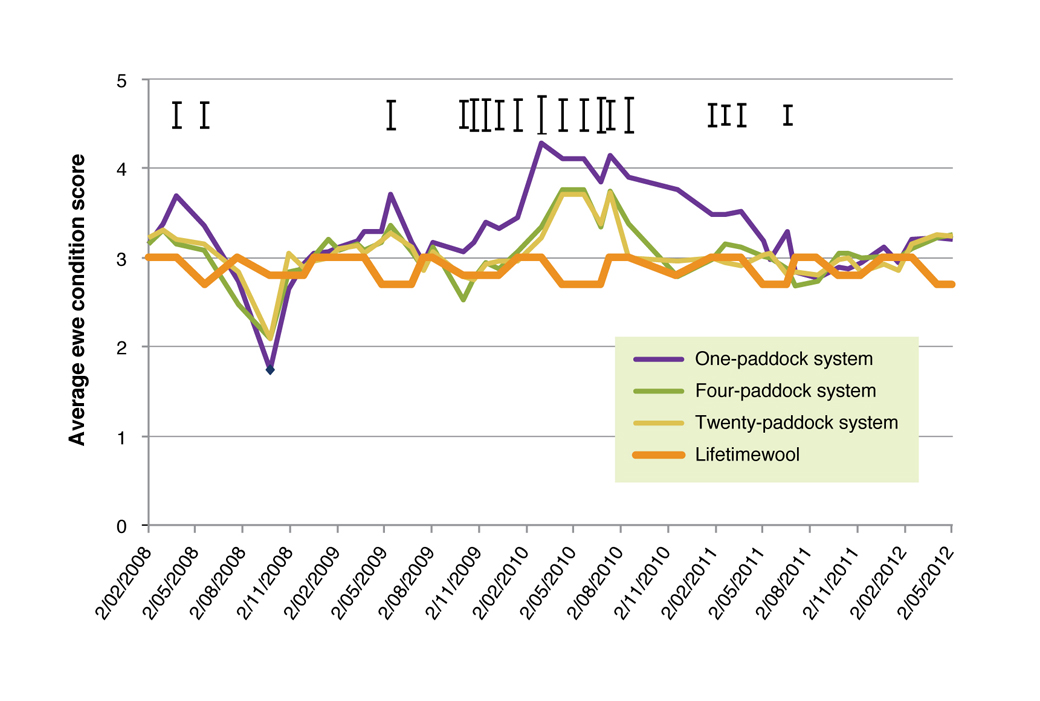
The ewe condition score was consistently higher in the 1-Paddock system compared to the 20-Paddock and 4-Paddock systems, particularly from spring 2009 to spring 2011 (Figure 3). The condition score was compared to the Lifetimewool targets. The 1-Paddock on average was 0.39 higher than the target, while the 4-Paddock and 20-Paddock were 0.19 and 0.18 above the target, respectively. The difference was greater at joining with the 1-Paddock on average 0.7 higher than the target and the 4-Paddock and 20-Paddock being 0.2 and 0.1 higher than the target, respectively. A higher condition score than the target in autumn is desired for native pastures to allow animals to slip in condition through winter, when pasture quality is poor, but still be at adequate levels for lambing in September. The condition score differences were also evident in autumn and early winter in 2008 when ewes were dry and before stocking rates were adjusted between systems. There was little difference in stocking rate between the 1-Paddock and 4-Paddock system, yet the 4-Paddock system generally had the same condition score as the 20-Paddock system. This indicates that grazing management, more so than the higher stocking rate, caused the lower ewe condition score in the 20-Paddock and 4-Paddock systems.
No difference in wool production between grazing treatments
[expand title=” ” swaptitle=” ” tag=”h4″ elwraptag=”div” elwrapclass=”expend-collapse-wrapper”]
There was little difference in wool production between grazing systems in any year, although fibre diameter was lower in the 20-Paddock system than the 1-Paddock system in the 2011 production year (Table 3). Staple length was longer in the 4-Paddock than the 1-Paddock in 2010. Yield was higher in the 20-Paddock than the 4-Paddock in 2009. There was no difference in individual greasy fleece weight (GFW) between any of the systems.
Table 3 Wool traits for different the 1-Paddock, 4-Paddock and 20-Paddock grazing systems.
| Measurement | Year | 1-Paddock | 4-Paddock | 20-Paddock | P-value | l.s.d. |
| Fibre diameter | 2008 | 18.2 | 18.0 | 17.8 | ns | |
| 2009 | 19.0 | 18.3 | 18.6 | ns | ||
| 2010 | 19.0 | 18.6 | 18.3 | ns | ||
| 2011 | 18.6 | 18.4 | 17.8 | 0.046 | 0.698 | |
| Staple length | 2008 | 103.0 | 102.3 | 99.7 | ns | |
| 2009 | 107.9 | 109.6 | 105.9 | ns | ||
| 2010 | 91.1 | 98.9 | 94.4 | 0.045 | 5.74 | |
| 2011 | 99.6 | 97.4 | 96.8 | ns | ||
| Yield | 2008 | 72.6 | 73.5 | 74.4 | ns | |
| 2009 | 70.0 | 68.5 | 72.4 | 0.037 | 3.08 | |
| 2010 | 73.2 | 73.1 | 75.9 | ns | ||
| 2011 | 75.4 | 73.1 | 75.5 | ns | ||
| GFW | 2008 | 4.6 | 4.6 | 4.5 | ns | |
| 2009 | 5.7 | 5.0 | 5.1 | ns | ||
| 2010 | 4.3 | 4.4 | 3.9 | ns | ||
| 2011 | 4.2 | 4.4 | 4.1 | ns |
Higher per hectare production but lower per head production with increased grazing intensity
[expand title=” ” swaptitle=” ” tag=”h4″ elwraptag=”div” elwrapclass=”expend-collapse-wrapper”]
In 2008, there was no significant difference in lamb numbers between treatments at weaning (Table 4). Lamb weights were greater at weaning in the 1-Paddock compared with 4-Paddock system. Individual lamb weight and lamb weight per hectare at sale decreased from 20-Paddock to 1-Paddock and from 1-Paddock to 4-Paddock, because lambs were retained on the 20-Paddock for longer than the 1-Paddock and 4-Paddock due greater available FOO.
In 2009, lambs were sold at weaning and there was no significant difference in lamb number, weight at weaning, and lamb weight/ha.
In 2010, the 20-Paddock system weaned more lambs per ha than the 1-Paddock. Weaning weight was decreased from 1-Paddock to 4-Paddock and from 4-Paddock to 20-Paddock, but sale weight was not significantly different as sale time was staggered as animals reached the target weight of 42 kg live weight. Average lamb sale weight per ha increased from the 1-Paddock to 4-Paddock and from 4-Paddock to 20-Paddock.
In 2011, lambs were sold at weaning and average per head weaning weight was higher in the 1-Paddock and 4-Paddock than the 20-Paddock. Average sale weight of lambs per ha (kg lamb/ha) was higher in the 20-Paddock, but not significantly.
Over all years, average weaning weight of lambs decreased with increasing intensity of grazing system (1-Paddock = 33.3, 4-Paddock = 31.1, 20-Paddock = 29.8), but average lamb sale weight per ha (kg lamb/ha) increased with increasing grazing intensity (1-Paddock = 173.4, 4-Paddock = 180.8, 20-Paddock = 207.2). Lamb sale weight per ha in the 20-Paddock system was higher because of higher stocking rates from 2009 and because lambs were retained for longer after weaning in 2008.
Table 4. Lamb production data for three years from one, four and 20 grazing systems (1-Paddock, 4-Paddock and 20-Paddock). The P value and least significant difference (l.s.d.) for significant treatments are presented.
| Year | Measurement | 1-Paddock | 4-Paddock | 20-Paddock | P-value | l.s.d. |
| 2008 | Lambs weaned/ha | 5.6 | 6.3 | 5.4 | ns | |
| Av. weaning wt. | 34.1 | 30.1 | 32.8 | P <0.05 | 2.8 | |
| Av. sale wt. | 37.2 | 35.5 | 39.7 | P <0.01 | 1.2 | |
| Lamb sale wt/ha | 209 | 199.5 | 223.2 | P <0.01 | 6.81 | |
| 2009 | Lambs weaned/ha | 5.6 | 5.6 | 7.1 | ns | |
| Av. weaning wt. | 31.1 | 28.6 | 26.7 | ns | ||
| Av. sale wt. | 31.1 | 28.6 | 26.7 | ns | ||
| Lamb sale wt/ha | 175.8 | 161.4 | 187.5 | ns | ||
| 2010 | Lambs weaned/ha | 3.9 | 5.0 | 5.6 | P <0.05 | 1.3 |
| Av. weaning wt. | 35.9 | 33.1 | 30.3 | P <0.01 | 2.1 | |
| Av. sale wt. | 39.2 | 38.2 | 36.4 | ns | ||
| Lamb sale wt/ha | 149.4 | 189.2 | 218.4 | P <0.01 | 24.49 | |
| 2011 | Lambs weaned/ha | 5.0 | 5.3 | 7.0 | ns | |
| Av. weaning wt. | 32.2 | 32.5 | 29.5 | <0.001 | 1.8 | |
| Av. sale wt. | 32.2 | 32.5 | 29.5 | <0.001 | 1.8 | |
| Lamb sale wt/ha | 159.6 | 173.1 | 199.8 | ns |
Crunching the numbers
[expand title=” ” swaptitle=” ” tag=”h4″ elwraptag=”div” elwrapclass=”expend-collapse-wrapper”]
A three-part economic analysis was conducted to understand the potential return from implementing more intensive grazing systems. These included a gross margin comparison of site results; a gross margin comparison over 40 years using GrassGro modelling; and return on funds invested for required infrastructure under a range of scenarios. The results are discussed below.
[/expand]
Gross margins for the trial
[expand title=” ” swaptitle=” ” tag=”h4″ elwraptag=”div” elwrapclass=”expend-collapse-wrapper”]
Gross margins were prepared for each grazing system using costs and prices (excluding lamb price) from NSW DPI budgets in the production year. Store lamb prices were calculated using average prices from a weight and condition score grid. The full cost of feeding sheep when off plots was included in the gross margins. Average number of lambs per ewe was used to remove variability in lamb survival between treatments.
On average there was a higher gross margin per hectare in the 20-Paddock system than the 1-Paddock and 4-Paddock (Table 5). This was mainly due to a large difference between systems in 2010 when lamb price was high, there was a larger difference in stocking rates between the 20-Paddock and the other systems and lambs were retained after weaning and grown to a greater weight. There was no difference between system in gross margin per ewe or DSE (Table 6 and Table 7).
Table 5. Average gross margin per ha of each system. Significant differences (P <0.05) denoted with a subscript letter.
| Year | 1-Paddock | 4-Paddock | 20-Paddock | Average |
| 2008 | 360b | 373bd | 378bd | 366b |
| 2009 | 219a | 210a | 230a | 214a |
| 2010 | 434d | 437d | 642e | 436c |
| 2011 | 321b | 342b | 367bd | 331b |
| Average | 333a | 340a | 404b |
Table 6. Average gross margin per ewe of each system. Significant differences (P <0.05) denoted with a subscript letter, where there are no letters there was no significant differences.
| Year | 1-Paddock | 4-Paddock | 20-Paddock | Average |
| 2008 | 67 | 69 | 70 | 68b |
| 2009 | 51 | 43 | 41 | 47a |
| 2010 | 136 | 131 | 137 | 134c |
| 2011 | 68 | 70 | 64 | 69b |
| Average | 80 | 78 | 78 |
Table 7. Average gross margin per DSE of each system. Significant differences (P <0.05) denoted with a subscript letter, where there are no letters there was no significant difference.
| Year | 1-Paddock | 4-Paddock | 20-Paddock | Average |
| 2008 | 37 | 38 | 38 | 37ab |
| 2009 | 35 | 31 | 27 | 33a |
| 2010 | 81 | 69 | 84 | 75c |
| 2011 | 42 | 43 | 38 | 42b |
| Average | 49 | 45 | 47 |
Gross margin over 40 years
[expand title=” ” swaptitle=” ” tag=”h4″ elwraptag=”div” elwrapclass=”expend-collapse-wrapper”]
In the second stage of analysis the GrassGro® pasture model was calibrated with grazing systems data from the experiment. Factors like sale time, lamb growth and ewe weight were accurately predicted by the model for the 1-Paddock system. The model was run for each system over a 40 year period from 1972 to 2011. The 1-Paddock, 4-Paddock and 20-Paddock systems were run at the average stocking rate of the 1-Paddock system, which was 4.3 ewes per ha. The 20-Paddock system was also run at 5.3 ewes per ha, which was the average stocking rate for this system during the experiment. The information was used to develop gross margins for each system and year. Average prices were used from 2008 to 2012 for the gross margins. For the 20-Paddock system lamb and ewe sale weights were scaled (lambs reduced by 10% and ewes reduced by 7%), based on the difference measured between the 1-Paddock and 20-Paddock systems during the experiment.
Based on historic climate data modelled over the last 40 years early weaning (15th Nov) would have been needed in 18% of years at which time the lambs would have been sold. The early weaning years in the last 40 were 1977, 1980, 1982, 1997, 2002, 2006 and 2009. At this time sale price was scaled to be 72% of the price from a normal sale time and on average lambs were 45% lighter than average (20.9 kg). In a further 20% of years, lambs would have been sold at the regular weaning time (15th Dec). At this time sale price was scaled to be 85% of the price in a normal year and on average lambs were 12% lighter (25.8 kg). The lambs would have been grown out to a greater sale weight in 62% of years (average sale weight 33.3 kg). In these years lambs did not often reach the target weight (set at a live weight of 40 kg in the model), although they gained >100g/day in body weight until sale. The model did not feed the lambs supplement in any year; rather the animals were sold when the pasture did not meet their requirements.
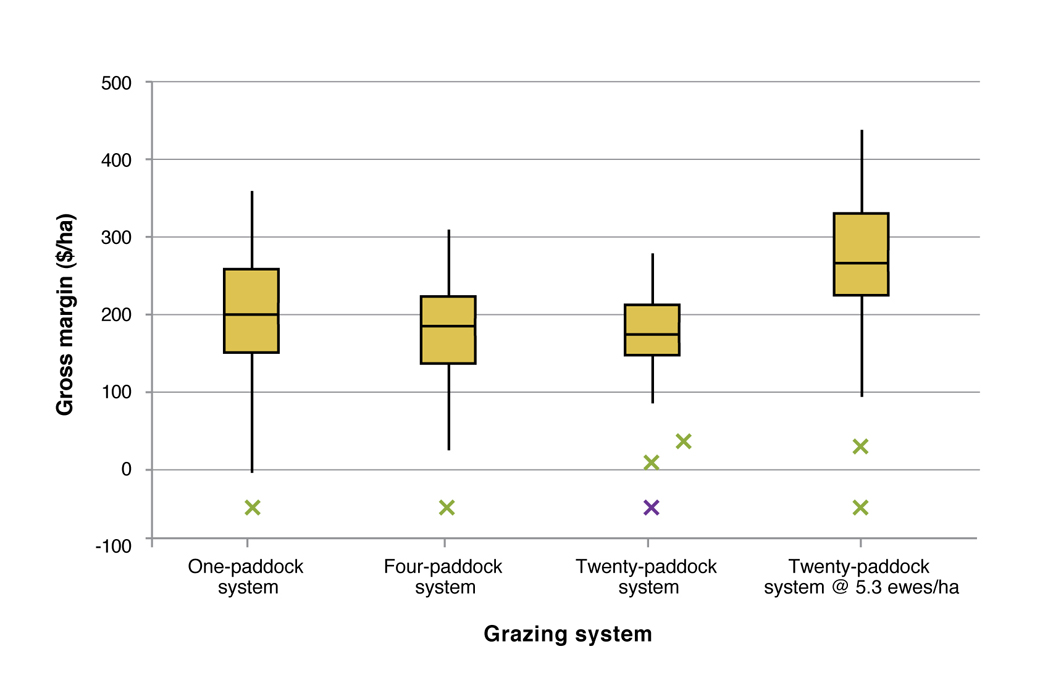
There was no significant difference between gross margin/ha and grazing system when they were run at the same stocking rate (average $176/ha; Figure 4), although the variation in profit decreased with increasing grazing intensity, which indicates that risk of low gross margins is reduced with increasing grazing intensity, but the chance of higher gross margins in any given year is also reduced. When the 20-Paddock system stocking rate was increased to 5.3 ewes per ha, the average run during the experiment, then the gross margin was significantly higher (average $258/ha) and the variability similar to the 1-Paddock system. Over the experimental period (2008 to 2011) the average gross margin predicted by the model (including the 20-Paddock 5.3 ewe system) was $254/ha, which was 29% higher than the 40 year average of $197/ha. This indicates that the seasonal conditions experienced during the experiment were above average and the performance of the system over the long-term is likely to be less than what was measured in the experiment.
Investment in infrastructure
[expand title=” ” swaptitle=” ” tag=”h4″ elwraptag=”div” elwrapclass=”expend-collapse-wrapper”]
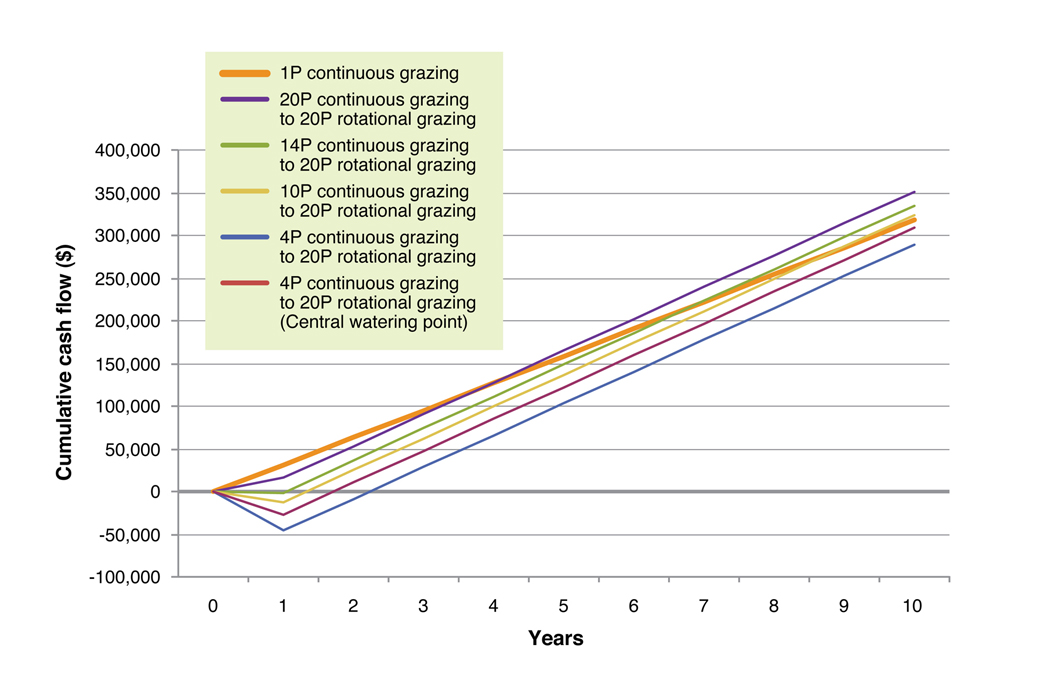
In the third stage, the experimental gross margins were used to determine the *net present value (NPV) and *internal rate of return (IRR) for each grazing system over 15 years when moving from 1-Paddock to 4-Paddock and 20-Paddock systems, including both where infrastructure was in place or had to be implemented. Average production results were used from 2009 and 2010, after stocking rates among treatments were adjusted, to form gross margins. The infrastructure to move from 1-Paddock to the 4-Paddock and 20-Paddock systems was 2000 and 7000 metres of fencing, respectively, and three and 12 watering points, respectively. A real discount rate of 5.3% was used to calculate NPV. A second analysis was performed on moving from continuous grazing to 20-Paddock rotational grazing, when starting with 20, 14, 10 and four existing paddocks. The 14, 10 and four existing paddocks were estimated to need 1500, 2500 and 5000 metres of electric fencing, and three, five and 12 water points, respectively. Electric fencing was costed at $5.10 per metre and watering points at $3000 each. The cumulative cash flow was also present for this analysis.
For a 100 ha typical farm, moving from a continuous grazing to a 4-Paddock or 20-Paddock grazing system, without investment in infrastructure but investment in additional stock had NPV (and IRR) values of $9293 (18.3%) and $41627 (23.9%), respectively. When the cost of all infrastructure was included the NPV (and IRR) was substantially lower at -$7370 (2.2%) and -$20599 (2.9%) for the 4-Paddock and 20-Paddock, respectively, with neither investment being viable. As level of existing infrastructure clearly influences the benefits of moving to a rotational grazing system, the level of initial infrastructure in the 20-Paddock system was investigated further. The NPV (and IRR) of moving from continuously grazing to a 20-Paddock rotational grazing, starting with 20, 14, 10 and four paddock infrastructure was $41627 (23.9%), $27177 (13.1%), $17544 (9.6%) and -$11747 (3.9%), respectively (Table 8). However, using a central watering point design with four paddocks reduced the initial investment in watering points from 12 to three, even though fencing length increased. The overall investment cost decreased and had a NPV of $4356 (6.4%), which made the development of a 20-Paddock system from a 4-Paddock infrastructure a viable investment, but with 12 year payback period. The cumulative cash flow analysis in Figure 5 demonstrates the payback period for each infrastructure investment and system change.
Table 8. Relationship between Net Present Value (NPV) and Internal Rate of Return (IRR) with initial paddock number when moving from continuous grazing to 20-Paddock rotational grazing.
| System change | NPV ($) | IRR (%) |
| 20-paddocks continuously grazed to 20-Paddock rotation | 41627 | 23.9 |
| 14-paddocks continuously grazed to 20-Paddock rotation | 27177 | 13.1 |
| 10-paddocks continuously grazed to 20-Paddock rotation | 17544 | 9.6 |
| 4-paddocks continuously grazed to 20-Paddock rotation | -11747 | 3.9 |
| 4-paddocks continuously grazed to 20-Paddock rotation – wagon wheel | 4356 | 6.4 |
* The NPV is the net sum of the discounted values of the future income and costs associated with the investment. It represents the amount of extra money an investor would have in current dollar terms above what was earned at the required rate of return, at the end of the investment period. The IRR is the breakeven discount rate for the investment. If all money for the investment was borrowed, the IRR would represent the maximum interest rate the investor could afford to pay on the loan without losing money.
Putting the research into practice
[expand title=” ” swaptitle=” ” tag=”h4″ elwraptag=”div” elwrapclass=”expend-collapse-wrapper”]
When considering making changes to grazing management, it’s important understand what other changes might be required to make the system profitable. Livestock enterprise, genetics, stocking rates, lambing/calving time, target market, soil fertility, pasture composition and management all require consideration.
[/expand]
Livestock system, genetics and stocking rates
[expand title=” ” swaptitle=” ” tag=”h4″ elwraptag=”div” elwrapclass=”expend-collapse-wrapper”]
At all EverGraze sites (including Orange), a Merino x Terminal enterprise, producing both lamb and wool, was selected on the basis of modelling which showed that it was a more profitable option than self-replacing Merino or crossbred enterprises. Sheep were also selected based on Australian Sheep Breeding Values to have higher than average genetic potential for wool production, reproductive performance and lamb growth. A later lambing time (August/September) at Orange meant that peak feed demand coincided with peak pasture supply. This allowed for higher stocking rates than could be achieved with an earlier lambing time. The high genetic potential of the lambs, combined with the increased feed availability under rotational grazing, meant that target store or light trade weights could be met on native pastures, even with the later lambing time, and with lower weaning weights recorded under rotational grazing.
The Orange Proof Site experiment results, together with modelling and previous research indicate that the greatest economic benefit from adoption of more intensive grazing systems comes from increased stock carrying capacity resulting from a combination of higher pasture production and utilisation. Therefore, to realise the benefits, it’s critical that higher feed availability is matched with increased stocking rates.
Decisions relating to stocking rate, lambing/calving times and enterprise selection are complex, and no one system set-up will suit every farm. EverGraze Exchanges – Livestock systems for profitable use of perennials; and Making strategic decisions; provide the key considerations and a process for analysing your own farm for making these decisions. The EverGraze Stocking Rate Calculator and Feed Budget and Rotation Planner are also useful tools for understanding the pattern of your current stocking rate and potential improvements to feed supply/demand.
[/expand]
Native pasture composition and fertility
[expand title=” ” swaptitle=” ” tag=”h4″ elwraptag=”div” elwrapclass=”expend-collapse-wrapper”]
There is great variation in the potential of different native grasses for livestock production. The landscape position, soil type and climate largely determine the species that are present in a native pasture. Previous research has demonstrated that desirable species for production in the high rainfall zone (HRZ) like Microlaena (Microlaena stipoides) and wallaby grass (Rytidosperma spp., formally called Austrodanthonia spp.) increase in response to superphosphate fertiliser and grazing pressure at the expense of tall grasses like kangaroo grass (Themeda triandra). In some areas these productive species may not be suited. If a native pasture does not have an adequate proportion of desirable species (e.g. a dominance of redgrass (Bothriochloa macra), speargrass (Austrostipa spp.) or wiregrass (Aristida spp.)) then it is likely that livestock production will be substantially lower than witnessed in this experiment and the profitability considerably less. In this scenario, the native pasture would need to be run in combination with improved pastures or significant supplementary feeding to fill winter feed gaps and supplement lower quality feed to meet reproductive performance targets.
This experiment did not examine different fertiliser levels. However, phosphorus levels were adequate in most areas of the site with the exception of the lower slopes (the High Production Zone) which averaged Colwell 21 ppm and was fertilised to maintain this level. While phosphorus is unlikely to limit native grass production, it is required to optimise the growth of clovers (mainly sub clover) and productive annual grasses (eg. annual ryegrass found at the Panuara site) needed for winter feed production. The legumes also supply nitrogen to stimulate growth of grasses. Without annual grasses or legumes then there would not be sufficient winter feed for a breeding ewe enterprise. Even in this experiment, the portion of perennials was so high that some supplementation of ewes was often required through winter. Therefore managing soil fertility is important to enable a breeding ewe enterprise to be run, which are generally more profitable than Merino wethers or cattle.
Other required investments
[expand title=” ” swaptitle=” ” tag=”h4″ elwraptag=”div” elwrapclass=”expend-collapse-wrapper”]
Investment in fencing and watering infrastructure and additional livestock may be needed when moving from continuous grazing to intensive rotational grazing with an increased stocking rate. This investment has a cost that requires a substantial payback period, which will vary depending on the existing infrastructure and stocking rate. If significant investment is needed (i.e. subdividing 4 paddocks into 20) then this investment may not be viable. The most efficient way to move from a continuous to a rotational grazing system is to use the existing paddocks first (i.e. combine mobs together and rotate them), and look for areas where the landscape can be used more efficiently to place subdivision fences and watering points (i.e. fencing into different production zones). This circumvents much of the investment cost, and may increase the benefits of infrastructure investment.
It is likely that on a real farm, the benefits to pasture utilisation and stock carrying capacity resulting from subdivision fencing will be greater than observed at experimental scale, especially if there is a high degree of variability in pastures, slope and aspect in individual paddocks. This is discussed in Saul 2011. Stories for how farmers have gone about implementing grazing strategies on farm, and the costs and benefits of subdivision fencing are discussed in case studies and Supporting Sites at Mark McKew’s farm at Warrak, Victoria; Woomargama Station in Holbrook, NSW; and at John Keogh’s farm in Holbrook NSW. Further information on landclass fencing can be found under Dividing up the farm for grazing management.
When considering investments in pastures and/or infrastructure to improve grazing management, the EverGraze Pasture Improvement Calculator can be used to calculate your own investment analysis. Examples for using the calculator can be found under Making Decisions.
Livestock management and planning
[expand title=” ” swaptitle=” ” tag=”h4″ elwraptag=”div” elwrapclass=”expend-collapse-wrapper”]
The Orange Proof Site grazing systems were not strict time-based rotations, but were planned to balance the requirements of pastures and livestock. Minimum ground cover (80%) and feed on offer (800 kg/ha) benchmarks were enforced at the site to ensure persistence of the pastures. Livestock were fed when required to ensure Lifetimewool condition targets were met. Rotations were sped up at times when feed on offer was high, and slowed when feed on offer was limiting. When running larger mobs and at higher stocking rates, it’s important to set targets, plan ahead, and constantly monitor both livestock and pastures to ensure targets are being met, and to take action early when feed on offer becomes limiting. Implementing a more intensive grazing system requires additional skills in livestock and pasture monitoring. It’s therefore important to start small, perhaps with only part of the farm or rotating animals at times of year when they are dry. Also seek training in programs such as Lifetime Ewe Management, Whole Farm Grazing Strategies or Prograze to obtain the required skills.
The EverGraze Feed Budget and Rotation Planner is a useful tool for planning ahead and keeping records to better understand the carrying capacity of each paddock. See Feed Budgeting and Tactical Management for examples of how this and other tools can be used. The EverGraze Exchange Nuts and Bolts of Grazing Strategies also provides the key principles and a process for implementation.
[/expand]
What it all means
- Implementing a more intensive grazing system on native pastures will result in higher production and gross margins, but only if increased feed on offer is matched with higher stocking rates, and lambs are kept longer after weaning to utilise extra feed on offer in years where it is available (62% at Panuara).
- At lower stocking rates, a lower intensity grazing system will be more profitable due to higher individual animal performance. The reduced performance in the higher intensity systems result from reduced diet quality due to animals being confined to areas of the landscape they would not normally graze frequently, and grazing plants that are in a later stage of maturity. However, if set stocking is used, it must be combined with flexible stocking rates so that ground cover and herbage mass benchmarks are met and persistence of perennials is not compromised.
- The long-term profitability of grazing native pasture depends on grazing conservatively enough to maintain productive pasture species and prevent natural resource management issues such as erosion, while also matching additional feed with higher stocking rates.
- Lower diet quality at higher grazing intensity may particularly impact on lambs reaching market specifications at sale, and this may need to be managed with flexibility in the grazing system (e.g. switching to set stocking for a period in spring) or production feeding.
- Where only moderate amounts of subdivision are required (eg. converting 10 paddocks set stocking to 20 paddocks rotational grazing), then it is viable to change systems. Where more substantial investments are required, the change may not be profitable. The best way to start is by combining mobs and rotating around existing paddocks. The cost of fencing can also be lowered by using electric fencing.
- A later lambing time allows for higher stocking rates but this needs to be combined with sheep of high genetic potential to achieve target market weights for lambs.
- In general, the results indicate that each system can be run profitably; provided they are managed well.
Acknowledgements
EverGraze is a Future Farm Industries CRC research and delivery partnership. The Orange Proof Site Team was led by Dr Warwick Badgery and consisted of scientists and technical staff at the NSW Department of Primary Industries and Charles Sturt University. An enthusiastic Regional Advisory Group consisting of farmers, consultants, extension officers and Catchment Management Authority staff also provided significant input into the direction, management and interpretation of project outcomes to make them relevant to farmers.
Authors and contributors
Dr Warwick Badgery, Department of Primary Industries, Orange, NSW
Geoff Millar, Department of Primary Industries, Orange, NSW
Phil Cranney, Department of Primary Industries, Orange, NSW
Kim Broadfoot, Department of Primary Industries, Orange, NSW
Lester McCormick, Department of Primary Industries, Tamworth, NSW
Kate Sargeant, Agriculture Victoria, Benalla
Karl Behrendt, Charles Sturt University, Orange, NSW
Further Information
- Orange EverGraze research message – Landscape variability can be identified, mapped and managed
- Orange EverGraze research message – Composition of pastures with a high native perennial component is stable under managed grazing
- EverGraze Exchange: Livestock systems for profitable and sustainable pasture use
- EverGraze Exchange – The nuts and bolts of grazing strategies
- EverGraze Case Study – Managing hill country pastures – challenges and benefits – Mark and Ange McKew, Warrak, South West Victoria
- EverGraze Case Study – Integrated system provides climate buffer – Chris Mirams, Holbrook
- Saul, G, Grazing management – sorting fact from fiction, Proceedings of the Grasslands Society of Southern Australia, 2012
- Broadford Grazing Experiment
- Waller RA, Sale PWG, Saul GR, Kearney GA (2001). Tactical versus rotational stocking in perennial ryegrass-subterranean clover pastures grazed by sheep in south-western Victoria. 3 Herbage nutritive value and animal production. Australian Journal of Experimental Agriculture 41, 1121-1131
- Chapman DF, McCaskill MR, Quigley PE, Thompson AN, Graham JF, Borg D, Lamb J, Kearney G, Saul GR, Clark SG, Effects of grazing method and fertiliser inputs on the productivity and sustainability of phalaris-based pastures in Western Victoria, Australian Journal of Experimental Agriculture 43(8) 785-798

