Northwood Caring For Our Country EverGraze Supporting Site (Gary McLarty)
Perennials prevail despite challenging seasons
Fast Facts
Site Location: Northwood, north-east Victoria
Host producers: Gary McLarty
Producer group: Seymour Wool Marketing Group
Site Coordinator: Lisa Warn, University of Melbourne, Mackinnon Project
Duration: 2010-2012
Site focus: To look at the cost benefit of phalaris pasture establishment compared to annual ryegrass (short term and self regenerating Wimmera).
The Farm
Rainfall: 525 mm
Enterprises: Wool (self-replacing wool Merino flock) and prime lambs
Farm area: 600 ha
Soils and landform: Loams and clay loams on sedimentary hills and clay loams on river flats.
Key points
- Short and variable seasons motivated the establishment of a Supporting Site to look at the cost and benefits of different pasture improvement options.
- The aim was to find out whether annual ryegrasses would be less risky than phalaris if springs frequently failed.
- The annual ryegrass species were quick to establish in 2010 and provide extra winter feed that year, but were also quick to become stressed in the dry in autumn of 2012.
- In the winter after establishment, the Wimmera ryegrass pasture produced as much winter feed as the short term Italian annual ryegrass, when not grazed until August.
- Phalaris is still considered the best option for this area but there is a need to improve the reliability of establishment, without increasing cost.
Background
A decade of challenging seasons
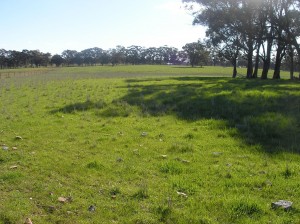
Gary has traditionally sown his better country to phalaris, leaving the lighter, stonier hill country under native perennial and annual grass pasture. But the poor seasons of 2000 – 2009, which included many late breaks and short springs, have jeopardised successful phalaris establishment, and reduced the productivity of the established pastures.
The unimproved pasture on the lighter soils was particularly challenged during the drought. This resulted in reduced ground cover and a rapid increase of weeds like heliotrope, erodium and paddy melons. Gary, along with other local farmers from the Seymour Wool Marketing Group, was therefore interested in seeing what other options were available for getting better pastures established quickly and more reliably. They wanted to improve pasture productivity and groundcover to outcompete weeds.
The Farm
Garys’ property, is located about 15 kilometres north of Seymour in northeast Victoria. It runs westward, with soils ranging from Goulburn River flats to sedimentary hill country. These soils, combined with an average annual rainfall of 525 mm, limit the average growing season to 6-7 months. “While I believe the potential carrying capacity of our property is 10 DSE/ha, seasons and pasture degradation meant the actual carrying capacity by the end of the drought was considerably less,” Gary said.
Choosing species
Gary was keen to try a self-regenerating annual such as Wimmera ryegrass, and manage it as a long term annual pasture. The second option was to use a short term Italian ryegrass, such as Tetila which is non-regenerating, in the first year before establishing phalaris.
Annual ryegrasses had been a popular pasture species choice in this district, either to provide quick winter feed or as a paddock clean-up phase in a pasture improvement program, or both. What was not known was the costs and benefits of these two options.
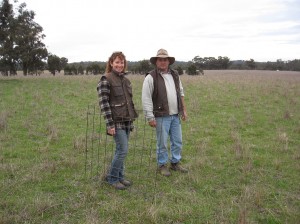
The Site
They created four paddocks of 6 hectares each, to use as Supporting Site paddocks, on the country usually sown to phalaris. Soil tests were taken on all four paddocks in early April 2010. The subsequent paddock preparations, sowing methods, pasture species and rates and fertiliser applications are outlined in Table 1.
Paddocks 1, 2 and 3 were sown in autumn (May) 2010 while Paddock 4 was sown in spring (mid-Sept) 2010. Heavy rain in mid-late winter delayed this sowing from August, which made it too late to sow sub clover with the phalaris.
The original plan for Paddock 2 was to sow the Italian ryegrass variety Tetila in the first year, and to follow this with a phalaris and sub clover sowing in the spring of the second year. It was hoped the Wimmera ryegrass sown in Paddock 1 would self- seed and remain in the pasture for many years.
Table 1: Establishment and maintenance details for each Supporting Site paddock
| Paddock | Date sown | Preparation and sowing method | Fertiliser/ | Pasture Mix | Establishment cost | Fertiliser in 2011 | Ongoing maintenance fertiliser |
| Paddock 1 (Wimmera ryegrass) | May 2010 | Spray (Paraquat and diquat)) Direct drill | 2 t/ha lime. 50 kg/ha DAP | Wimmera annual ryegrass (8 kg/ha), Riverina and Coolamon sub clover (8 kg/ha) | $367/ha | Poultry manure at 2 t/ha $65/ha | 0.8 kg of P/DSE at 12 DSE/ha $35/ha |
| Paddock 2 (Tetila ryegrass) | May 2010 | Spray (glyphosate and carfentrazone-ethyl) Direct drill | 2 t/ha lime. 50 kg/ha DAP | Betta Tetila Italian ryegrass (25 kg/ha), Persian (Shaftal) clover (3 kg/ha) | $421/ha | Poultry manure at 2 t/ha $65/ha | 0.8 kg of P/DSE at 12 DSE/ha $35/ha |
| Paddock 3 (Autumn-sown phalaris) | May 2010 | Spray (glyphosate and carfentrazone-ethyl) Direct drill | 2 t/ha lime. 50 kg/ha DAP | Landmaster phalaris (4 kg/ha), Riverina and Coolamon sub clover (8kg/ha) | $466/ha | Poultry manure at 2 t/ha $65/ha | 0.8 kg of P/DSE at 12 DSE/ha $35/ha |
| Paddock 4 (Spring-sown phalaris) | mid Sept 2010 | Spray (glyphosate and carfentrazone-ethyl) Direct drill | 2.5 t/ha lime. 50 kg/ha DAP | Landmaster phalaris (4 kg/ha) | $456/ha | Poultry manure at 2 t/ha $65/ha | 0.8 kg of P/DSE at 12 DSE/ha $35/ha |
Results and discussion
Sensational seasons
Gary said, “After a decade of dry seasons, we had 853 mm in 2010, compared to the long term average of 525 mm. This resulted in all the pastures establishing very successfully, producing far more pasture than we were able to utilise with the available stock. We rotationally grazed the new pastures once they had established and recorded the grazing days from each paddock to compare production. During the very good spring season in 2010, the Tetila ryegrass in Paddock 2 was allowed to run to head and drop seed. We did not have enough stock to adequately graze the pasture and prevent seeding in preparation for sowing phalaris and sub-clover in Year 2 as we had originally intended.”
Excess production
The ryegrass paddocks (1 and 2) were ready to graze by late July, only 10 weeks after they were sown. But the wet conditions at that time meant we delayed the first grazing of these paddocks until late August.
After being unable to utilise the early growth in these paddocks, they both had similar feed available on the 3rd of August, up to 1500 kg DM/ha in some areas and down to 500 kg DM/ha in wet areas. This indicated that the Tetila ryegrass had no apparent advantage in terms of winter feed production over the Wimmera ryegrass.
As the Tetila was only ever meant to be a short term pasture option, it was grazed more heavily than the Wimmera ryegrass or the phalaris pastures in spring, to fully utilise it while it was there. “We could have grazed the phalaris paddocks much harder in the spring and summer of 2010/11 as there was surplus feed after the abundant seasons. But we did not have enough stock on the property to be able to do this, nor could we cut hay or silage off any of the paddocks as they had surface rock present,” said Gary.
Ryegrass persistence
The ryegrass plants set seed in the spring of 2010 and died off over summer. Thanks to the favourable spring and good seed set, the June 2011 plant counts indicated that both the Wimmera and Tetila ryegrasses had come back in very good densities.
Gary explained, “after the early autumn break in 2012, we allowed the Tetila pasture to regenerate again. But there was then no follow-up rain until the end of May 2012, resulting in very small, moisture stressed seedlings that were impossible to accurately count.”
On a farm walk through the Supporting Site paddocks in April 2012, producers observed that the two annual ryegrass pastures were looking moisture stressed and not growing very well compared with the phalaris paddocks. “We therefore re-assessed the original plan to sow the Tetila paddock to phalaris, and decided to do this during the spring of 2012,” he said.
Phalaris performance
The autumn-sown phalaris was much slower to establish than the two ryegrass paddocks, and it only had about 500 kg DM/ha feed available on 3rd August.
The wet summer of 2010/11 meant the survival of both the autumn and spring sown phalaris pastures was excellent, and both could have been grazed much harder than they were, had more livestock been available. They started grazing the autumn sown phalaris (Paddock 4) in February 2011 and the spring sown in April 2011, after the phalaris had run to head. The size of the phalaris plants (basal cover) in both paddocks increased slightly from autumn 2011 to 2012.
Overall, the two phalaris paddocks have performed better than the two annual ryegrass paddocks, despite being slower to establish. This was especially apparent during the dry autumn of 2012. The results highlighted the fact that annuals, such as ryegrass, will not always provide more autumn/winter feed than phalaris, as the latter is a more robust species with greater resilience to moisture stress.
While it is still early days for this comparison, with only two years of data having been collected, we would expect the long term carrying capacity of the phalaris to be higher, assuming it persists well.
Balancing act
Overall, the autumn sown pastures were all under-utilised in these paddocks. This was due to the very good season and pasture growth across the whole farm, a lack of livestock available to graze it and hay or silage could not be cut to help manage the surplus.
“While this was a pleasant position for us to be in for a change, it did highlight the problems and risks associated with growing short-term fodder species compared to permanent perennial pastures,” explained Gary. In years when they are desperately needed it is often too dry to sow them early in autumn to get the desired winter feed, and in good years (like 2010) you don’t need the feed because all the other pastures are growing well. “For this reason, we continue to believe phalaris is the best pasture base for this area,” he said.
The critical thing with establishing phalaris is not to sow it too late in the year in case the spring cuts out early. This date will vary from district to district, but you need at least three months of soil moisture after sowing to ensure the plants are big enough to survive their first summer. Likewise, if the autumn break fails, you have the option to go for a late winter/early spring sowing or decide not to sow at all that year if conditions are looking dry. Direct drilling allows this flexibility with sowing.
Crunching the numbers
A cumulative net cash flow analysis was used to look at the feasibility of the different pasture improvement options and an estimate of return on capital as a measure of the value of the investment.
After reviewing the analysis, Gary commented that the economics show that in this country, whilst pasture improvement is worthwhile and necessary to be viable, it is costly and can take a long time to pay for itself. Gary believes that phalaris is still the best pasture option for him. “But as this shows, it is expensive and I think quite risky. We therefore need to look at more reliable, cheaper establishment methods and make sure paddock preparation includes adequate weed control,” he said.
“With our unreliable seasons, it is important to make the most of any opportunities to sow a pasture. If conditions are right we will sow in autumn, but if not we will wait for the spring. If the conditions are still not right, there is always next year – just be ready for the right conditions,” he said. “Wimmera ryegrass could still be an option in some country if we can do it cheaper, without the need to lime.”
See below for a full economic analysis of the pasture options at this site.
Science behind the story- Climate change modelling
In conjunction with the EverGraze Supporting Site, Gary McLarty’s farm was also used as a case study for a climate change project (Southern Livestock Adaptation 2030). The project used the computer-based modelling program GrassGroTM to model pasture growth for historic and future climate periods. It aimed to provide an estimate of future pasture production so sheep production systems can adapt to different climatic periods.
GrassGroTM is a farm pasture and livestock modelling tool that incorporates soil, weather, pasture, water, animal grazing and nutritional data collated from historical research.
The project was funded under the ‘Climate Change Adaptation in the Southern Australian Livestock Industries’ project, together with the Department of Environment and Primary Industries Victoria.
Inputs used
The livestock figures used in the modelling were validated to reflect Gary’s actual farm wool and meat production. To consider what the future climate might be like, three climate periods were considered as potential future scenarios:
- 1970-1999 – as the 30 year baseline period
- 2000-2009 – as the dry decade
- 2030 as projected for a 30 year period (2016-2045) by four Global Circulation Models (GCMs) from around the world.
The annual rainfall used for Seymour of 600 mm is higher than on Gary’s farm (525 mm). Each GCM was regionally adapted to the local weather of the property, which provides the inherent climate variability. For these models, atmospheric Carbon Dioxide was increased from 350 ppm to 430 ppm, which is the level extrapolated to 2030, using current trends with no mitigation.
Predicted results
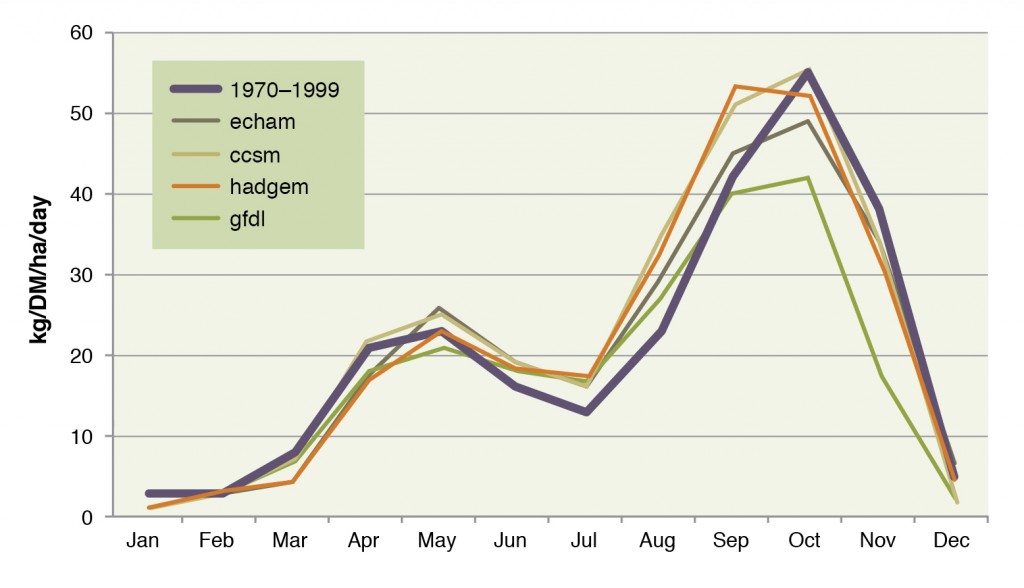
Figure 1 shows the average monthly phalaris pasture growth rates for the 2030 (2016–2045) period, as predicted by each of the four GCMs, compared to the 1970–1999 period. The general trend predicted by the GCMs for Seymour is for slightly warmer maximum and minimum temperatures, but the models are variable in their predictions of rainfall.
As shown in Figure 1, it is predicted this will impact pasture production by improving winter growth, but have earlier starts and ends to spring compared to the 1970-1999 period. These trends towards shorter springs may put more pressure on successful spring pasture establishment, although the warmer winters may allow for earlier sowing. Only one of the four models (gfdl) predicts significantly worse pasture growth for phalaris than the 1970–1999 period, and is similar in rainfall and pasture predictions to the 2000–2009 dry decade.
The pasture growth curves in Figure 1 show the ‘average’ response predicted by the GCMs for the thirty year period 2016–2045 but do not provide any indication of annual variability within this period.
From the past data and future model predictions, there is an indication that Seymour will continue to have periods of short growing seasons. This will challenge pasture establishment and production, especially if the springs do end up becoming shorter. But once established, the pastures are likely to provide a more robust and viable system than otherwise.
Source: Russell Pattinson, Southern Livestock Adaptation.
Economic Analysis
Investing in pasture improvement at Northwood
The Northwood EverGraze Supporting Site was initiated due to concern about the high risk of successfully establishing phalaris in dry years, as the previous decade had been.
When the site was established in 2010, the extremely good season ensured all the pastures sown established and produced successfully. These pastures included Wimmera ryegrass (as a cheaper and faster establishing, self-regenerating annual); a short term ryegrass (followed by phalaris) and phalaris.
To consider the feasibility of the pasture improvement options, cumulative net cash flows provide a guide as to the affordability and payback times of the investment. An estimate of return on capital (as Internal Rate of Return) gives a guide as to whether the investment is worthwhile. A comment on the risk of failed establish is included, with a look at past and future climate in this area.
Is it affordable?
A cumulative net cash flow shows the annual cash flow associated with each improved pasture investment option. It includes the capital and extra maintenance costs associated with improving the pasture, purchase of extra stock and interest costs to allow for both the borrowing of capital and the opportunity cost of investing. It also includes the additional net income from the extra stock that are run on the paddock.
Adding the cumulative costs and income associated with the investment provides a guide as to the time it may take to start to return to positive cash flow. This allows decisions to be made as to whether the full cost of establishment and initial negative cash flow can be afforded.
In this analysis, the extra costs and income of the pasture investment are presented on a per hectare basis. The whole farm implications (on cash flow and total debt) of sowing down a portion of the farm also need to be estimated and considered.
Costs and Returns
In this analysis, actual pasture costs (at contractor rates) as used in the Supporting Site are used in the pasture improvements calculations. Establishment costs are high due to the application of lime prior to sowing.
For the enterprise returns we used the long term (41 year average adjusted to current values) of $26/DSE for wool enterprises in the southwest region from the Livestock Farm Monitor Project Report (2010-11) and the seven year average gross margin of $20/DSE for wool flocks in the northeast. Using the average long term gross margin makes allowance for normal annual variation due to season and prices. The purchase of extra Merino ewes to utilise the extra feed are costed at $110/ewe ($61/DSE). The interest rate used is 8% and inflation set at 3%.
Stocking rates
The base stocking rate on the well fertilised but degraded perennial and annual pastures before the improvements was estimated at about 7 DSE/ha. The changes in stocking rate experienced on the site have been used in calculations, adjusted slightly given the exceptional season based on the local experience of Lisa Warn (site coordinator) and Gary McLarty (owner). These stocking rate changes are shown for the three treatments in Table 2.
The phalaris pastures are estimated to lead to at least a doubling of the existing stocking rate (an extra 7 DSE/ha). It is only the additional stocking rate above the base level (business as usual) that is included in the cash flow.
Table 2 – Stocking rates for the pasture improvement options at Northwood EverGraze Supporting Site (Wimmera ryegrass, Tetila ryegrass followed by phalaris, and phalaris.
| Year | 0 | 1 | 2 | 3 | 4 | 5 | 6 | 7 | 8 | 9 |
| Wimmera | 4.9 | 8.1 | 10 | 11 | 11 | 11 | 11 | 11 | 11 | 10 |
| Italian ryegrass (Tetila) then phalaris after year 2 | 8.8 | 4.7 | 6 | 10 | 14 | 14 | 14 | 14 | 14 | 14 |
| Phalaris | 3 | 6.1 | 10 | 14 | 14 | 14 | 14 | 14 | 14 | 14 |
What is not included
Improving pastures may lead to better animal production as well as a higher stocking rate, through better feed quality. The effects of this improved production cannot be captured with grazing days, so they have not been included in the gross margin calculations.
There has also been no allowance made for feeding stock in the years of pasture establishment, as it is assumed the rest of the farm can carry the livestock. However in some years, initial loss of feed supply from the paddock being improved could necessitate feeding stock, which would increase the costs of establishing new pastures.
Payback periods
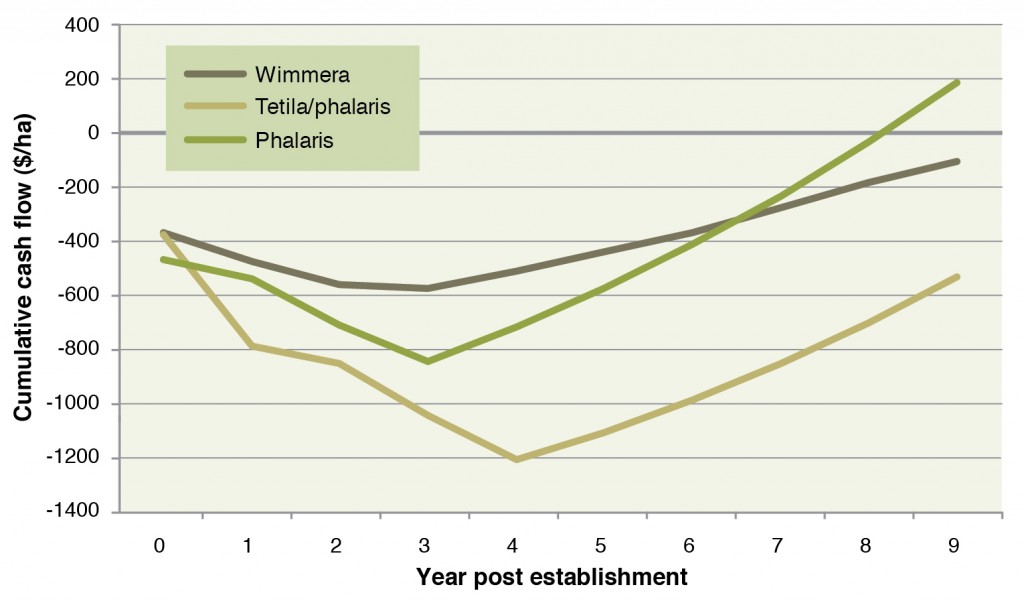
Figure 2 shows the cumulative net cash flows for the three investment options on a $/ha basis, using an enterprise gross margin of $26/ha.
All the pasture options, except the phalaris, have taken over 10 years to return to positive cash flow. This period is long because of the cost included to buy extra stock and the interest rate of 8% on all borrowings. The pasture establishment costs for the Tetila and phalaris pastures were around $450/ha. But the cost of purchasing more ewes brings the extra costs (as $/ha) to around $920/ha for the phalaris option and $1200/ha for the Tetila/phalaris pasture. The Tetila pasture, although providing the most feed in the first year, is more costly because of the two years of establishment costs. This means peak debt is postponed to the fourth year after establishment.
A less profitable enterprise with a GM of $20/DSE prolongs the negative cash flow period by 1-2 years for all pasture options. A bigger increase in stocking rates, lower interest and/or higher enterprise gross margins will improve the payback periods for all pasture options.
Is it a good investment?
Cash flows alone do not tell us whether this improvement is a good investment. The common measure that is used to help decide whether an investment is worthwhile, is return to the marginal capital invested, called the Internal Rate of Return (IRR). The IRR is a measure of the economic efficiency of the investment over a set period of time, and can be compared with returns from alternative investments of the same capital, with a similar life and that are similarly risky.
The IRR accounts for all the income generated over the period, less the costs of the improvements. It also includes a salvage or depreciated value of the capital investments (such as livestock, fencing and pasture improvement) at the end of the time period. Ten years is common for pasture improvement programs.
Table 3 shows the gross margins per hectare (when the improved pastures achieve potential), Return on Capital (IRR) for all pasture options compared to business as usual. IRR is estimated with an enterprise gross margin of $20/DSE and $26/DSE and a discount rate of 10%, over ten years.
Table 3. Gross margins and return to capital (Internal Rate of Return) estimates for three pasture improvement options at Northwood Supporting Site, compared to business as usual.
| Business as usual | Wimmera | Tetila ryegrass followed by phalaris | Phalaris | |
| Stocking rate when potential (DSE/ha) | 7 | 11 | 14 (phalaris) | 14 |
| GM ($/ha) at potential At $20/DSE At $26/DSE |
$140$182 | $220 $286 |
$280 $364 |
$280 $364 |
| Value of investment (compared to business as usual) | ||||
| Return to Capital (IRR) $20/DSE $26/DSE |
8 % 12 % |
6 % 10 % |
13 % 17 % |
|
Getting a return
Despite the long payback period, return on capital (IRR) ranges from 6% to 13%, which is generally considered a good return. An enterprise gross margin of $26/DSE increases the returns significantly, as well as increasing returns to capital to 10-17% .
So any of these pasture improvements could be considered a good investment, depending on the return thought acceptable and the profitability of the enterprise. But because of the high investment and long payback period, they may not be affordable.
The Tetila/phalaris pasture option is the least affordable using these prices and returns, taking over 10 years to return positive cash flow. But if cash or stock are cheap, this option may be considered a good investment at a return of 6% or 10%.
Increasing stocking rates significantly across the farm may increase labour and overhead or infrastructure costs as well as potentially increased exposure to tough seasons, and these should be considered before making large scale improvements.
Estimating risk
Using historic rainfall records and predicted pasture growth, Gary estimated that he could have successfully sown phalaris in spring in 20 of the past 40 years. While many years were hard to call, Gary felt that the risk of failed establishment could be as high as nine years out of 40 or 22%.
There are various methods of estimating ‘risk’ but generally most farmers will make a decision on whether the benefits of the improved productivity is worth the perceived risk of failed establishment. If the risk is seen as too high, then it may be worth considering other options including different pasture species or altering the method and/or timing of establishment. This could include wanting a better return on investment to cover the risk.
For example, if a 6% return on capital is seen as a reasonable return, then 10% may be needed to cover the risk. In the estimates shown in Table 2, if 6% return on capital is a good return, all options are good investments. But to cover a 20% risk of failure, these pasture options may only be considered a good investment if the long term gross margin of the enterprise is at least $26/DSE to bring greater than a 10% return.
A full explanation of the economic terms and costs used here are outlined in the Investing in Pasture Improvement page.
Acknowledgements
This site was supported by Meat and Livestock Australia, Caring for Our Country, Central Highlands Agribusiness Forum, Agriculture Victoria and Future Farm Industries CRC through the National EverGraze Project.
 |
 |
 |
 |
Further Information
- EverGraze Action – Grazing phalaris for production and persistence
- Broadford Grazing Experiment (Grazing management of phalaris)
- EverGraze Action – Growing and using lucerne
- Hamilton EverGraze research message – Lucerne reduces risk, provides options for livestock and prevents salinity
- Wagga Wagga EverGraze research message – More lucerne increases production and profit
- Guide to assessing the costs and benefits of pasture establishment
- Investing in pasture improvement
