Regional pasture growth rates
Following are a series of pasture growth rate (kg/ha/day) tables and graphs for regions across Australia. This data set was compiled for the Meat and Livestock Australia Feed Demand Calculator using validated curves from research sites, data presented in GrassGro, and with input from experienced research and extension professionals. The growth rate values should be used only as a guide only. Ways to measure and calculate your own pasture growth is provided here.
New South Wales
North West Slopes (Tamworth)
|
|
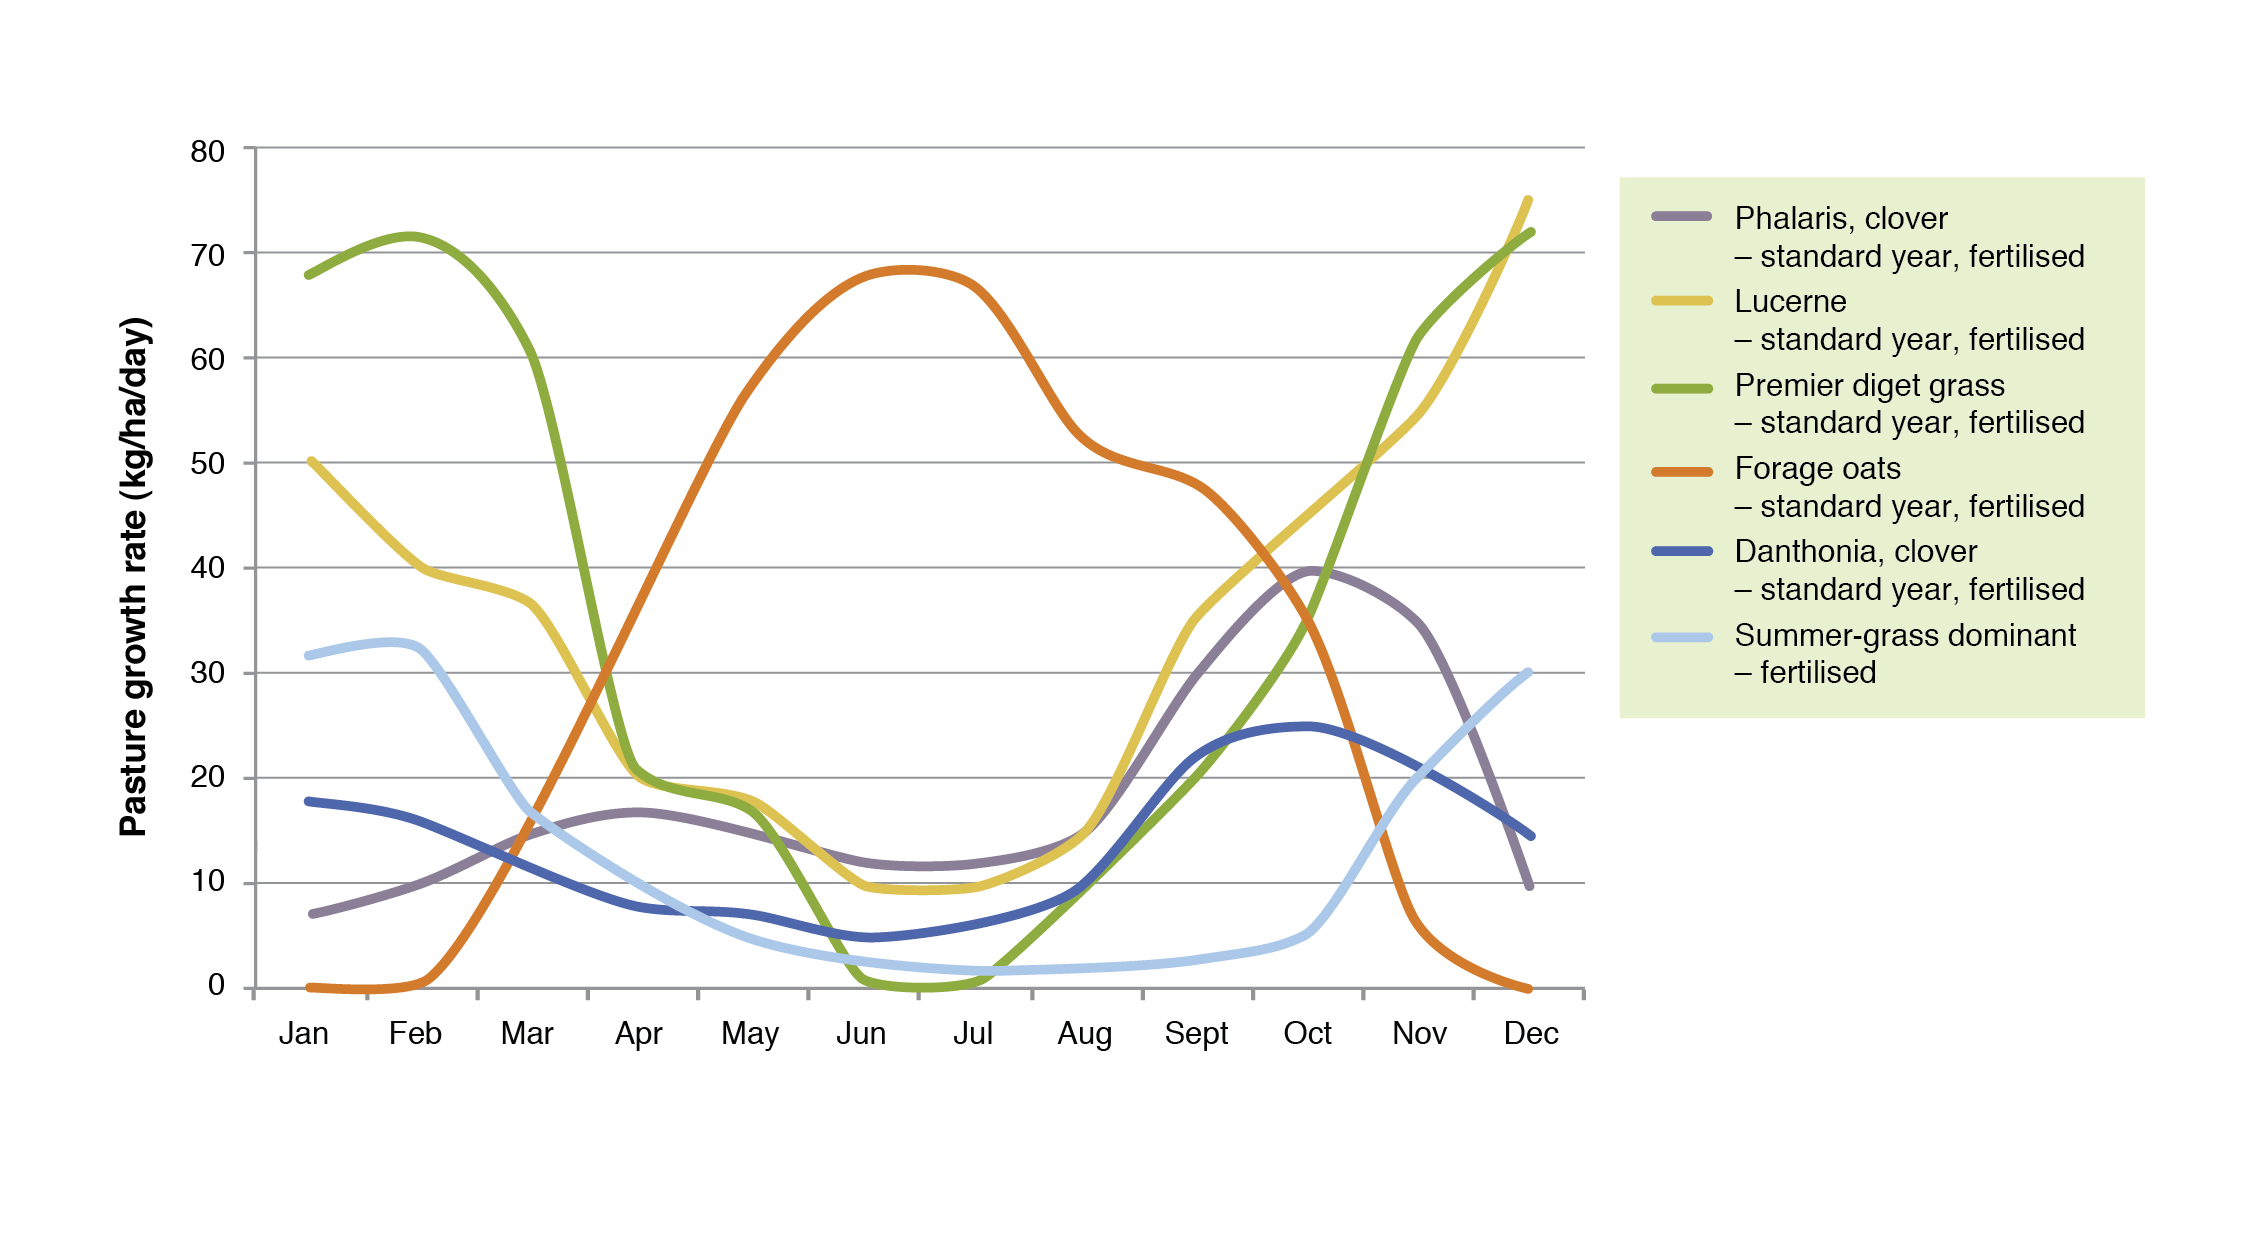
Table 1. Growth rates (kg/ha/day) for various pasture species in North West Slopes NSW
| Growth rates (kg/ha/day) | ||||||||||||
| J | F | M | A | M | J | J | A | S | O | N | D | |
| Phalaris, clover – Standard year, Fertiliser | 7 | 10 | 15 | 17 | 15 | 12 | 12 | 15 | 30 | 40 | 35 | 10 |
| Lucerne – Standard year, Fertiliser | 50 | 40 | 37 | 20 | 18 | 10 | 10 | 15 | 35 | 45 | 55 | 75 |
| Premeir diget grass – Standard year, Fertiliser | 68 | 72 | 61 | 20 | 17 | 0 | 0 | 10 | 20 | 35 | 62 | 72 |
| Rhodes grass – Standard year, Fertiliser | 40 | 55 | 50 | 22 | 18 | 0 | 0 | 5 | 15 | 20 | 32 | 35 |
| Swan Forest bluegrass – Standard year, Fertiliser | 40 | 38 | 40 | 22 | 20 | 0 | 0 | 5 | 8 | 18 | 10 | 20 |
| Forage sorghum – Standard year, Fertiliser | 100 | 95 | 68 | 21 | 0 | 0 | 0 | 0 | 0 | 7 | 42 | 140 |
| Forage oats – Standard year, Fertiliser | 0 | 0 | 18 | 38 | 57 | 68 | 67 | 52 | 48 | 35 | 5 | 0 |
| Danthonia, clover – Standard year, Fertiliser | 18 | 16 | 12 | 8 | 7 | 5 | 7 | 10 | 22 | 25 | 20 | 15 |
| Summer grass dominant, Fertiliser | 32 | 33 | 17 | 10 | 5 | 3 | 2 | 2 | 3 | 5 | 20 | 30 |
| Native perennials – Standard year, No fertiliser | 22 | 23 | 18 | 7 | 3 | 0 | 0 | 3 | 7 | 7 | 10 | 20 |
North West Slopes (Warialda)
Table 2. Growth rates (kg/ha/day) for sown grass in North West Slopes NSW (Warialda)
| Growth rates (kg/ha/day) | ||||||||||||
| J | F | M | A | M | J | J | A | S | O | N | D | |
| Sown grass – Standard year | 27 | 23 | 20 | 8 | 2 | 0 | 0 | 0 | 5 | 18 | 29 | 30 |
| Sown grass – Poor year | 9 | 9 | 13 | 3 | 1 | 0 | 0 | 0 | 4 | 14 | 19 | 14 |
| Sown grass – Good year | 44 | 41 | 36 | 14 | 2 | 0 | 0 | 1 | 6 | 19 | 34 | 41 |
| Table 3. Growth rates (kg/ha/day) for native grass in North West Slopes NSW (Warialda) | ||||||||||||
| Growth rates (kg/ha/day) | ||||||||||||
| J | F | M | A | M | J | J | A | S | O | N | D | |
| Native grass – Standard year | 24 | 21 | 18 | 7 | 2 | 0 | 0 | 0 | 4 | 15 | 24 | 27 |
| Native grass – Poor year | 9 | 8 | 12 | 3 | 1 | 0 | 0 | 0 | 3 | 12 | 16 | 13 |
| Native grass – Good year | 40 | 38 | 32 | 12 | 2 | 0 | 0 | 1 | 5 | 16 | 28 | 37 |
| Table 4. Growth rates (kg/ha/day) for forage sorghum in North West Slopes NSW (Warialda) | ||||||||||||
| Growth rates (kg/ha/day) | ||||||||||||
| J | F | M | A | M | J | J | A | S | O | N | D | |
| Forage sorghum – Standard year | 79 | 49 | 33 | 13 | 1 | 0 | 0 | 0 | 0 | 0 | 13 | 65 |
| Forage sorghum – Poor year | 42 | 32 | 20 | 5 | 0 | 0 | 0 | 0 | 0 | 0 | 9 | 42 |
| Forage sorghum – Good year | 94 | 52 | 48 | 18 | 0 | 0 | 0 | 0 | 0 | 0 | 26 | 94 |
| Table 5. Growth rates (kg/ha/day) for Lablab in North West Slopes NSW (Warialda) | ||||||||||||
| Growth rates (kg/ha/day) | ||||||||||||
| J | F | M | A | M | J | J | A | S | O | N | D | |
| Lablab – Standard year | 50 | 40 | 32 | 13 | 1 | 0 | 0 | 0 | 0 | 0 | 14 | 47 |
| Lablab – Poor year | 24 | 18 | 17 | 3 | 0 | 0 | 0 | 0 | 0 | 0 | 13 | 22 |
| Lablab – Good year | 72 | 60 | 57 | 28 | 0 | 0 | 0 | 0 | 0 | 0 | 27 | 64 |
| Table 6. Growth rates (kg/ha/day) for lucerne in North West Slopes NSW (Warialda) | ||||||||||||
| Growth rates (kg/ha/day) | ||||||||||||
| J | F | M | A | M | J | J | A | S | O | N | D | |
| Lucerne – Standard year | 19 | 19 | 20 | 19 | 15 | 14 | 16 | 22 | 26 | 22 | 21 | 22 |
| Lucerne – Poor year | 7 | 10 | 11 | 9 | 6 | 12 | 7 | 10 | 11 | 6 | 7 | 8 |
| Lucerne – Good year | 30 | 25 | 24 | 30 | 22 | 21 | 22 | 34 | 38 | 41 | 46 | 45 |
| Table 7. Growth rates (kg/ha/day) for oats in North West Slopes NSW (Warialda) | ||||||||||||
| Growth rates (kg/ha/day) | ||||||||||||
| J | F | M | A | M | J | J | A | S | O | N | D | |
| Oats – Standard year | 0 | 0 | 0 | 3 | 35 | 25 | 33 | 39 | 36 | 23 | 16 | 0 |
| Oats – Poor year | 0 | 0 | 0 | 2 | 22 | 29 | 27 | 26 | 20 | 8 | 1 | 0 |
| Oats – Good year | 0 | 0 | 0 | 2 | 30 | 22 | 43 | 43 | 42 | 35 | 39 | 0 |
Northern Tablelands
Table 8. Growth rates (kg/ha/day) for tall fescue, clover in Northern Tablelands, NSW
| Growth rates (kg/ha/day) | ||||||||||||
| J | F | M | A | M | J | J | A | S | O | N | D | |
| Tall fescue, clover – Standard year, Fertilised | 58 | 57 | 51 | 28 | 12 | 9 | 9 | 11 | 23 | 38 | 51 | 59 |
| Tall fescue, clover – Good year, Fertilised | 75 | 74 | 89 | 49 | 21 | 12 | 12 | 14 | 30 | 49 | 66 | 77 |
| Tall fescue, clover – Poor year, Fertiliser | 35 | 34 | 20 | 11 | 5 | 5 | 5 | 7 | 14 | 23 | 31 | 35 |
| Table 9. Growth rates (kg/ha/day) for phalaris, clover in Northern Tablelands, NSW | ||||||||||||
| Growth rates (kg/ha/day) | ||||||||||||
| J | F | M | A | M | J | J | A | S | O | N | D | |
| Phalaris, clover – Standard year, Fertiliser | 26 | 30 | 36 | 34 | 13 | 9 | 9 | 11 | 22 | 37 | 49 | 51 |
| Phalaris, clover – Good year, Fertiliser | 34 | 39 | 63 | 60 | 23 | 12 | 12 | 14 | 29 | 48 | 64 | 66 |
| Phalaris, clover – Poor year, Fertiliser | 16 | 18 | 14 | 14 | 5 | 5 | 5 | 7 | 13 | 22 | 29 | 31 |
| Table 10. Growth rates (kg/ha/day) for redgrass in Northern Tablelands, NSW | ||||||||||||
| Growth rates (kg/ha/day) | ||||||||||||
| J | F | M | A | M | J | J | A | S | O | N | D | |
| Redgrass – Standard year, No fertiliser | 33 | 33 | 29 | 9 | 2 | 1 | 1 | 1 | 7 | 27 | 33 | 34 |
| Redgrass – Good year, No fertiliser | 43 | 43 | 51 | 16 | 4 | 1 | 1 | 1 | 9 | 35 | 43 | 44 |
| Redgrass – Poor year, No fertiliser | 20 | 20 | 12 | 4 | 1 | 1 | 1 | 1 | 4 | 16 | 20 | 20 |
| Table 11. Growth rates (kg/ha/day) for Microlaena, clover in Northern Tablelands, NSW | ||||||||||||
| Growth rates (kg/ha/day) | ||||||||||||
| J | F | M | A | M | J | J | A | S | O | N | D | |
| Microlaena, clover – Standard year, Fertiliser | 39 | 36 | 29 | 18 | 8 | 3 | 3 | 7 | 19 | 33 | 40 | 44 |
| Microlaena, clover – Good year, Fertiliser | 51 | 47 | 51 | 32 | 14 | 4 | 4 | 9 | 25 | 43 | 52 | 57 |
| Microlaena, clover – Poor year, Fertiliser | 23 | 22 | 12 | 7 | 3 | 2 | 2 | 4 | 11 | 20 | 24 | 26 |
| Table 12. Growth rates (kg/ha/day) for perennial ryegrass, clover in Northern Tablelands, NSW | ||||||||||||
| Growth rates (kg/ha/day) | ||||||||||||
| J | F | M | A | M | J | J | A | S | O | N | D | |
| Perennial ryegrass, clover – Standard year, Fertiliser | 20 | 28 | 38 | 34 | 13 | 9 | 9 | 11 | 23 | 43 | 47 | 35 |
| Perennial ryegrass, clover – Good year, Fertiliser | 26 | 36 | 67 | 60 | 23 | 12 | 12 | 14 | 30 | 56 | 61 | 46 |
| Perennial ryegrass, clover – Poor year, Fertiliser | 12 | 17 | 15 | 14 | 5 | 5 | 5 | 7 | 14 | 26 | 28 | 21 |
Central Tablelands
|
|
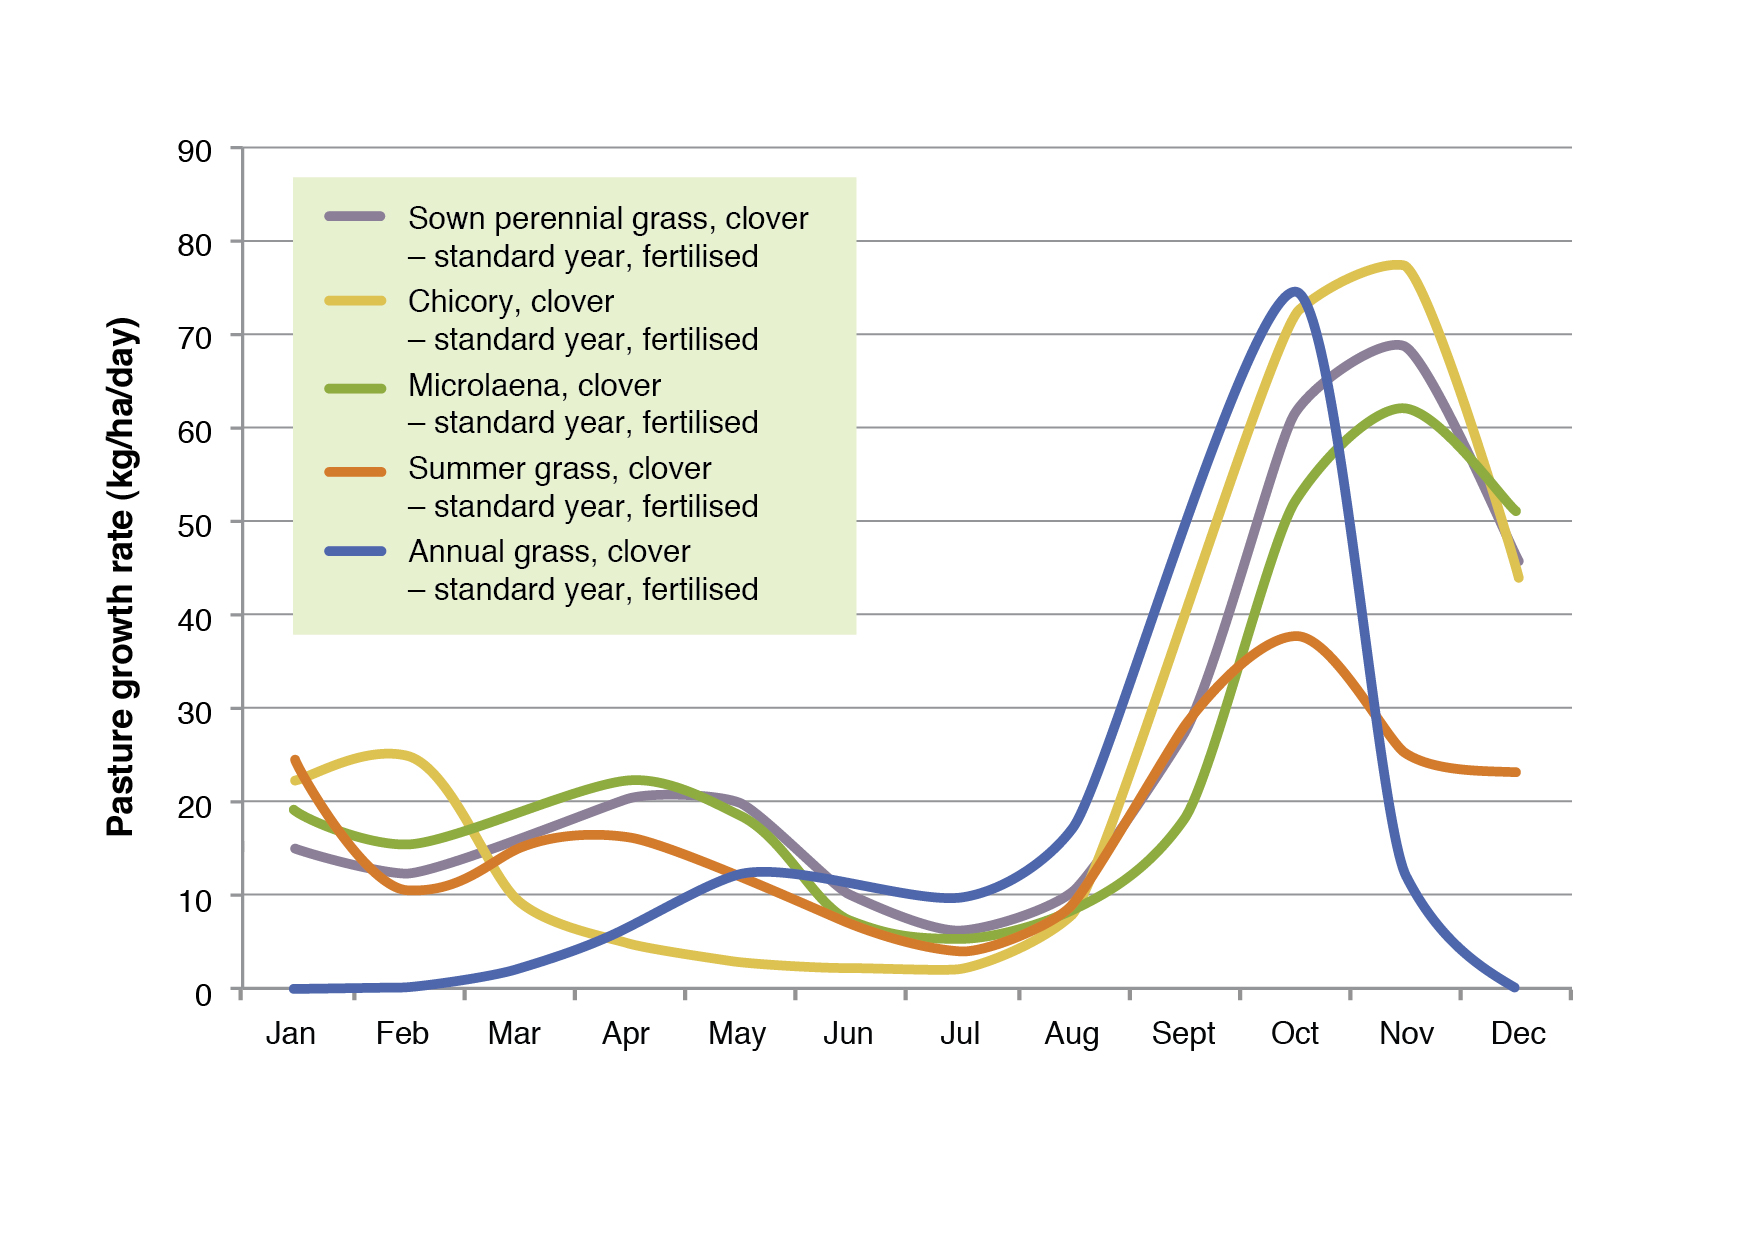
Table 13. Growth rates (kg/ha/day) for sown perennial ryegrass, clover in Central Tablelands, NSW
| Growth rates (kg/ha/day) | ||||||||||||
| J | F | M | A | M | J | J | A | S | O | N | D | |
| Sown perennial grass, clover – Standard year, Fertlised | 15 | 12 | 16 | 20 | 20 | 10 | 6 | 10 | 27 | 61 | 69 | 45 |
| Sown perennial grass, clover – Good year, Fertilised | 30 | 24 | 26 | 33 | 33 | 14 | 8 | 14 | 41 | 92 | 104 | 90 |
| Sown perennial grass, clover – Poor year, Fertilised | 5 | 4 | 6 | 8 | 8 | 4 | 2 | 4 | 16 | 37 | 41 | 16 |
| Table 14. Growth rates (kg/ha/day) for chicory, clover in Central Tablelands, NSW | ||||||||||||
| Growth rates (kg/ha/day) | ||||||||||||
| J | F | M | A | M | J | J | A | S | O | N | D | |
| Chicory, clover – Standard year, Fertilised | 22 | 25 | 9 | 5 | 3 | 2 | 2 | 8 | 42 | 73 | 77 | 44 |
| Table 15. Growth rates (kg/ha/day) for Microlaena, clover in Central Tablelands, NSW | ||||||||||||
| Growth rates (kg/ha/day) | ||||||||||||
| J | F | M | A | M | J | J | A | S | O | N | D | |
| Microlaena, clover – Standard year, Fertilised | 19 | 15 | 19 | 22 | 19 | 7 | 5 | 8 | 18 | 52 | 62 | 51 |
| Microlaena, clover – Good year, Fertilised | 38 | 30 | 31 | 36 | 31 | 10 | 7 | 11 | 27 | 78 | 93 | 102 |
| Microlaena, clover – Poor year, Fertilised | 6 | 5 | 8 | 9 | 8 | 3 | 2 | 3 | 11 | 31 | 37 | 16 |
| Microlaena – Standard year, No fertiliser | 15 | 14 | 19 | 21 | 15 | 3 | 3 | 3 | 9 | 34 | 51 | 32 |
| Microlaena – Good year, No fertiliser | 30 | 28 | 31 | 35 | 25 | 4 | 4 | 4 | 14 | 51 | 77 | 64 |
| Microlaena – Poor year, No fertiliser | 5 | 4 | 8 | 8 | 6 | 1 | 1 | 1 | 5 | 20 | 31 | 16 |
| Table 16. Growth rates (kg/ha/day) for summer grass, clover in Central Tablelands, NSW | ||||||||||||
| Growth rates (kg/ha/day) | ||||||||||||
| J | F | M | A | M | J | J | A | S | O | N | D | |
| Summer grass, clover – Standard year, Fertilised | 24 | 10 | 15 | 16 | 12 | 7 | 4 | 8 | 28 | 38 | 25 | 23 |
| Summer grass, clover – Good year, Fertilised | 48 | 20 | 25 | 26 | 20 | 10 | 6 | 11 | 42 | 57 | 38 | 46 |
| Summer grass, clover – Poor year, Fertilised | 7 | 3 | 6 | 6 | 5 | 3 | 2 | 3 | 17 | 23 | 15 | 16 |
| Summer grass – Standard year, No fertiliser | 24 | 10 | 14 | 14 | 2 | 2 | 2 | 2 | 2 | 4 | 16 | 23 |
| Summer grass – Good year, No fertiliser | 48 | 20 | 23 | 23 | 3 | 3 | 3 | 3 | 3 | 6 | 24 | 46 |
| Summer grass – Poor year, No fertiliser | 7 | 3 | 6 | 6 | 1 | 1 | 1 | 1 | 1 | 2 | 10 | 16 |
| Table 17. Growth rates (kg/ha/day) for annual grass, clover in Central Tablelands, NSW | ||||||||||||
| Growth rates (kg/ha/day) | ||||||||||||
| J | F | M | A | M | J | J | A | S | O | N | D | |
| Annual grass, clover – Standard year, Fertilised | 0 | 0 | 2 | 6 | 12 | 11 | 9 | 17 | 45 | 74 | 10 | 0 |
| Annual grass, clover – Good year, Fertilised | 0 | 0 | 3 | 10 | 20 | 15 | 13 | 24 | 68 | 111 | 15 | 0 |
| Annual grass, clover – Poor year, Fertilised | 0 | 0 | 1 | 2 | 5 | 4 | 4 | 7 | 27 | 44 | 6 | 16 |
Central West Slopes
Table 18. Growth rates (kg/ha/day) for temperate grass, clover in Central West Slopes, NSW
| Growth rates (kg/ha/day) | ||||||||||||
| J | F | M | A | M | J | J | A | S | O | N | D | |
| Temperate grass, clover – Standard year, Fertilised | 7 | 5 | 8 | 10 | 14 | 16 | 10 | 20 | 30 | 50 | 41 | 17 |
| Temperate grass, clover – Good year, Fertilised | 14 | 10 | 16 | 20 | 28 | 27 | 17 | 34 | 51 | 85 | 70 | 34 |
| Temperate grass, clover – Poor year, Fertilised | 1 | 2 | 3 | 4 | 6 | 6 | 4 | 4 | 6 | 10 | 8 | 3 |
| Table 19. Growth rates (kg/ha/day) for sub clover in Central West Slopes, NSW | ||||||||||||
| Growth rates (kg/ha/day) | ||||||||||||
| J | F | M | A | M | J | J | A | S | O | N | D | |
| Sub clover – Standard year, Fertilised | 0 | 0 | 0 | 2 | 7 | 10 | 10 | 15 | 30 | 27 | 10 | 0 |
| Sub clover – Good year, Fertilised | 0 | 0 | 0 | 4 | 14 | 17 | 17 | 26 | 51 | 46 | 17 | 0 |
| Sub clover – Poor year, Fertilised | 0 | 0 | 0 | 1 | 3 | 4 | 4 | 5 | 10 | 9 | 5 | 0 |
| Table 20. Growth rates (kg/ha/day) for summer grass in Central West Slopes, NSW | ||||||||||||
| Growth rates (kg/ha/day) | ||||||||||||
| J | F | M | A | M | J | J | A | S | O | N | D | |
| Summer grass – Standard year, Not fertilised | 20 | 24 | 9 | 2 | 2 | 2 | 2 | 2 | 2 | 3 | 11 | 25 |
| Summer grass – Good year, Not fertilised | 40 | 48 | 18 | 4 | 4 | 3 | 3 | 3 | 3 | 5 | 19 | 50 |
| Summer grass – Poor year, Not fertilised | 4 | 10 | 4 | 1 | 1 | 1 | 1 | 0 | 0 | 1 | 2 | 5 |
| Table 21. Growth rates (kg/ha/day) for lucerne, clover in Central West Slopes, NSW | ||||||||||||
| Growth rates (kg/ha/day) | ||||||||||||
| J | F | M | A | M | J | J | A | S | O | N | D | |
| Lucerne, clover pasture – Standard year, Fertilised | 25 | 25 | 28 | 31 | 26 | 17 | 10 | 10 | 22 | 45 | 43 | 26 |
| Lucerne, clover pasture- Good year, Fertilised | 50 | 50 | 56 | 62 | 52 | 29 | 17 | 17 | 37 | 77 | 73 | 52 |
| Lucerne, clover pasture – Poor year, Fertilised | 5 | 10 | 11 | 12 | 10 | 7 | 4 | 2 | 4 | 9 | 9 | 5 |
| Lucerne – Standard year, Fertilised | 25 | 25 | 28 | 31 | 24 | 13 | 9 | 9 | 18 | 45 | 43 | 26 |
| Lucerne – Good year, Fertilised | 50 | 50 | 56 | 62 | 48 | 22 | 15 | 15 | 31 | 77 | 73 | 52 |
| Lucerne – Poor year, Fertilised | 5 | 10 | 11 | 12 | 10 | 5 | 4 | 2 | 4 | 9 | 9 | 5 |
| Table 22. Growth rates (kg/ha/day) for annual grass, clover in Central West Slopes, NSW | ||||||||||||
| Growth rates (kg/ha/day) | ||||||||||||
| J | F | M | A | M | J | J | A | S | O | N | D | |
| Annual grass, clover – Standard year, Fertilised | 5 | 3 | 1 | 6 | 16 | 18 | 12 | 12 | 23 | 42 | 10 | 5 |
| Annual grass, clover – Good year, Fertilised | 10 | 6 | 2 | 12 | 32 | 31 | 20 | 20 | 39 | 71 | 17 | 10 |
| Annual grass, clover – Poor year, Fertilised | 1 | 1 | 0 | 2 | 6 | 7 | 5 | 2 | 5 | 8 | 2 | 1 |
| Table 23. Growth rates (kg/ha/day) for tropical grass in Central West Slopes, NSW | ||||||||||||
| Growth rates (kg/ha/day) | ||||||||||||
| J | F | M | A | M | J | J | A | S | O | N | D | |
| Tropical grass – Standard year, Fertilised | 35 | 34 | 24 | 8 | 3 | 2 | 2 | 2 | 2 | 8 | 24 | 35 |
| Tropical grass – Good year, Fertilised | 70 | 68 | 48 | 16 | 6 | 3 | 3 | 3 | 3 | 14 | 41 | 70 |
| Tropical grass – Poor year, Fertilised | 7 | 14 | 10 | 3 | 1 | 1 | 1 | 0 | 0 | 2 | 5 | 7 |
South West Slopes
|
|
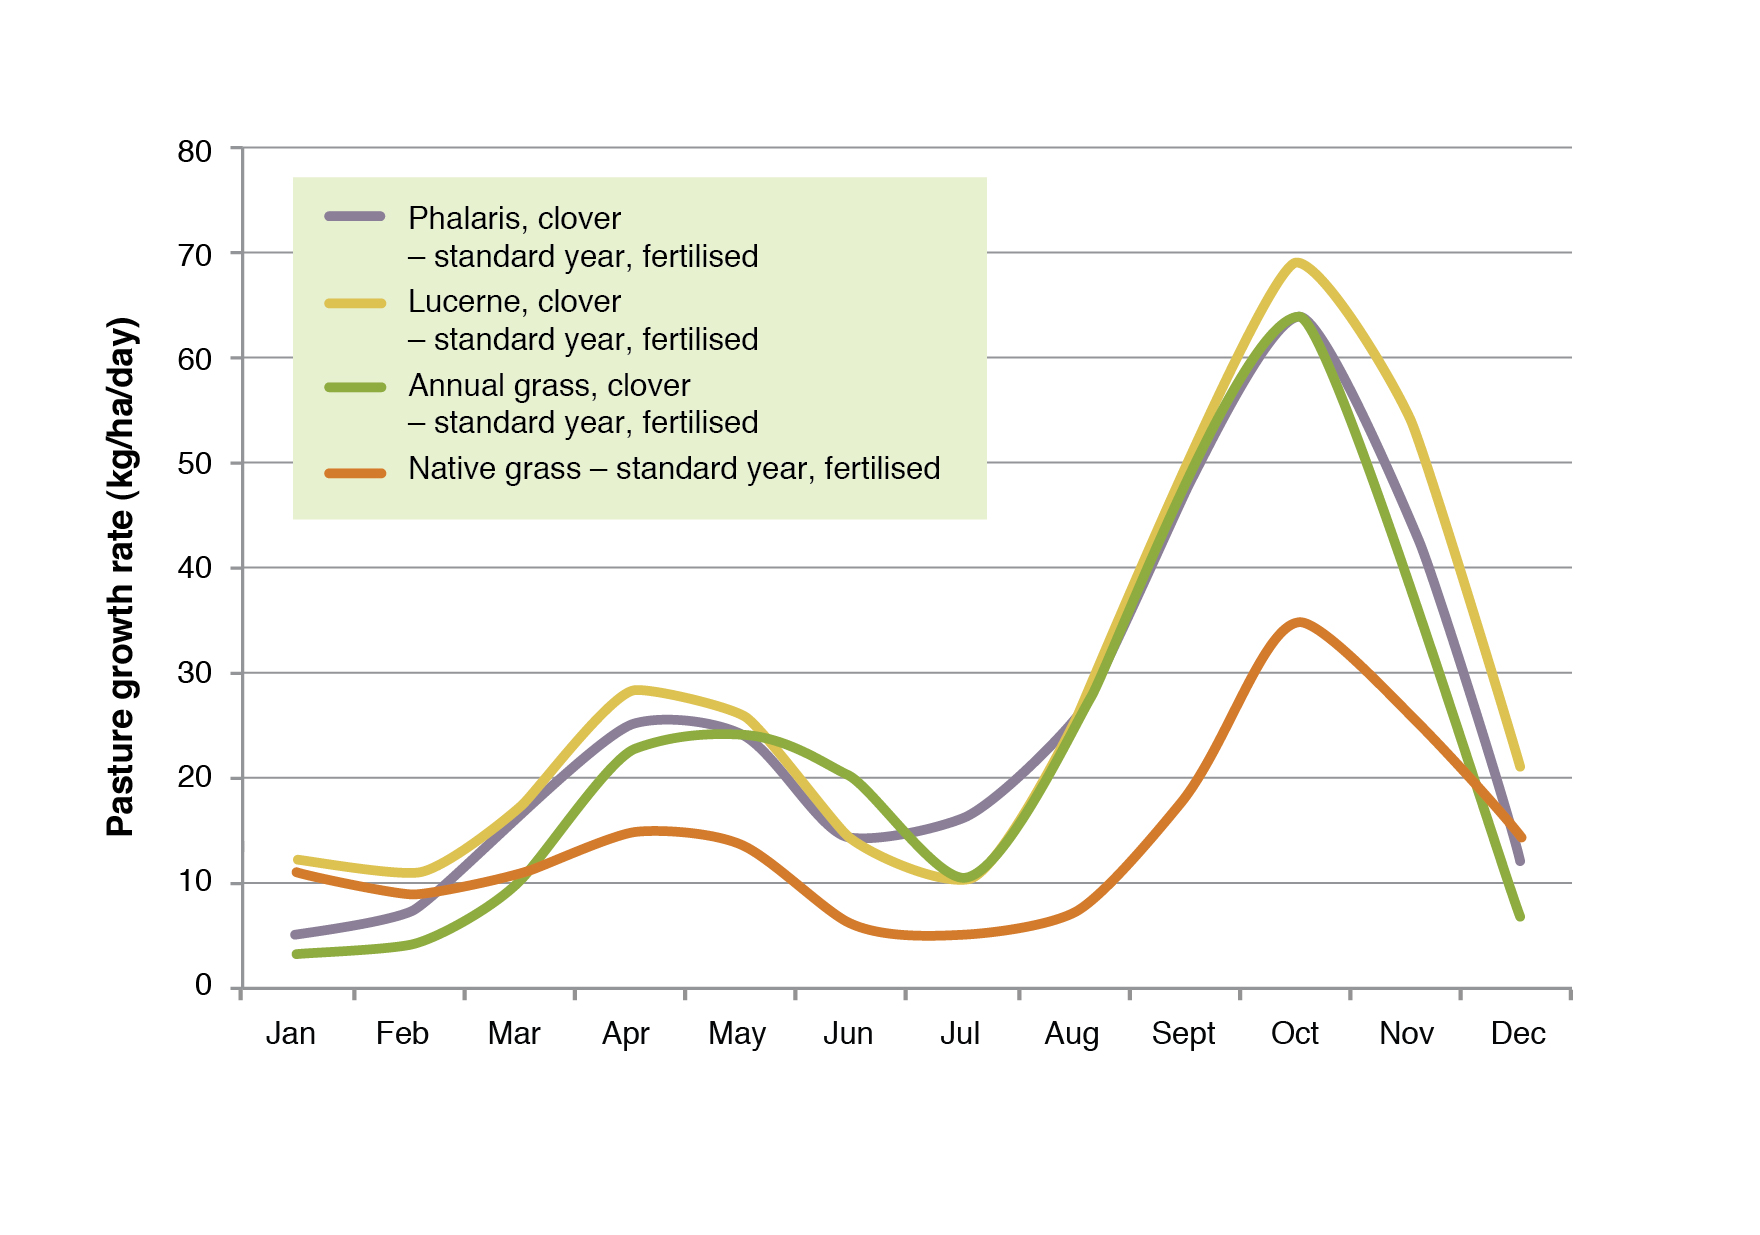
Table 24. Growth rates (kg/ha/day) for phalaris, clover in South West Slopes, NSW
| Growth rates (kg/ha/day) | ||||||||||||
| J | F | M | A | M | J | J | A | S | O | N | D | |
| Phalaris, clover – Standard year, Fertilised | 5 | 7 | 16 | 25 | 24 | 14 | 16 | 26 | 47 | 64 | 43 | 12 |
| Phalaris, clover – Good year, Fertilised | 15 | 21 | 21 | 33 | 31 | 25 | 29 | 47 | 61 | 83 | 56 | 36 |
| Phalaris,clover – Poor year, Fertilised | 2 | 2 | 6 | 10 | 10 | 11 | 13 | 21 | 19 | 26 | 17 | 4 |
| Table 25. Growth rates (kg/ha/day) for cocksfoot, clover in South West Slopes, NSW | ||||||||||||
| Growth rates (kg/ha/day) | ||||||||||||
| J | F | M | A | M | J | J | A | S | O | N | D | |
| Cocksfoot, clover – Standard year, Fertilised | 9 | 8 | 16 | 25 | 24 | 14 | 16 | 26 | 47 | 64 | 43 | 15 |
| Cocksfoot, clover – Good year, Fertilised | 27 | 24 | 21 | 33 | 31 | 25 | 29 | 47 | 61 | 83 | 56 | 45 |
| Cocksfoot, clover – Poor year, Fertilised | 3 | 2 | 6 | 10 | 10 | 11 | 13 | 21 | 19 | 26 | 17 | 5 |
| Table 26. Growth rates (kg/ha/day) for lucerne, clover in South West Slopes, NSW | ||||||||||||
| Growth rates (kg/ha/day) | ||||||||||||
| J | F | M | A | M | J | J | A | S | O | N | D | |
| Lucerne, clover – Standard year, Fertilised | 12 | 10 | 17 | 28 | 26 | 14 | 11 | 25 | 49 | 69 | 54 | 21 |
| Lucerne, clover – Good year, Fertilised | 36 | 30 | 22 | 36 | 34 | 25 | 20 | 45 | 64 | 90 | 70 | 63 |
| Lucerne, clover – Poor year, Fertilised | 4 | 3 | 7 | 11 | 10 | 11 | 9 | 20 | 20 | 28 | 22 | 6 |
| Table 27. Growth rates (kg/ha/day) for annual grass, clover in South West Slopes, NSW | ||||||||||||
| Growth rates (kg/ha/day) | ||||||||||||
| J | F | M | A | M | J | J | A | S | O | N | D | |
| Annual grass, clover – Standard year, Fertilised | 3 | 4 | 10 | 23 | 24 | 20 | 10 | 25 | 45 | 64 | 35 | 7 |
| Annual grass, clover – Good year, Fertilised | 9 | 12 | 13 | 30 | 31 | 36 | 18 | 45 | 59 | 83 | 46 | 21 |
| Annual grass, clover – Poor year, Fertilised | 1 | 1 | 4 | 9 | 10 | 16 | 8 | 20 | 18 | 26 | 14 | 2 |
| Table 28. Growth rates (kg/ha/day) for native grass in South West Slopes, NSW | ||||||||||||
| Growth rates (kg/ha/day) | ||||||||||||
| J | F | M | A | M | J | J | A | S | O | N | D | |
| Native grass – Standard year, Not fertilised | 8 | 6 | 5 | 11 | 10 | 4 | 3 | 3 | 7 | 15 | 23 | 13 |
| Native grass – Good year, Not fertilised | 20 | 15 | 5 | 12 | 11 | 6 | 4 | 4 | 8 | 16 | 25 | 32 |
| Native grass – Poor year, Not fertilised | 4 | 3 | 3 | 7 | 6 | 5 | 4 | 4 | 5 | 10 | 15 | 6 |
| Native grass – Standard year, Fertilised | 11 | 9 | 11 | 15 | 14 | 6 | 5 | 7 | 17 | 35 | 26 | 14 |
| Native grass – Good year, Fertilised | 33 | 27 | 14 | 20 | 18 | 11 | 9 | 13 | 22 | 46 | 34 | 42 |
| Native grass – Poor year, Fertilised | 3 | 3 | 4 | 6 | 6 | 5 | 4 | 6 | 7 | 14 | 10 | 4 |
North Coast
Table 29. Growth rates (kg/ha/day) for naturalised carpet grass in North Coast, NSW
| Growth rates (kg/ha/day) | ||||||||||||
| J | F | M | A | M | J | J | A | S | O | N | D | |
| Naturalised carpet grass, No fertiliser – Standard year | 25 | 30 | 25 | 10 | 3 | 0 | 0 | 0 | 3 | 5 | 9 | 15 |
| Naturalised carpet grass, No fertiliser – Good year | 40 | 72 | 60 | 24 | 9 | 0 | 0 | 0 | 5 | 9 | 15 | 24 |
| Naturalised carpet grass, No fertiliser – Poor year | 10 | 12 | 3 | 1 | 0 | 0 | 0 | 0 | 1 | 2 | 4 | 6 |
| Naturalised carpet grass, clover, Fertiliser – Standard year | 30 | 35 | 30 | 15 | 8 | 6 | 5 | 6 | 10 | 15 | 20 | 25 |
| Naturalised carpet grass, clover, Fertiliser- Good year | 48 | 84 | 72 | 36 | 24 | 18 | 15 | 18 | 17 | 26 | 34 | 40 |
| Naturalised carpet grass, clover, Fertiliser – Poor year | 12 | 14 | 3 | 2 | 1 | 2 | 2 | 2 | 4 | 6 | 8 | 10 |
| Table 30. Growth rates (kg/ha/day) for kikuyu in North Coast, NSW | ||||||||||||
| Growth rates (kg/ha/day) | ||||||||||||
| J | F | M | A | M | J | J | A | S | O | N | D | |
| Kikuyu – Standard year | 34 | 54 | 50 | 30 | 16 | 10 | 3 | 2 | 8 | 18 | 25 | 30 |
| Kikuyu – Good year | 54 | 130 | 120 | 72 | 48 | 30 | 9 | 6 | 14 | 31 | 43 | 48 |
| Kikuyu – Poor year | 14 | 22 | 5 | 3 | 2 | 3 | 1 | 1 | 3 | 7 | 10 | 12 |
| Table 31. Growth rates (kg/ha/day) for kikuyu with nitrogen fertiliser in North Coast, NSW | ||||||||||||
| Growth rates (kg/ha/day) | ||||||||||||
| J | F | M | A | M | J | J | A | S | O | N | D | |
| Kikuyu, N fertiliser – Standard year | 80 | 128 | 146 | 100 | 45 | 15 | 3 | 4 | 14 | 30 | 40 | 60 |
| Kikuyu, N fertiliser – Good year | 80 | 128 | 146 | 100 | 45 | 27 | 5 | 7 | 17 | 36 | 48 | 68 |
| Kikuyu, N fertiliser – Poor year | 59 | 94 | 27 | 18 | 8 | 8 | 2 | 2 | 10 | 22 | 29 | 44 |
| Table 32. Growth rates (kg/ha/day) for setaria, rhodes grass,clover in North Coast, NSW | ||||||||||||
| Growth rates (kg/ha/day) | ||||||||||||
| J | F | M | A | M | J | J | A | S | O | N | D | |
| Setaria, rhodes grass, clover – Standard year | 30 | 55 | 45 | 25 | 6 | 2 | 2 | 4 | 8 | 20 | 28 | 30 |
| Setaria, rhodes grass, clover – Good year | 48 | 132 | 108 | 60 | 18 | 6 | 6 | 12 | 14 | 34 | 48 | 48 |
| Setaria, rhodes grass, clover – Poor year | 12 | 22 | 5 | 3 | 1 | 1 | 1 | 1 | 3 | 8 | 11 | 12 |
| Table 33. Growth rates (kg/ha/day) for annual ryegrass with nitrogen fertiliser in North Coast, NSW | ||||||||||||
| Growth rates (kg/ha/day) | ||||||||||||
| J | F | M | A | M | J | J | A | S | O | N | D | |
| Annual ryegrass, N fertiliser – Standard year | 0 | 0 | 0 | 30 | 40 | 30 | 30 | 30 | 28 | 10 | 8 | 5 |
| Annual ryegrass, N fertiliser – Good year | 0 | 0 | 0 | 47 | 63 | 53 | 53 | 53 | 34 | 12 | 10 | 6 |
| Annual ryegrass, N fertiliser – Poor year | 0 | 0 | 0 | 6 | 7 | 17 | 17 | 17 | 21 | 7 | 6 | 4 |
Mid North Coast and Lower Hunter
Table 34. Growth rates (kg/ha/day) for naturalised carpet grass in Mid North Coast and Lower Hunter, NSW
| Growth rates (kg/ha/day) | ||||||||||||
| J | F | M | A | M | J | J | A | S | O | N | D | |
| Naturalised carpet grass- Standard year, No fertiliser | 17 | 25 | 23 | 9 | 2 | 0 | 0 | 0 | 2 | 4 | 8 | 9 |
| Naturalised carpet grass – Good year, No fertiliser | 37 | 55 | 39 | 15 | 3 | 0 | 0 | 0 | 6 | 12 | 23 | 20 |
| Naturalised carpet grass – Poor year, No fertiliser | 9 | 14 | 5 | 2 | 0 | 0 | 0 | 0 | 1 | 1 | 2 | 5 |
| Naturalised carpet grass, clover, Fertiliser – Standard year | 20 | 29 | 27 | 12 | 4 | 3 | 3 | 3 | 6 | 10 | 12 | 12 |
| Naturalised carpet grass, clover, Fertiliser – Good year | 44 | 64 | 46 | 20 | 7 | 6 | 6 | 6 | 17 | 29 | 35 | 26 |
| Naturalised carpet grass, clover, Fertiliser – Poor year | 11 | 16 | 5 | 2 | 1 | 1 | 1 | 1 | 2 | 3 | 4 | 6 |
| Table 35. Growth rates (kg/ha/day) for kikuyu in Mid North Coast and Lower Hunter, NSW | ||||||||||||
| Growth rates (kg/ha/day) | ||||||||||||
| J | F | M | A | M | J | J | A | S | O | N | D | |
| Kikuyu – Standard year | 27 | 45 | 50 | 33 | 16 | 6 | 2 | 3 | 11 | 10 | 10 | 12 |
| Kikuyu – Good year | 59 | 99 | 85 | 56 | 27 | 11 | 4 | 6 | 32 | 29 | 29 | 26 |
| Kikuyu – Poor year | 15 | 24 | 10 | 7 | 3 | 2 | 1 | 1 | 3 | 3 | 3 | 6 |
| Table 36. Growth rates (kg/ha/day) for paspalum in Mid North Coast and Lower Hunter, NSW | ||||||||||||
| Growth rates (kg/ha/day) | ||||||||||||
| J | F | M | A | M | J | J | A | S | O | N | D | |
| Paspalum – Standard year | 23 | 33 | 32 | 16 | 5 | 5 | 5 | 5 | 10 | 15 | 15 | 15 |
| Paspalum dominant – Good year | 51 | 73 | 54 | 27 | 9 | 9 | 9 | 9 | 29 | 44 | 44 | 33 |
| Paspalum – Poor year | 12 | 18 | 6 | 3 | 1 | 2 | 2 | 2 | 3 | 5 | 5 | 8 |
| Table 37. Growth rates (kg/ha/day) for setaria in Mid North Coast and Lower Hunter, NSW | ||||||||||||
| Growth rates (kg/ha/day) | ||||||||||||
| J | F | M | A | M | J | J | A | S | O | N | D | |
| Setaria – Standard year | 29 | 38 | 44 | 23 | 8 | 5 | 5 | 5 | 10 | 11 | 11 | 13 |
| Setaria – Good year | 64 | 84 | 75 | 39 | 14 | 9 | 9 | 9 | 29 | 32 | 32 | 29 |
| Setaria – Poor year | 16 | 21 | 9 | 5 | 2 | 2 | 2 | 2 | 3 | 3 | 3 | 7 |
| Table 38. Growth rates (kg/ha/day) for annual ryegrass with nitrogen fertiliser in Mid North Coast and Lower Hunter, NSW | ||||||||||||
| Growth rates (kg/ha/day) | ||||||||||||
| J | F | M | A | M | J | J | A | S | O | N | D | |
| Annual ryegrass, N fertiliser – Standard year | 0 | 0 | 0 | 5 | 20 | 36 | 35 | 40 | 40 | 25 | 0 | 0 |
| Annual Ryegrass, N fertiliser – Good year | 0 | 0 | 0 | 9 | 34 | 67 | 65 | 74 | 116 | 73 | 0 | 0 |
| Annual ryegrass, N fertiliser – Poor year | 0 | 0 | 0 | 1 | 4 | 12 | 12 | 13 | 12 | 8 | 0 | 0 |
Victoria
South West Lower (Hamilton)
|
|
Average, minimum and maximum pasture growth curves are also available for semi-winter active lucerne (SARDI Seven), chicory (Puna), summer active tall fescue (Quantum) and various ryegrass species (Avalon, Banquet and Fitzroy) at Hamilton Proof Site.
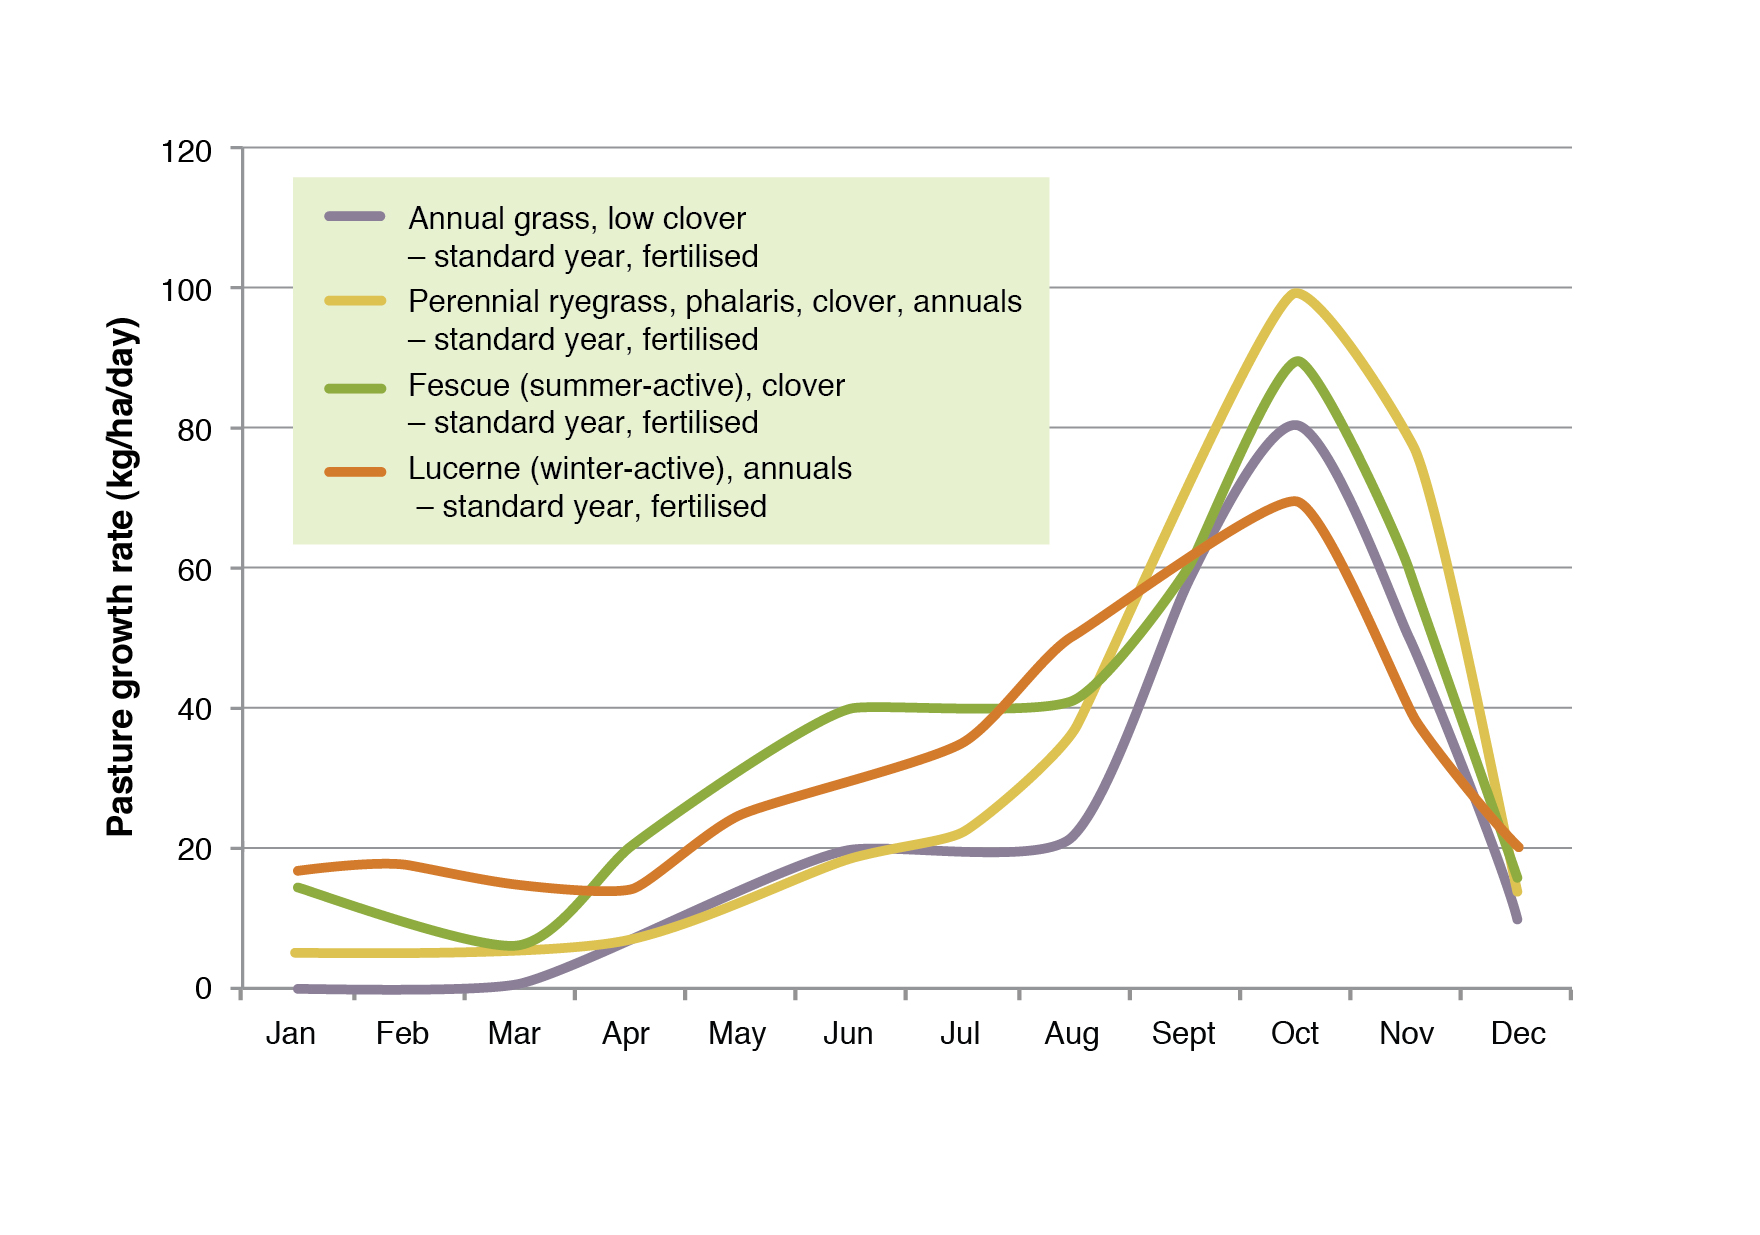
Table 39. Growth rates (kg/ha/day) for annual grass, low clover with fertliser in South West Victoria (Hamilton)
| Growth rates (kg/ha/day) | ||||||||||||
| J | F | M | A | M | J | J | A | S | O | N | D | |
| Annual grass, low clover, Fertiliser – Poor year | 2 | 0 | 0 | 5 | 10 | 12 | 15 | 18 | 40 | 50 | 20 | 0 |
| Annual grass, low clover, Fertiliser – Standard year | 0 | 0 | 0 | 7 | 14 | 20 | 20 | 20 | 58 | 81 | 50 | 10 |
| Annual grass, low clover, Fertiliser – Good year | 0 | 0 | 2 | 10 | 20 | 25 | 25 | 30 | 60 | 80 | 50 | 10 |
| Table 40. Growth rates (kg/ha/day) for perennial ryegrass, phalaris, clover and annuals with fertiliser in South West Victoria (Hamilton) | ||||||||||||
| Growth rates (kg/ha/day) | ||||||||||||
| J | F | M | A | M | J | J | A | S | O | N | D | |
| Per. ryegrass, phalaris, clover, annuals, Fert – Poor year | 2 | 0 | 0 | 5 | 8 | 15 | 17 | 22 | 50 | 70 | 33 | 5 |
| Per. ryegrass, phalaris, clover, annuals, Fert. – Stnd year | 5 | 5 | 5 | 7 | 14 | 19 | 22 | 37 | 69 | 100 | 78 | 14 |
| Per. ryegrass, phalaris, clover, Fert – Good year | 10 | 5 | 10 | 20 | 25 | 30 | 32 | 40 | 70 | 120 | 90 | 30 |
| Sum active perennial rye, clover, Fert – Stnd year | 10 | 10 | 5 | 13 | 20 | 30 | 25 | 40 | 50 | 75 | 60 | 25 |
| Table 41. Growth rates (kg/ha/day) for fescue summer active clover with fertiliser in South West Victoria (Hamilton) | ||||||||||||
| Growth rates (kg/ha/day) | ||||||||||||
| J | F | M | A | M | J | J | A | S | O | N | D | |
| Fescue summer active, clover, Fert – Stnd year | 15 | 10 | 5 | 20 | 30 | 40 | 40 | 40 | 60 | 90 | 60 | 15 |
| Table 42. Growth rates (kg/ha/day) for chicory, clover and annuals with fertiliser in South West Victoria (Hamilton) | ||||||||||||
| Growth rates (kg/ha/day) | ||||||||||||
| J | F | M | A | M | J | J | A | S | O | N | D | |
| Chicory, clover, annuals, Fertiliser – Stnd year | 9 | 8 | 17 | 15 | 22 | 29 | 22 | 46 | 60 | 50 | 30 | 20 |
| Table 43. Growth rates (kg/ha/day) for winter active lucerne and annuals with fertiliser in South West Victoria (Hamilton) | ||||||||||||
| Growth rates (kg/ha/day) | ||||||||||||
| J | F | M | A | M | J | J | A | S | O | N | D | |
| Lucerne winter active, annuals, Fert – Poor year | 9 | 9 | 8 | 7 | 13 | 23 | 26 | 38 | 45 | 53 | 20 | 10 |
| Lucerne winter active, annuals, Fert – Stnd year | 17 | 18 | 15 | 14 | 25 | 30 | 35 | 50 | 60 | 70 | 40 | 20 |
| Lucerne winter active, annuals, Fert – Good year | 26 | 27 | 23 | 21 | 38 | 38 | 44 | 63 | 75 | 88 | 60 | 30 |
South West Lower (Lismore)
Table 44. Growth rates (kg/ha/day) for perennial ryegrass, phalaris and clover with fertiliser in South West Lower, Victoria (Lismore)
| Growth rates (kg/ha/day) | ||||||||||||
| J | F | M | A | M | J | J | A | S | O | N | D | |
| Per ryegrass, phalaris, clover, Fert – Poor year | 0 | 0 | 0 | 4 | 11 | 14 | 14 | 28 | 42 | 56 | 42 | 4 |
| Per ryegrass, phalaris, clover, Fert – Stnd year | 0 | 0 | 0 | 5 | 15 | 20 | 20 | 40 | 60 | 80 | 60 | 5 |
| Per ryegrass, phalaris, clover, Fert – Good year | 5 | 5 | 10 | 20 | 20 | 25 | 30 | 50 | 70 | 100 | 70 | 50 |
| Table 45. Growth rates (kg/ha/day) for low clover, onion grass and annuals with fertiliser in South West Lower, Victoria (Lismore) | ||||||||||||
| Growth rates (kg/ha/day) | ||||||||||||
| J | F | M | A | M | J | J | A | S | O | N | D | |
| Annuals, onion grass, low clover, Fert – Poor Year | 0 | 0 | 0 | 3 | 5 | 10 | 12 | 18 | 39 | 49 | 32 | 0 |
| Annuals, onion grass, low clover, Fert, Stnd year | 0 | 0 | 0 | 5 | 15 | 20 | 20 | 25 | 55 | 70 | 45 | 0 |
| Annuals, onion grass, low clover, Fert – Good Year | 0 | 0 | 0 | 10 | 20 | 25 | 25 | 30 | 60 | 75 | 55 | 10 |
South West Upper (Balmoral)
Table 46. Growth rates (kg/ha/day) for perennial ryegrass, phalaris and clover with fertiliser in South West Upper, Victoria (Balmoral)
| Growth rates (kg/ha/day) | ||||||||||||
| J | F | M | A | M | J | J | A | S | O | N | D | |
| Per ryegrass, phalaris, clover, Fert – Poor year | 0 | 0 | 0 | 4 | 8 | 11 | 13 | 25 | 39 | 49 | 42 | 4 |
| Per ryegrass, phalaris, clover, Fert – Stnd year | 0 | 0 | 0 | 6 | 12 | 16 | 18 | 35 | 55 | 70 | 60 | 5 |
| Per ryegrass, phalaris, clover, Fert – Good year | 0 | 0 | 5 | 20 | 20 | 25 | 25 | 40 | 65 | 100 | 70 | 30 |
| Table 47. Growth rates (kg/ha/day) for annuals, onion grass, low clover with fertiliser in South West Upper, Victoria (Balmoral) | ||||||||||||
| Growth rates (kg/ha/day) | ||||||||||||
| J | F | M | A | M | J | J | A | S | O | N | D | |
| Annuals, onion grass, low clover, Fert – Poor Year | 0 | 0 | 0 | 6 | 11 | 14 | 11 | 21 | 28 | 35 | 32 | 1 |
| Annuals, onion grass, low clover, Fert – Stnd year | 0 | 0 | 0 | 8 | 15 | 20 | 15 | 30 | 40 | 50 | 45 | 2 |
| Annuals, onion grass, low clover, Fert – Good Year | 0 | 0 | 5 | 15 | 20 | 20 | 20 | 35 | 45 | 70 | 50 | 10 |
| Table 48. Growth rates (kg/ha/day) for lucerne in South West Upper, Victoria (Balmoral) | ||||||||||||
| Growth rates (kg/ha/day) | ||||||||||||
| J | F | M | A | M | J | J | A | S | O | N | D | |
| Lucerne – Standard year | 10 | 10 | 9 | 16 | 16 | 13 | 12 | 17 | 32 | 41 | 33 | 20 |
| Lucerne – Poor year | 10 | 6 | 5 | 9 | 14 | 12 | 10 | 14 | 31 | 38 | 21 | 5 |
| Lucerne – Good year | 10 | 3 | 11 | 20 | 19 | 16 | 14 | 21 | 32 | 52 | 74 | 27 |
South West Upper (Edenhope)
Table 49. Growth rates (kg/ha/day) for perennial ryegrass, phalaris and clover with fertiliser in South West Upper, Victoria (Edenhope)
| Growth rates (kg/ha/day) | ||||||||||||
| J | F | M | A | M | J | J | A | S | O | N | D | |
| Per ryegrass, phalaris, clover, Fert – Poor year | 0 | 0 | 0 | 1 | 4 | 14 | 14 | 21 | 35 | 56 | 35 | 0 |
| Per ryegrass, phalaris, clover, Fert – Stnd year | 0 | 0 | 0 | 1 | 6 | 20 | 20 | 30 | 50 | 80 | 50 | 0 |
| Per ryegrass, phalaris, clover, Fert – Good year | 0 | 0 | 0 | 12 | 20 | 25 | 25 | 40 | 70 | 100 | 70 | 30 |
| Table 50. Growth rates (kg/ha/day) for annuals, onion grass and low clover with fertiliser in South West Upper, Victoria (Edenhope) | ||||||||||||
| Growth rates (kg/ha/day) | ||||||||||||
| J | F | M | A | M | J | J | A | S | O | N | D | |
| Annuals, onion grass, low clover, Fert – Poor Year | 0 | 0 | 0 | 0 | 4 | 14 | 14 | 14 | 21 | 42 | 32 | 0 |
| Annuals, onion grass, low clover, Fert – Stnd year | 0 | 0 | 0 | 0 | 5 | 20 | 20 | 20 | 30 | 60 | 45 | 0 |
| Annuals, onion grass, low clover, Fert – Good Year | 0 | 0 | 0 | 5 | 20 | 25 | 25 | 30 | 50 | 80 | 50 | 20 |
South West Upper (Ballarat)
Table 51. Growth rates (kg/ha/day) for various species in South West Upper, Victoria (Ballarat)
| Growth rates (kg/ha/day) | ||||||||||||
| J | F | M | A | M | J | J | A | S | O | N | D | |
| Perennial grass, clover pasture, Fert – Stnd year | 0 | 0 | 15 | 20 | 30 | 20 | 20 | 35 | 50 | 90 | 80 | 70 |
| Bent grass, No fertiliser – Standard year | 10 | 10 | 5 | 5 | 5 | 5 | 5 | 20 | 40 | 60 | 40 | 30 |
South West Upper (Ararat)
Table 52. Growth rates (kg/ha/day) for perennial ryegrass, phalaris and clover with fertiliser in South West Upper, Victoria (Ararat)
| Growth rates (kg/ha/day) | ||||||||||||
| J | F | M | A | M | J | J | A | S | O | N | D | |
| Per ryegrass, phalaris, clover, Fert – Poor year | 0 | 0 | 0 | 4 | 7 | 7 | 11 | 21 | 35 | 56 | 14 | 0 |
| Per ryegrass, phalaris, clover, Fert – Stnd year | 0 | 0 | 0 | 5 | 10 | 10 | 15 | 30 | 50 | 80 | 20 | 0 |
| Per ryegrass, phalaris, clover, Fert – Good year | 0 | 0 | 5 | 15 | 20 | 30 | 40 | 50 | 70 | 100 | 50 | 10 |
| Table 53. Growth rates (kg/ha/day) for annuals, onion grass and low clover with fertiliser in South West Upper, Victoria (Ararat) | ||||||||||||
| Growth rates (kg/ha/day) | ||||||||||||
| J | F | M | A | M | J | J | A | S | O | N | D | |
| Annuals, onion grass, low clover, Fert – Poor Year | 0 | 0 | 0 | 1 | 7 | 7 | 11 | 18 | 25 | 32 | 14 | 0 |
| Annuals, onion grass, low clover, Fert – Stnd year | 0 | 0 | 0 | 2 | 10 | 10 | 15 | 25 | 35 | 45 | 20 | 0 |
| Annuals, onion grass, low clover, Fert – Good Year | 0 | 0 | 5 | 10 | 20 | 20 | 30 | 40 | 50 | 60 | 30 | 5 |
| Table 54. Growth rates (kg/ha/day) for Danthonia, annuals and low clover with no fertiliser in South West Upper, Victoria (Ararat) | ||||||||||||
| Growth rates (kg/ha/day) | ||||||||||||
| J | F | M | A | M | J | J | A | S | O | N | D | |
| Danthonia, annuals, low clover, no fert – Stnd year | 5 | 3 | 3 | 4 | 5 | 7 | 7 | 10 | 17 | 30 | 17 | 8 |
South West Upper (Maryborough)
Table 55. Growth rates (kg/ha/day) for lucerne and annuals with fertiliser in South West Upper, Victoria (Maryborough)
| Growth rates (kg/ha/day) | ||||||||||||
| J | F | M | A | M | J | J | A | S | O | N | D | |
| Lucerne, annual grasses, Fert – Standard year | 5 | 5 | 2 | 5 | 10 | 12 | 15 | 30 | 55 | 70 | 30 | 5 |
| Table 56. Growth rates (kg/ha/day) for phalaris and clover in South West Upper, Victoria (Maryborough) | ||||||||||||
| Growth rates (kg/ha/day) | ||||||||||||
| J | F | M | A | M | J | J | A | S | O | N | D | |
| Phalaris, clover – Poor year | 0 | 0 | 0 | 5 | 10 | 10 | 10 | 16 | 29 | 40 | 15 | 0 |
| Phalaris, clover – Standard year | 0 | 0 | 5 | 10 | 20 | 19 | 15 | 20 | 27 | 50 | 20 | 10 |
| Phalaris, clover – Good year | 0 | 5 | 10 | 20 | 30 | 20 | 25 | 15 | 29 | 70 | 40 | 20 |
| Table 57. Growth rates (kg/ha/day) for annuals in South West Upper, Victoria (Maryborough) | ||||||||||||
| Growth rates (kg/ha/day) | ||||||||||||
| J | F | M | A | M | J | J | A | S | O | N | D | |
| Annual grass – Standard year | 0 | 0 | 0 | 5 | 10 | 20 | 25 | 30 | 60 | 40 | 20 | 0 |
| Annual grass – Poor year | 0 | 0 | 0 | 0 | 10 | 13 | 10 | 20 | 40 | 30 | 0 | 0 |
| Annual grass – Good year | 0 | 0 | 0 | 10 | 15 | 30 | 40 | 40 | 80 | 60 | 40 | 10 |
North West Victoria (Boort)
Table 58. Growth rates (kg/ha/day) for various species in North West Victoria (Boort)
| Growth rates (kg/ha/day) | ||||||||||||
| J | F | M | A | M | J | J | A | S | O | N | D | |
| Lucerne, annuals, weeds, Fertiliser – Stnd year | 0 | 0 | 0 | 5 | 10 | 15 | 15 | 30 | 45 | 20 | 10 | 0 |
| Phalaris, annuals, clover, weeds, Fert – Stnd year | 0 | 2 | 2 | 5 | 10 | 15 | 17 | 32 | 60 | 35 | 15 | 0 |
North East Vic (Seymour)
|
|
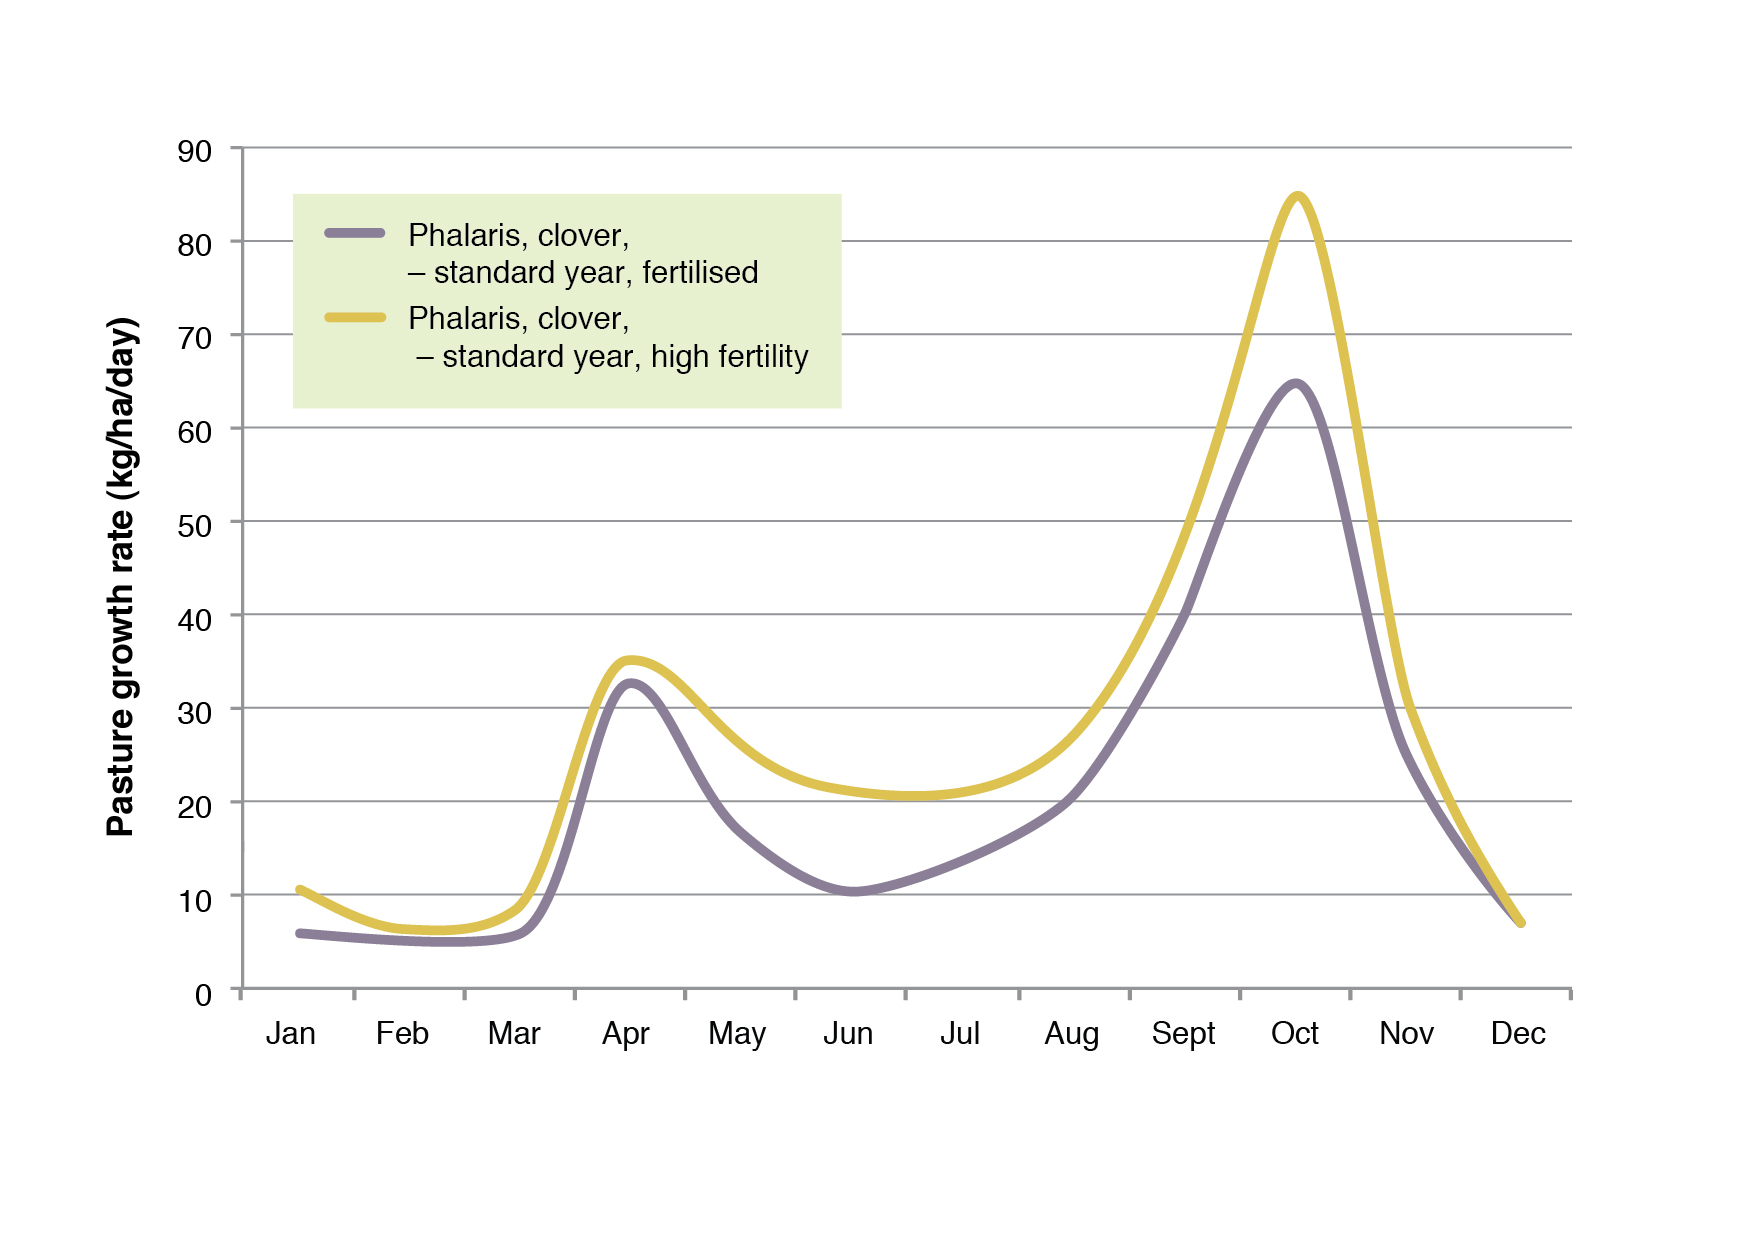
Table 59. Growth rates (kg/ha/day) for phalaris and clover with fertiliser in North East Victoria (Seymour)
| Growth rates (kg/ha/day) | ||||||||||||
| J | F | M | A | M | J | J | A | S | O | N | D | |
| Phalaris, clover, Fertilised – Standard year | 6 | 5 | 5 | 33 | 17 | 10 | 15 | 20 | 40 | 65 | 25 | 7 |
| Phalaris, clover, Fertilised – Good year | 10 | 10 | 15 | 40 | 30 | 14 | 20 | 30 | 50 | 90 | 50 | 15 |
| Phalaris, clover, Fertilised – Poor year | 0 | 0 | 0 | 10 | 10 | 7 | 7 | 10 | 15 | 50 | 10 | 0 |
| Table 60. Growth rates (kg/ha/day) for phalaris and clover with high fertility in North East Victoria (Seymour) | ||||||||||||
| Growth rates (kg/ha/day) | ||||||||||||
| J | F | M | A | M | J | J | A | S | O | N | D | |
| Phalaris, clover, High fertility – Standard year | 10 | 6 | 8 | 35 | 25 | 20 | 20 | 25 | 50 | 85 | 30 | 7 |
| Phalaris, clover, High fertlity – Good year | 15 | 20 | 20 | 50 | 30 | 30 | 30 | 50 | 70 | 100 | 50 | 15 |
| Phalaris, clover, High fertility – Poor year | 0 | 0 | 0 | 20 | 10 | 10 | 13 | 10 | 15 | 70 | 15 | 0 |
North East Vic (Bonnie Doon)
|
|
Table 61. Growth rates (kg/ha/day) for lucerne with fertiliser in North East Victoria (Bonnie Doon)
| Growth rates (kg/ha/day) | ||||||||||||
| J | F | M | A | M | J | J | A | S | O | N | D | |
| Lucerne – Poor year, Fertilised | 10 | 13 | 11 | 11 | 11 | 10 | 5 | 9 | 23 | 22 | 14 | 7 |
| Lucerne – Standard year, Fertilised | 14 | 12 | 8 | 15 | 14 | 10 | 10 | 10 | 29 | 44 | 26 | 16 |
| Lucerne – Good year, Fertilised | 20 | 15 | 17 | 17 | 18 | 20 | 20 | 20 | 31 | 52 | 49 | 29 |
| Table 62. Growth rates (kg/ha/day) for perennial ryegrass with fertiliser in North East Victoria (Bonnie Doon) | ||||||||||||
| Growth rates (kg/ha/day) | ||||||||||||
| J | F | M | A | M | J | J | A | S | O | N | D | |
| Perennial rye – Poor year, Fertilised | 0 | 0 | 3 | 20 | 36 | 28 | 20 | 28 | 40 | 23 | 7 | 3 |
| Perennial rye – Standard year, Fertilised | 3 | 3 | 7 | 27 | 32 | 28 | 19 | 29 | 43 | 49 | 40 | 8 |
| Perennial rye – Good year, fertilised | 2 | 0 | 8 | 21 | 38 | 26 | 20 | 33 | 45 | 49 | 68 | 36 |
| Table 63. Growth rates (kg/ha/day) for winter active phalaris and clover with fertiliser in North East Victoria (Bonnie Doon) | ||||||||||||
| Growth rates (kg/ha/day) | ||||||||||||
| J | F | M | A | M | J | J | A | S | O | N | D | |
| Phalaris winter active, clover, Fert – Poor year | 0 | 0 | 5 | 5 | 10 | 10 | 10 | 15 | 30 | 50 | 20 | 0 |
| Phalaris winter active, clover, Fert – Stnd year | 5 | 5 | 10 | 30 | 30 | 20 | 20 | 30 | 40 | 80 | 30 | 10 |
| Phalaris winter active, clover, Fert – Good year | 10 | 10 | 20 | 30 | 30 | 25 | 25 | 30 | 50 | 85 | 50 | 20 |
| Table 64. Growth rates (kg/ha/day) for annual grass and weeds with no fertiliser in North East Victoria (Bonnie Doon) | ||||||||||||
| Growth rates (kg/ha/day) | ||||||||||||
| J | F | M | A | M | J | J | A | S | O | N | D | |
| Annual grass & weeds, No fertiliser – Stnd year | 0 | 0 | 5 | 25 | 20 | 15 | 15 | 20 | 30 | 50 | 5 | 0 |
| Annual grass & weeds, No Fertiliser – Poor year | 0 | 0 | 0 | 0 | 10 | 15 | 15 | 20 | 30 | 20 | 0 | 0 |
| Annual grass & weeds No fertiliser – Good year | 0 | 0 | 10 | 30 | 20 | 20 | 20 | 30 | 40 | 60 | 10 | 0 |
| Table 65. Growth rates (kg/ha/day) for Danthonia, annuals and weeds with no fertiliser in North East Victoria (Bonnie Doon) | ||||||||||||
| Growth rates (kg/ha/day) | ||||||||||||
| J | F | M | A | M | J | J | A | S | O | N | D | |
| Danthonia, annuals, capeweed, No Fert – Poor year | 0 | 0 | 0 | 5 | 5 | 5 | 5 | 8 | 15 | 10 | 5 | 0 |
| Danthonia, annuals & weeds No Fert- Stnd year | 0 | 0 | 5 | 10 | 10 | 7 | 7 | 10 | 15 | 20 | 10 | 5 |
| Danthonia, annuals, capeweed No Fert – Good year | 5 | 5 | 10 | 15 | 10 | 7 | 10 | 10 | 15 | 25 | 15 | 5 |
| Table 66. Growth rates (kg/ha/day) for Microlaena, Danthonia and annual grass in North East Victoria (Bonnie Doon) | ||||||||||||
| Growth rates (kg/ha/day) | ||||||||||||
| J | F | M | A | M | J | J | A | S | O | N | D | |
| Microleana, danthonia, annual grass – Poor year | 0 | 0 | 0 | 5 | 5 | 3 | 3 | 6 | 10 | 20 | 10 | 5 |
| Microleana, danthonia, annuals – Standard year | 5 | 5 | 5 | 15 | 8 | 4 | 4 | 6 | 10 | 30 | 20 | 10 |
| Microleana, danthonia, annual grass – Good year | 10 | 10 | 10 | 15 | 10 | 4 | 4 | 6 | 10 | 30 | 20 | 10 |
West Gippsland (Ellinbank)
Table 67. Growth rates (kg/ha/day) for perennial ryegrass and clover with fertiliser in West Gippsland, Victoria (Ellinbank)
| Growth rates (kg/ha/day) | ||||||||||||
| J | F | M | A | M | J | J | A | S | O | N | D | |
| Perennial ryegrass, clover, Fertiliser – Standard year | 18 | 10 | 19 | 20 | 18 | 16 | 10 | 20 | 55 | 80 | 70 | 59 |
| Perennial ryegrass, clover, Fertiliser – Good year | 23 | 13 | 25 | 26 | 23 | 21 | 13 | 26 | 72 | 104 | 91 | 77 |
| Perennial ryegrass, clover, Fertiliser – Poor year | 13 | 7 | 13 | 14 | 13 | 11 | 7 | 14 | 39 | 56 | 49 | 41 |
| Table 68. Growth rates (kg/ha/day) for lucerne in West Gippsland, Victoria (Ellinbank) | ||||||||||||
| Growth rates (kg/ha/day) | ||||||||||||
| J | F | M | A | M | J | J | A | S | O | N | D | |
| Lucerne – Poor year | 42 | 24 | 25 | 27 | 18 | 11 | 8 | 12 | 27 | 37 | 47 | 54 |
| Lucerne – Standard year | 55 | 36 | 35 | 32 | 24 | 15 | 11 | 19 | 31 | 42 | 56 | 65 |
| Lucerne – Good year | 62 | 53 | 45 | 36 | 25 | 16 | 14 | 22 | 34 | 43 | 54 | 72 |
Central Gippsland (Maffra)
Table 69. Growth rates (kg/ha/day) for perennial ryegrass and clover with fertiliser in Central Gippsland, Victoria (Maffra)
| Growth rates (kg/ha/day) | ||||||||||||
| J | F | M | A | M | J | J | A | S | O | N | D | |
| Dryland perennial ryegrass, clover, Fert – Poor year | 4 | 4 | 0 | 14 | 12 | 7 | 1 | 11 | 21 | 27 | 21 | 1 |
| Dryland perennial ryegrass, clover, Fert – Stnd year | 5 | 5 | 0 | 20 | 17 | 10 | 2 | 15 | 30 | 38 | 30 | 2 |
| Dryland perennial ryegrass, clover, Fert – Good Year | 7 | 7 | 0 | 26 | 22 | 13 | 3 | 20 | 39 | 49 | 39 | 3 |
| Table 70. Growth rates (kg/ha/day) for lucerne in Central Gippsland, Victoria (Maffra) | ||||||||||||
| Growth rates (kg/ha/day) | ||||||||||||
| J | F | M | A | M | J | J | A | S | O | N | D | |
| Lucerne – Poor year | 16 | 15 | 25 | 18 | 12 | 10 | 7 | 13 | 24 | 25 | 15 | 14 |
| Lucerne – Standard year | 22 | 14 | 17 | 21 | 19 | 14 | 10 | 17 | 31 | 41 | 41 | 29 |
| Lucerne – Good year | 34 | 26 | 28 | 24 | 23 | 15 | 16 | 23 | 34 | 39 | 56 | 51 |
East Gippsland (Bairnsdale)
Table 71. Growth rates (kg/ha/day) for annual grass and clover with fertiliser in East Gippsland, Victoria (Bairnsdale)
| Growth rates (kg/ha/day) | ||||||||||||
| J | F | M | A | M | J | J | A | S | O | N | D | |
| Annual grass, clover, Fertiliser – Standard year | 0 | 9 | 15 | 11 | 11 | 15 | 15 | 15 | 25 | 30 | 30 | 22 |
| Annual grass, clover, Fertiliser – Poor year | 0 | 4 | 7 | 7 | 9 | 7 | 7 | 7 | 12 | 13 | 15 | 9 |
| Annual grass, clover, Fertiliser – Good year | 4 | 28 | 28 | 22 | 22 | 30 | 30 | 30 | 40 | 47 | 47 | 37 |
| Kikuyu, annuals, clover – Standard year | 50 | 60 | 50 | 25 | 10 | 10 | 10 | 10 | 20 | 25 | 35 | 45 |
Tasmania
North West (Elliott)
Table 72. Growth rates (kg/ha/day) for various species in North West Tasmania (Elliot)
| Growth rates (kg/ha/day) | ||||||||||||
| J | F | M | A | M | J | J | A | S | O | N | D | |
| Per ryegrass, cocksfoot, clover, Fert – Standard year | 25 | 9 | 5 | 14 | 9 | 8 | 8 | 7 | 19 | 54 | 51 | 35 |
| Forage crop | 0 | 0 | 0 | 0 | 0 | 0 | 0 | 0 | 0 | 0 | 0 | 0 |
| Stubble | 0 | 0 | 0 | 0 | 0 | 0 | 0 | 0 | 0 | 0 | 0 | 0 |
| Table 73. Growth rates (kg/ha/day) for lucerne in North West Tasmania (Elliot) | ||||||||||||
| Growth rates (kg/ha/day) | ||||||||||||
| J | F | M | A | M | J | J | A | S | O | N | D | |
| Lucerne – Poor year | 28 | 25 | 27 | 25 | 14 | 8 | 5 | 12 | 23 | 39 | 49 | 58 |
| Lucerne – Standard year | 57 | 51 | 41 | 28 | 18 | 9 | 8 | 13 | 29 | 44 | 54 | 74 |
| Lucerne – Good year | 88 | 58 | 49 | 35 | 22 | 13 | 12 | 17 | 32 | 46 | 55 | 66 |
| Table 74. Growth rates (kg/ha/day) for perennial ryegrass and clover with fertiliser in North West Tasmania (Elliot) | ||||||||||||
| Growth rates (kg/ha/day) | ||||||||||||
| J | F | M | A | M | J | J | A | S | O | N | D | |
| Perennial ryegrass, clover – Poor year, Fertiliser | 18 | 2 | 3 | 40 | 35 | 28 | 24 | 34 | 44 | 56 | 88 | 81 |
| Perennial ryegrass, clover – Standard year, Fertiliser | 72 | 40 | 20 | 35 | 38 | 30 | 25 | 31 | 44 | 58 | 85 | 93 |
| Perennial ryegrass, clover – Good year, Fertiliser | 94 | 96 | 51 | 52 | 58 | 34 | 26 | 34 | 43 | 55 | 87 | 94 |
North Central (Cressy)
Table 75. Growth rates (kg/ha/day) for lucerne in North Central Tasmania (Cressy)
| Growth rates (kg/ha/day) | ||||||||||||
| J | F | M | A | M | J | J | A | S | O | N | D | |
| Lucerne – Standard year | 21 | 12 | 17 | 20 | 12 | 4 | 2 | 6 | 20 | 35 | 37 | 32 |
| Lucerne – Poor year | 18 | 19 | 12 | 14 | 10 | 4 | 1 | 5 | 17 | 30 | 31 | 17 |
| Lucerne – Good year | 32 | 18 | 26 | 22 | 12 | 3 | 1 | 6 | 22 | 40 | 43 | 32 |
| Table 76. Growth rates (kg/ha/day) for perennial ryegrass and clover with fertiliser in North Central Tasmania (Cressy) | ||||||||||||
| Growth rates (kg/ha/day) | ||||||||||||
| J | F | M | A | M | J | J | A | S | O | N | D | |
| Perennial ryegrass, cocksfoot, clover, Ferti – Standard year | 14 | 5 | 2 | 8 | 6 | 7 | 6 | 6 | 31 | 65 | 46 | 22 |
| Perennial ryegrass, clover – Standard year, Fertiliser | 10 | 14 | 17 | 34 | 27 | 18 | 9 | 20 | 41 | 49 | 38 | 34 |
| Perennial ryegrass, clover – Poor year, Fertiliser | 10 | 2 | 27 | 33 | 22 | 16 | 5 | 21 | 37 | 27 | 26 | 26 |
| Perennial ryegrass, clover – Good year, Fertiliser | 31 | 15 | 30 | 43 | 28 | 10 | 6 | 20 | 40 | 53 | 57 | 57 |
| Table 77. Growth rates (kg/ha/day) for annuals and clover in North Central Tasmania (Cressy) | ||||||||||||
| Growth rates (kg/ha/day) | ||||||||||||
| J | F | M | A | M | J | J | A | S | O | N | D | |
| Annual grass, clover – Standard year | 4 | 10 | 20 | 25 | 18 | 7 | 7 | 19 | 40 | 63 | 42 | 13 |
| Annual grass, clover – Poor year | 0 | 0 | 8 | 16 | 17 | 5 | 5 | 10 | 40 | 47 | 23 | 0 |
| Annual grass, clover – Good year | 9 | 8 | 25 | 27 | 22 | 11 | 10 | 21 | 51 | 72 | 70 | 49 |
Central Midlands (Ross)
Table 78. Growth rates (kg/ha/day) for native pasture and clover with fertiliser in Central Midlands, Tasmania (Ross)
| Growth rates (kg/ha/day) | ||||||||||||
| J | F | M | A | M | J | J | A | S | O | N | D | |
| Native pasture, clover, Fertiliser – Standard year | 0 | 0 | 1 | 2 | 2 | 2 | 2 | 4 | 25 | 55 | 19 | 7 |
Southern Midlands (Jericho)
Table 79. Growth rates (kg/ha/day) for lucerne in Southern Midlands, Tasmania (Jericho)
| Growth rates (kg/ha/day) | ||||||||||||
| J | F | M | A | M | J | J | A | S | O | N | D | |
| Lucerne – Standard year | 20 | 14 | 15 | 13 | 6 | 1 | 0 | 2 | 12 | 26 | 29 | 21 |
| Lucerne – Poor year | 18 | 9 | 13 | 14 | 7 | 2 | 0 | 3 | 9 | 19 | 17 | 13 |
| Lucerne – Good year | 31 | 27 | 25 | 20 | 7 | 0 | 0 | 2 | 13 | 29 | 32 | 28 |
| Table 80. Growth rates (kg/ha/day) for perennial ryegrass and clover with fertiliser versus cocksfoot, phalaris and clover in Southern Midlands, Tasmania (Jericho) | ||||||||||||
| Growth rates (kg/ha/day) | ||||||||||||
| J | F | M | A | M | J | J | A | S | O | N | D | |
| Perennial ryegrass, clover – Standard year, Fertiliser | 28 | 14 | 14 | 27 | 22 | 9 | 3 | 11 | 34 | 42 | 41 | 40 |
| Perennial ryegrass, clover – Poor year, Fertiliser | 16 | 1 | 12 | 25 | 18 | 8 | 4 | 8 | 29 | 36 | 20 | 26 |
| Perennial ryegrass, clover – Good year, Fertiliser | 47 | 19 | 34 | 46 | 27 | 6 | 2 | 12 | 39 | 46 | 38 | 52 |
| Cocksfoot, phalaris, clover, Fertiliser – Standard year | 7 | 1 | 2 | 8 | 7 | 6 | 4 | 6 | 16 | 36 | 47 | 20 |
| Table 81. Growth rates (kg/ha/day) for annuals and clover in Southern Midlands, Tasmania (Jericho) | ||||||||||||
| Growth rates (kg/ha/day) | ||||||||||||
| J | F | M | A | M | J | J | A | S | O | N | D | |
| Annual grass, clover, Fertiliser – Standard Year | 0 | 0 | 0 | 3 | 3 | 3 | 3 | 5 | 15 | 45 | 35 | 15 |
| Annual grass, clover – Standard year, No fertiliser | 5 | 11 | 19 | 22 | 13 | 4 | 2 | 9 | 34 | 54 | 43 | 17 |
| Annual grass, clover – Poor year, No fertiliser | 5 | 5 | 14 | 16 | 11 | 4 | 1 | 5 | 23 | 34 | 19 | 18 |
| Annual grass, clover – Good year, No fertiliser | 9 | 14 | 23 | 27 | 15 | 4 | 3 | 11 | 38 | 57 | 75 | 49 |
South Australia
Mount Gambier
Table 82. Growth rates (kg/ha/day) for various species in South Australia (Mount Gambier)
| Growth rates (kg/ha/day) | ||||||||||||
| J | F | M | A | M | J | J | A | S | O | N | D | |
| Aust Phalaris, clover, annuals, Fertilised – Standard year | 3 | 3 | 8 | 17 | 28 | 27 | 27 | 39 | 56 | 67 | 46 | 11 |
| Annual grass, clover, Not fertilised – Standard year | 2 | 2 | 6 | 11 | 18 | 17 | 18 | 35 | 50 | 60 | 40 | 5 |
| Lucerne, Fertiliser – Standard year | 21 | 11 | 11 | 25 | 22 | 16 | 13 | 20 | 33 | 46 | 53 | 44 |
| Perennial ryegrass,clover, Fertiliser – Standard year | 2 | 0 | 1 | 14 | 34 | 35 | 30 | 36 | 45 | 70 | 81 | 30 |
| Perennial ryegrass, clover, Fertiliser – Poor year | 0 | 0 | 0 | 1 | 10 | 25 | 20 | 20 | 30 | 48 | 60 | 10 |
| Perennial ryegrass, clover, Fertiliser – Good year | 10 | 6 | 9 | 27 | 32 | 40 | 35 | 40 | 50 | 70 | 90 | 40 |
| Annual grass, clover – Standard year | 0 | 0 | 0 | 5 | 10 | 27 | 25 | 49 | 50 | 40 | 15 | 0 |
Lucindale
Table 83. Growth rates (kg/ha/day) for various species in South Australia (Lucindale)
| Growth rates (kg/ha/day) | ||||||||||||
| J | F | M | A | M | J | J | A | S | O | N | D | |
| Aust Phalaris, clover, annuals, Fertilised – Standard year | 0 | 0 | 3 | 9 | 21 | 24 | 27 | 34 | 41 | 50 | 21 | 4 |
| Lucerne, annuals, fertiliser – Standard year | 5 | 5 | 4 | 8 | 13 | 14 | 19 | 29 | 44 | 48 | 30 | 12 |
| Annual grass, clover – Poor year | 0 | 0 | 0 | 0 | 5 | 10 | 20 | 25 | 25 | 50 | 6 | 0 |
| Annual grass, clover – Good year | 0 | 0 | 7 | 14 | 28 | 30 | 36 | 55 | 73 | 90 | 35 | 1 |
Keith
Table 84. Growth rates (kg/ha/day) for various species in South Australia (Keith)
| Growth rates (kg/ha/day) | ||||||||||||
| J | F | M | A | M | J | J | A | S | O | N | D | |
| Aust phalaris, clover, annuals, Fertilised – Standard year | 0 | 0 | 1 | 10 | 21 | 25 | 26 | 32 | 35 | 27 | 17 | 4 |
| Lucerne, annuals, Fertilised – Standard year | 6 | 6 | 3 | 6 | 11 | 13 | 16 | 24 | 38 | 36 | 21 | 6 |
| Lucerne, No annuals, Fertilised – Standard year | 6 | 5 | 4 | 7 | 11 | 11 | 12 | 17 | 27 | 29 | 17 | 8 |
| Annual grass, clover, fertiliser – Standard year | 0 | 0 | 0 | 5 | 10 | 15 | 20 | 35 | 69 | 48 | 12 | 2 |
| Annual grass, clover, fertiliser – Poor year | 0 | 0 | 0 | 0 | 5 | 10 | 15 | 30 | 41 | 40 | 5 | 0 |
| Annual grass, clover, fertiliser – Good year | 4 | 3 | 8 | 18 | 26 | 31 | 35 | 56 | 74 | 81 | 20 | 2 |
Adelaide Hills (Mt Barker)
Table 85. Growth rates (kg/ha/day) for various species in Adelaide Hills, South Australia (Mount Barker)
| Growth rates (kg/ha/day) | ||||||||||||
| J | F | M | A | M | J | J | A | S | O | N | D | |
| Phalaris, clover, annuals, Fertilized – Standard year | 4 | 0 | 5 | 19 | 28 | 25 | 23 | 31 | 42 | 54 | 33 | 10 |
| Lucerne, annuals – Standard year | 19 | 15 | 14 | 24 | 22 | 14 | 10 | 17 | 29 | 42 | 38 | 21 |
| Perennial ryegrass, clover, Fertilised – Standard year | 0 | 0 | 6 | 15 | 36 | 30 | 24 | 32 | 41 | 54 | 35 | 8 |
| Annual grass, clover – Standard year | 0 | 0 | 0 | 10 | 15 | 25 | 25 | 35 | 50 | 71 | 25 | 0 |
| Annual grass, clover – Good year | 0 | 0 | 5 | 15 | 20 | 25 | 30 | 47 | 80 | 86 | 50 | 0 |
| Annual grass, clover – Poor year | 0 | 0 | 0 | 5 | 10 | 15 | 20 | 25 | 40 | 50 | 5 | 0 |
Fleurieu Peninsula (Inman Valley)
Table 86. Growth rates (kg/ha/day) for various species in Fleurieu Peninsula, South Australia (Inman Valley)
| Growth rates (kg/ha/day) | ||||||||||||
| J | F | M | A | M | J | J | A | S | O | N | D | |
| Perennial grass, clover, No fertiliser – Standard year | 0 | 0 | 0 | 0 | 15 | 15 | 15 | 25 | 35 | 40 | 25 | 0 |
| Phalaris, clover, annuals, Fertilised – Standard year | 0 | 2 | 6 | 17 | 29 | 28 | 25 | 33 | 45 | 50 | 25 | 8 |
| Lucerne – Standard year | 13 | 8 | 8 | 18 | 19 | 12 | 8 | 13 | 27 | 37 | 24 | 20 |
| Annual grass, clover – Standard year | 0 | 0 | 0 | 10 | 20 | 22 | 21 | 37 | 57 | 61 | 22 | 0 |
| Annual grass, clover – Poor year | 0 | 0 | 0 | 0 | 10 | 15 | 17 | 20 | 40 | 40 | 7 | 0 |
| Annual grass, clover – Good year | 0 | 0 | 5 | 15 | 29 | 30 | 26 | 43 | 64 | 81 | 53 | 12 |
Fleurieu Peninsula (Mt Barker)
Table 87. Growth rates (kg/ha/day) for phalaris, clover, annuals in Fleurieu Peninsula, South Australia (Mount Barker)
| Growth rates (kg/ha/day) | ||||||||||||
| J | F | M | A | M | J | J | A | S | O | N | D | |
| Phalaris, clover, annuals, Fertilised – Standard year | 4 | 0 | 5 | 19 | 28 | 25 | 23 | 31 | 42 | 54 | 33 | 10 |
Kangaroo Island (Parndana)
Table 88. Growth rates (kg/ha/day) for various species on Kangaroo Island, South Australia (Parndarna)
| Growth rates (kg/ha/day) | ||||||||||||
| J | F | M | A | M | J | J | A | S | O | N | D | |
| Annual grass, clover, Fertilised – Standard year | 0 | 0 | 0 | 5 | 13 | 22 | 28 | 41 | 52 | 42 | 16 | 0 |
| Annual grass, low clover, Not fertilised – Standard year | 0 | 0 | 0 | 1 | 4 | 11 | 14 | 19 | 31 | 63 | 35 | 0 |
| Kikuyu, clover, annuals, Fertiliser – Standard year | 10 | 5 | 10 | 15 | 15 | 18 | 21 | 30 | 45 | 45 | 20 | 15 |
| Lucerne – Standard year | 7 | 4 | 5 | 8 | 17 | 15 | 13 | 17 | 33 | 40 | 15 | 9 |
| Perennial ryegrass, clover, Fertilised – Standard year | 0 | 0 | 5 | 17 | 25 | 25 | 25 | 35 | 38 | 36 | 21 | 7 |
Mallee – (Lameroo)
Table 89. Growth rates (kg/ha/day) for medic, annuals in Mallee, South Australia (Lameroo)
| Growth rates (kg/ha/day) | ||||||||||||
| J | F | M | A | M | J | J | A | S | O | N | D | |
| Medic, annuals – Standard year | 0 | 0 | 0 | 5 | 12 | 18 | 24 | 32 | 29 | 20 | 5 | 0 |
Mid North (Roseworthy)
Table 90. Growth rates (kg/ha/day) for medic, annuals in Mid North South Australia (Roseworthy)
| Growth rates (kg/ha/day) | ||||||||||||
| J | F | M | A | M | J | J | A | S | O | N | D | |
| Medic, annuals – Standard Year | 0 | 0 | 4 | 8 | 15 | 21 | 29 | 40 | 46 | 24 | 5 | 0 |
Mid North (Crystal Brook)
Table 91. Growth rates (kg/ha/day) for medic, annuals in Mid North South Australia (Crystal Brook)
| Growth rates (kg/ha/day) | ||||||||||||
| J | F | M | A | M | J | J | A | S | O | N | D | |
| Medic, annuals – Standard year | 0 | 0 | 3 | 7 | 13 | 20 | 28 | 34 | 32 | 14 | 3 | 0 |
Mid North (Booborowie)
Table 92. Growth rates (kg/ha/day) for various species in Mid North South Australia (Booborowie)
| Growth rates (kg/ha/day) | ||||||||||||
| J | F | M | A | M | J | J | A | S | O | N | D | |
| Medic, annuals – Standard year | 0 | 0 | 3 | 7 | 15 | 19 | 22 | 32 | 40 | 28 | 10 | 0 |
| Lucerne, annuals, Fertilised – Standard year | 4 | 5 | 3 | 4 | 8 | 9 | 11 | 16 | 25 | 25 | 17 | 8 |
Eyre Penninsula (Minnipa)
Table 93. Growth rates (kg/ha/day) for medic, annuals in Eyre Penninsula South Australia (Minnipa)
| Growth rates (kg/ha/day) | ||||||||||||
| J | F | M | A | M | J | J | A | S | O | N | D | |
| Medic, annuals – Standard year | 0 | 0 | 0 | 3 | 8 | 17 | 27 | 34 | 28 | 9 | 0 | 0 |
Eyre Peninsula (Koppio)
Table 94. Growth rates (kg/ha/day) for cocksfoot, clover annuals in Eyre Penninsula South Australia (Koppio)
| Growth rates (kg/ha/day) | ||||||||||||
| J | F | M | A | M | J | J | A | S | O | N | D | |
| Cocksfoot, clover, annuals – Standard Year | 2 | 2 | 3 | 8 | 19 | 26 | 31 | 41 | 48 | 26 | 5 | 0 |
Yorke Peninsula (Minlaton)
Table 95. Growth rates (kg/ha/day) for medic, annuals in York Penninsula South Australia (Minlaton)
| Growth rates (kg/ha/day) | ||||||||||||
| J | F | M | A | M | J | J | A | S | O | N | D | |
| Medic, annuals – Standard year | 0 | 0 | 2 | 5 | 14 | 24 | 35 | 45 | 40 | 19 | 3 | 0 |
Western Australia
West Midlands (Irwin)
Table 96. Growth rates (kg/ha/day) for annuals and weeds in West Midlands, Western Australia (Irwin)
| Growth rates (kg/ha/day) | ||||||||||||
| J | F | M | A | M | J | J | A | S | O | N | D | |
| Annual grass & weeds, clover – Standard year | 0 | 0 | 0 | 2 | 17 | 27 | 28 | 36 | 56 | 51 | 10 | 0 |
West Midlands (Moora, Three Springs)
Table 97. Growth rates (kg/ha/day) for annuals and weeds and lucerne in West Midlands, Western Australia (Moora, Three Springs)
| Growth rates (kg/ha/day) | ||||||||||||
| J | F | M | A | M | J | J | A | S | O | N | D | |
| Annual grass & weeds, clover – Standard year | 0 | 0 | 0 | 1 | 6 | 12 | 17 | 28 | 40 | 25 | 8 | 0 |
| Lucerne – Standard year | 1 | 2 | 8 | 8 | 14 | 21 | 22 | 26 | 30 | 10 | 6 | 1 |
| Lucerne – Poor year | 1 | 0 | 4 | 7 | 14 | 19 | 20 | 25 | 12 | 5 | 1 | 1 |
| Lucerne – Good year | 5 | 9 | 5 | 6 | 15 | 20 | 23 | 27 | 46 | 35 | 3 | 3 |
Central (Northam)
Table 98. Growth rates (kg/ha/day) for annuals and weeds and lucerne in Central, Western Australia (Northam)
| Growth rates (kg/ha/day) | ||||||||||||
| J | F | M | A | M | J | J | A | S | O | N | D | |
| Annual grass & weeds, clover, No fertiliser – Standard year | 0 | 0 | 0 | 2 | 12 | 6 | 10 | 40 | 60 | 15 | 0 | 0 |
| Lucerne – Standard year | 4 | 2 | 4 | 9 | 13 | 14 | 15 | 19 | 35 | 26 | 5 | 2 |
| Lucerne – Poor year | 3 | 4 | 1 | 4 | 8 | 12 | 13 | 17 | 27 | 14 | 5 | 1 |
| Lucerne – Good year | 4 | 9 | 6 | 9 | 14 | 16 | 17 | 21 | 38 | 40 | 11 | 4 |
Southern High Rainfall (Busselton)
Table 99. Growth rates (kg/ha/day) for annuals, weeds and clover with fertiliser in the Southern high rainfall zone, Western Australia (Bussleton)
| Growth rates (kg/ha/day) | ||||||||||||
| J | F | M | A | M | J | J | A | S | O | N | D | |
| Annual grass & weeds, clover, Fertiliser – Standard year | 0 | 0 | 0 | 6 | 23 | 26 | 28 | 37 | 53 | 58 | 42 | 0 |
Southern Cold Zone (Boyup Brook)
Table 100. Growth rates (kg/ha/day) for annuals, weeds and clover with fertiliser in the Southern cold zone, Western Australia (Boyup Brook)
| Growth rates (kg/ha/day) | ||||||||||||
| J | F | M | A | M | J | J | A | S | O | N | D | |
| Annual grass & weeds, clover, Fertiliser – Standard year | 0 | 0 | 0 | 4 | 13 | 17 | 20 | 31 | 37 | 34 | 26 | 0 |
Southern Cold Zone (Katanning, Lake Grace, Narrogin)
Table 101. Growth rates (kg/ha/day) for annuals, weeds and clover with fertiliser in the Southern cold zone, Western Australia (Katanning, Lake Grace, Narrogin)
| Growth rates (kg/ha/day) | ||||||||||||
| J | F | M | A | M | J | J | A | S | O | N | D | |
| Annual grass & weeds, clover, Fertiliser – Standard year | 0 | 0 | 0 | 1 | 8 | 13 | 14 | 26 | 48 | 40 | 5 | 0 |
Southern Cold Zone (Manjimup)
Table 102. Growth rates (kg/ha/day) for various species in the Southern cold zone, Western Australia (Manjimup)
| Growth rates (kg/ha/day) | ||||||||||||
| J | F | M | A | M | J | J | A | S | O | N | D | |
| Annual grass & weeds, clover, Fertiliser – Standard year | 0 | 0 | 0 | 4 | 13 | 17 | 17 | 31 | 40 | 58 | 26 | 0 |
| Lucerne – Standard year | 4 | 4 | 3 | 12 | 15 | 13 | 16 | 26 | 43 | 60 | 32 | 8 |
| Kikuyu – Standard year | 8 | 8 | 6 | 18 | 19 | 16 | 16 | 26 | 35 | 45 | 26 | 16 |
South Coast High Rainfall (Mt. Barker)
|
|
Table 103. Growth rates (kg/ha/day) for various species in the South Coast high rainfall zone, Western Australia (Mount Barker)
| Growth rates (kg/ha/day) | ||||||||||||
| J | F | M | A | M | J | J | A | S | O | N | D | |
| Annual grass & weeds, clover, Fertiliser – Standard year | 0 | 0 | 0 | 12 | 21 | 23 | 20 | 25 | 45 | 58 | 23 | 0 |
| Lucerne – Standard year | 8 | 8 | 5 | 12 | 22 | 22 | 18 | 27 | 40 | 60 | 30 | 10 |
| Lucerne – Poor year | 4 | 0 | 0 | 6 | 15 | 16 | 17 | 17 | 31 | 30 | 13 | 5 |
| Lucerne – Good year | 15 | 16 | 12 | 16 | 25 | 26 | 28 | 33 | 50 | 70 | 40 | 25 |
| Kikuyu – Standard year | 13 | 13 | 10 | 12 | 17 | 18 | 20 | 26 | 45 | 58 | 33 | 14 |
| Kikuyu – Poor year | 8 | 3 | 4 | 8 | 12 | 8 | 12 | 13 | 23 | 45 | 17 | 11 |
| Kikuyu – Good year | 24 | 21 | 14 | 24 | 25 | 24 | 32 | 30 | 55 | 75 | 40 | 35 |
South Coast Sandplain (Wellstead)
|
|
Table 104. Growth rates (kg/ha/day) for various species in the South Coast Sandplain, Western Australia (Wellstead)
| Growth rates (kg/ha/day) | ||||||||||||
| J | F | M | A | M | J | J | A | S | O | N | D | |
| Annual grass & weeds, clover, Fertiliser – Standard year | 0 | 0 | 0 | 7 | 10 | 13 | 17 | 29 | 42 | 33 | 7 | 0 |
| Lucerne – Standard year | 8 | 8 | 4 | 7 | 11 | 12 | 14 | 26 | 29 | 35 | 11 | 11 |
| Lucerne – Poor year | 4 | 0 | 0 | 3 | 10 | 10 | 11 | 19 | 23 | 19 | 5 | 4 |
| Lucerne – Good year | 19 | 17 | 14 | 15 | 14 | 15 | 22 | 30 | 38 | 40 | 32 | 20 |
| Kikuyu – Standard year | 12 | 12 | 9 | 12 | 12 | 13 | 16 | 27 | 42 | 33 | 22 | 15 |
| Kikuyu – Poor year | 9 | 3 | 4 | 8 | 10 | 7 | 10 | 10 | 23 | 24 | 14 | 10 |
| Kikuyu – Good year | 25 | 23 | 15 | 24 | 20 | 20 | 32 | 34 | 55 | 50 | 30 | 27 |
South Coast Sandplain (Esperance, Ravensthorpe)
Table 105. Growth rates (kg/ha/day) for various species in the South Coast Sandplain, Western Australia (Esperence, Ravensthorpe)
| Growth rates (kg/ha/day) | ||||||||||||
| J | F | M | A | M | J | J | A | S | O | N | D | |
| Annual grass & weeds, clover, Fertiliser – Standard year | 0 | 0 | 0 | 7 | 10 | 13 | 17 | 29 | 52 | 36 | 16 | 0 |
| Lucerne – Standard year | 12 | 12 | 6 | 11 | 11 | 12 | 14 | 25 | 32 | 40 | 20 | 15 |
| Lucerne – Poor year | 6 | 0 | 0 | 5 | 10 | 11 | 12 | 19 | 26 | 24 | 8 | 8 |
| Lucerne – Good year | 20 | 18 | 15 | 16 | 14 | 15 | 22 | 28 | 40 | 45 | 33 | 25 |
| Kikuyu – Standard year | 14 | 14 | 11 | 13 | 13 | 10 | 11 | 27 | 50 | 36 | 25 | 18 |
| Kikuyu – Poor year | 9 | 3 | 4 | 8 | 10 | 7 | 7 | 12 | 25 | 24 | 16 | 12 |
| Kikuyu – Good year | 25 | 22 | 15 | 25 | 20 | 15 | 22 | 30 | 60 | 50 | 30 | 25 |
Queensland
St George
Table 106. Growth rates (kg/ha/day) for sown grass in Queensland (St George)
| Growth rates (kg/ha/day) | ||||||||||||
| J | F | M | A | M | J | J | A | S | O | N | D | |
| Sown grass – Standard year | 15 | 20 | 17 | 9 | 3 | 1 | 1 | 3 | 9 | 17 | 18 | 14 |
| Sown grass – Poor year | 6 | 9 | 4 | 4 | 1 | 1 | 0 | 2 | 4 | 4 | 3 | 6 |
| Sown grass – Good year | 30 | 40 | 31 | 16 | 5 | 2 | 2 | 4 | 17 | 28 | 30 | 22 |
| Table 107. Growth rates (kg/ha/day) for native grass in Queensland (St George) | ||||||||||||
| Growth rates (kg/ha/day) | ||||||||||||
| J | F | M | A | M | J | J | A | S | O | N | D | |
| Native grass – Standard year | 14 | 18 | 15 | 8 | 3 | 1 | 1 | 2 | 8 | 14 | 15 | 13 |
| Native grass – Poor year | 6 | 8 | 4 | 3 | 1 | 1 | 0 | 1 | 4 | 3 | 3 | 6 |
| Native grass – Good year | 28 | 37 | 28 | 14 | 5 | 1 | 2 | 4 | 14 | 23 | 25 | 26 |
| Table 108. Growth rates (kg/ha/day) for forage sorghum in Queensland (St George) | ||||||||||||
| Growth rates (kg/ha/day) | ||||||||||||
| J | F | M | A | M | J | J | A | S | O | N | D | |
| Forage sorghum – Standard year | 50 | 38 | 33 | 20 | 6 | 1 | 0 | 0 | 0 | 0 | 15 | 44 |
| Forage sorghum – Poor year | 13 | 15 | 14 | 9 | 1 | 0 | 0 | 0 | 0 | 0 | 5 | 14 |
| Forage sorghum – Good year | 91 | 50 | 49 | 25 | 5 | 0 | 0 | 0 | 0 | 0 | 21 | 82 |
| Table 109. Growth rates (kg/ha/day) for Lablab in Queensland (St George) | ||||||||||||
| Growth rates (kg/ha/day) | ||||||||||||
| J | F | M | A | M | J | J | A | S | O | N | D | |
| Lablab – Standard year | 31 | 29 | 28 | 19 | 8 | 0 | 0 | 0 | 0 | 0 | 14 | 29 |
| Lablab – Poor year | 8 | 11 | 9 | 10 | 3 | 0 | 0 | 0 | 0 | 0 | 4 | 8 |
| Lablab – Good year | 52 | 53 | 56 | 39 | 17 | 1 | 0 | 0 | 0 | 0 | 26 | 50 |
| Table 110. Growth rates (kg/ha/day) for lucerne in Queensland (St George) | ||||||||||||
| Growth rates (kg/ha/day) | ||||||||||||
| J | F | M | A | M | J | J | A | S | O | N | D | |
| Lucerne – Standard year | 11 | 13 | 14 | 14 | 12 | 13 | 17 | 18 | 14 | 11 | 12 | 11 |
| Lucerne – Poor year | 3 | 7 | 4 | 3 | 2 | 4 | 7 | 5 | 3 | 3 | 3 | 4 |
| Lucerne – Good year | 20 | 26 | 24 | 20 | 19 | 20 | 29 | 34 | 35 | 25 | 24 | 20 |
| Table 111. Growth rates (kg/ha/day) for oats in Queensland (St George) | ||||||||||||
| Growth rates (kg/ha/day) | ||||||||||||
| J | F | M | A | M | J | J | A | S | O | N | D | |
| Oats – Standard year | 0 | 0 | 0 | 2 | 25 | 24 | 32 | 45 | 28 | 18 | 12 | 0 |
| Oats – Poor year | 0 | 0 | 0 | 1 | 8 | 9 | 16 | 30 | 6 | 0 | 0 | 0 |
| Oats – Good year | 0 | 0 | 0 | 2 | 24 | 30 | 48 | 48 | 45 | 45 | 30 | 0 |
Roma
Table 112. Growth rates (kg/ha/day) for sown grass in Queensland (Roma)
| Growth rates (kg/ha/day) | ||||||||||||
| J | F | M | A | M | J | J | A | S | O | N | D | |
| Sown grass – Standard year | 20 | 24 | 22 | 12 | 4 | 1 | 1 | 3 | 11 | 21 | 24 | 21 |
| Sown grass – Poor year | 7 | 10 | 10 | 5 | 2 | 1 | 1 | 2 | 6 | 6 | 9 | 15 |
| Sown grass – Good year | 34 | 40 | 39 | 21 | 5 | 1 | 2 | 4 | 16 | 30 | 37 | 29 |
| Table 113. Growth rates (kg/ha/day) for native grass in Queensland (Roma) | ||||||||||||
| Growth rates (kg/ha/day) | ||||||||||||
| J | F | M | A | M | J | J | A | S | O | N | D | |
| Native grass – Standard year | 19 | 22 | 20 | 11 | 3 | 1 | 1 | 3 | 9 | 18 | 20 | 20 |
| Native grass – Poor year | 6 | 9 | 9 | 4 | 1 | 1 | 1 | 2 | 5 | 5 | 8 | 14 |
| Native grass – Good year | 31 | 37 | 36 | 19 | 4 | 1 | 2 | 4 | 14 | 25 | 31 | 31 |
| Table 114. Growth rates (kg/ha/day) for forage sorghum in Queensland (Roma) | ||||||||||||
| Growth rates (kg/ha/day) | ||||||||||||
| J | F | M | A | M | J | J | A | S | O | N | D | |
| Forage sorghum – Standard year | 59 | 45 | 37 | 17 | 1 | 0 | 0 | 0 | 0 | 0 | 19 | 58 |
| Forage sorghum – Poor year | 30 | 18 | 14 | 11 | 1 | 0 | 0 | 0 | 0 | 0 | 1 | 22 |
| Forage sorghum – Good year | 90 | 54 | 52 | 20 | 0 | 0 | 0 | 0 | 0 | 0 | 24 | 101 |
| Table 115. Growth rates (kg/ha/day) for Lablab in Queensland (Roma) | ||||||||||||
| Growth rates (kg/ha/day) | ||||||||||||
| J | F | M | A | M | J | J | A | S | O | N | D | |
| Lablab – Standard year | 41 | 37 | 32 | 20 | 3 | 0 | 0 | 0 | 0 | 0 | 18 | 35 |
| Lablab – Poor year | 14 | 15 | 10 | 7 | 1 | 0 | 0 | 0 | 0 | 0 | 1 | 15 |
| Lablab – Good year | 64 | 63 | 53 | 50 | 11 | 0 | 0 | 0 | 0 | 0 | 33 | 55 |
| Table 116. Growth rates (kg/ha/day) for lucerne in Queensland (Roma) | ||||||||||||
| Growth rates (kg/ha/day) | ||||||||||||
| J | F | M | A | M | J | J | A | S | O | N | D | |
| Lucerne – Standard year | 16 | 19 | 20 | 18 | 16 | 18 | 18 | 18 | 16 | 14 | 14 | 15 |
| Lucerne – Poor year | 6 | 9 | 6 | 4 | 3 | 12 | 9 | 8 | 4 | 4 | 6 | 7 |
| Lucerne – Good year | 24 | 29 | 30 | 25 | 24 | 23 | 30 | 34 | 37 | 32 | 30 | 25 |
| Table 117. Growth rates (kg/ha/day) for oats in Queensland (Roma) | ||||||||||||
| Growth rates (kg/ha/day) | ||||||||||||
| J | F | M | A | M | J | J | A | S | O | N | D | |
| Oats – Standard year | 0 | 0 | 0 | 3 | 31 | 23 | 38 | 45 | 34 | 22 | 16 | 0 |
| Oats – Poor year | 0 | 0 | 0 | 2 | 18 | 17 | 24 | 25 | 14 | 3 | 1 | 0 |
| Oats – Good year | 0 | 0 | 0 | 2 | 23 | 39 | 50 | 47 | 43 | 41 | 32 | 0 |
Goondiwindi
Table 118. Growth rates (kg/ha/day) for sown grass in Queensland (Goondiwindi)
| Growth rates (kg/ha/day) | ||||||||||||
| J | F | M | A | M | J | J | A | S | O | N | D | |
| Sown grass – Standard year | 20 | 21 | 18 | 11 | 3 | 1 | 1 | 2 | 9 | 21 | 26 | 23 |
| Sown grass – Poor year | 11 | 11 | 8 | 3 | 1 | 1 | 0 | 1 | 6 | 11 | 12 | 12 |
| Sown grass – Good year | 42 | 44 | 32 | 16 | 5 | 1 | 1 | 2 | 12 | 30 | 36 | 39 |
| Table 119. Growth rates (kg/ha/day) for native grass in Queensland (Goondiwindi) | ||||||||||||
| Growth rates (kg/ha/day) | ||||||||||||
| J | F | M | A | M | J | J | A | S | O | N | D | |
| Native grass – Standard year | 18 | 19 | 17 | 10 | 3 | 1 | 1 | 2 | 7 | 17 | 21 | 21 |
| Native grass – Poor year | 10 | 10 | 7 | 3 | 1 | 1 | 0 | 1 | 5 | 9 | 10 | 11 |
| Native grass – Good year | 38 | 40 | 29 | 14 | 5 | 1 | 1 | 2 | 10 | 25 | 30 | 35 |
| Table 120. Growth rates (kg/ha/day) for forage sorghum in Queensland (Goondiwindi) | ||||||||||||
| Growth rates (kg/ha/day) | ||||||||||||
| J | F | M | A | M | J | J | A | S | O | N | D | |
| Forage sorghum – Standard year | 64 | 40 | 36 | 22 | 4 | 0 | 0 | 0 | 0 | 0 | 17 | 60 |
| Forage sorghum – Poor year | 41 | 29 | 14 | 9 | 2 | 0 | 0 | 0 | 0 | 0 | 6 | 24 |
| Forage sorghum – Good year | 79 | 49 | 43 | 22 | 3 | 0 | 0 | 0 | 0 | 0 | 32 | 105 |
| Table 121. Growth rates (kg/ha/day) for Lablab in Queensland (Goondiwindi) | ||||||||||||
| Growth rates (kg/ha/day) | ||||||||||||
| J | F | M | A | M | J | J | A | S | O | N | D | |
| Lablab – Standard year | 41 | 35 | 30 | 23 | 8 | 0 | 0 | 0 | 0 | 0 | 17 | 40 |
| Lablab – Poor year | 24 | 17 | 9 | 8 | 2 | 0 | 0 | 0 | 0 | 0 | 8 | 17 |
| Lablab – Good year | 65 | 73 | 48 | 50 | 15 | 0 | 0 | 0 | 0 | 0 | 23 | 62 |
| Table 122. Growth rates (kg/ha/day) for lucerne in Queensland (Goondiwindi) | ||||||||||||
| Growth rates (kg/ha/day) | ||||||||||||
| J | F | M | A | M | J | J | A | S | O | N | D | |
| Lucerne – Standard year | 17 | 17 | 17 | 16 | 14 | 16 | 16 | 22 | 20 | 18 | 17 | 17 |
| Lucerne – Poor year | 11 | 11 | 10 | 6 | 4 | 10 | 4 | 6 | 4 | 5 | 7 | 9 |
| Lucerne – Good year | 23 | 26 | 24 | 25 | 22 | 23 | 23 | 41 | 44 | 39 | 36 | 26 |
| Table 123. Growth rates (kg/ha/day) for oats in Queensland (Goondiwindi) | ||||||||||||
| Growth rates (kg/ha/day) | ||||||||||||
| J | F | M | A | M | J | J | A | S | O | N | D | |
| Oats – Standard year | 0 | 0 | 0 | 3 | 28 | 31 | 37 | 44 | 34 | 21 | 15 | 0 |
| Oats – Poor year | 0 | 0 | 0 | 3 | 20 | 11 | 31 | 30 | 15 | 2 | 0 | 0 |
| Oats – Good year | 0 | 0 | 0 | 3 | 33 | 45 | 39 | 48 | 39 | 43 | 28 | 0 |
