North East Victoria, South West Slopes NSW, South West Victoria (Upper) – Industry Benchmarks & Livestock Issues
Livestock Systems
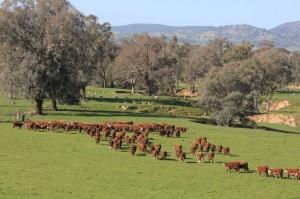
The regions of North East Victoria, South West Vic (Upper) and the South West Slopes of NSW cover a wide geographic area with variation in land class. The regions are similar in that rainfall (and reliability of) is generally less than the South West Vic (Lower) region. Sheep are the predominant grazing enterprise in the cropping and improved pasture zones, and cattle in the less arable country. As with other regions, there has been a shift from wool to prime lamb production in line with the shifting profitability.
Industry Benchmarks
No specific benchmarking data exists for this combined region so instead, some benchmarks have been collated from the South West and the North East regions from the Victorian Livestock Farm Monitor Project, available from the Agriculture Victoria website. The data from the Project is updated and published annually and available at http://agriculture.vic.gov.au/agriculture/livestock/farm-monitor-project
The Livestock Farm Monitor Project surveys selected farms for physical and financial information across Victoria. The project has been running for 42 years in the South West of the state and only recently extended into the North East (2004-05). There is no similar regional data freely available for the South West slopes of NSW, although some consultants do collect such data for their clients. Given the spread in geography of this region, data presented includes results from South West Victoria (farms included in the dataset cover the area from Dergholm, Ararat, Ballarat, Woolsthorpe and Bessiebelle) and for NE Victoria (farms from Saint Arnaud, Mansfield and Tallangatta).
Note: benchmarks should always be interpreted in the context of the data collected and when comparing your own situation to the benchmarks, consideration should be given to variables such as climate, soils and enterprise setup.
For the analysis of particular livestock industries below, only the relevant enterprises are shown, which reduces the number of properties.
Whole farm analysis
South West Victoria
The number of participants in the South West region varies between years but is usually about 38 farms. Table 1 shows physical and financial data for farms in the South West averaged over ten years (2001-2011). The Top 20% are farms with high profitability per effective hectares, based on operating profit as $/ha. Enterprise mix is not available for the 10 year average but for 2010-11 the average was 42% wool sheep, 36% prime lambs, 13% cattle and 9% cropping. In this year, the top 20% producers ran more prime lambs and less cattle.
Table 1. Differences between average and high profitability farms in South West Victoria (average 2001-2011)
| Farm parameter | Average all farms | Top 20% |
| Area (ha) | 1,031 | 923 |
| Annual rainfall (mm) | 676 | 691 |
| Stocking rate (DSE/ha) | 15.7 | 18 |
| Stocking rate (DSE/ha/100 mm rainfall) | 2.4 | 2.7 |
| Labour efficiency (DSE/labour unit) | 7,409 | 8,612 |
| Phosphorus application (kg P/ha) | 10.4 | 12.6 |
| Gross Income ($/ha) | 639 | 812 |
| Enterprise costs ($/ha) | 248 | 249 |
| Overhead costs ($/ha) | 124 | 113 |
| Net Income ($/ha) | 268 | 450 |
| Owner/Operator allowance ($/ha) | 78 | 68 |
| Operating profit ($/ha) | 179 | 372 |
| Return to assets (%) | 3.2 | 7.9 |
North East Victoria
[expand title=” ” swaptitle=” ” tag=”h4″ elwraptag=”div” elwrapclass=”expend-collapse-wrapper”]
The data shown in Table 2 is for participating farms in North East Victoria averaged for the seven years (2002-2003-2010/2011). Ranges in farm and enterprise size was similar to the South West, but with less cropping. The Top 20% are those farms with high profitability per effective hectares based on operating profit as $/ha.
These results suggest that the most profitable farms;
- run a higher stocking rate
- apply more fertiliser
- run more stock per labour unit
- achieve these without an increase in operating costs
Table 2. Differences between average and high profitability farms in North East Victoria (average 2001-2011)
| Farm parameter | Average all farms | Top 20% |
| Area (ha) | 998 | 1,278 |
| Annual rainfall (mm) | 639 | 649 |
| Stocking rate (DSE/ha) | 9.1 | 10.9 |
| Stocking rate (DSE/ha/100 mm rainfall) | 1.4 | 1.6 |
| Labour efficiency (DSE/labour unit) | 5,200 | 6,424 |
| Phosphorus application (kg P/ha) | 4.2 | 5.5 |
| Gross Income ($/ha) | 343 | 487 |
| Enterprise costs ($/ha) | 130 | 138 |
| Overhead costs ($/ha) | 80 | 73 |
| Net Income ($/ha) | 133 | 276 |
| Owner/Operator allowance ($/ha) | 69 | 59 |
| Operating profit ($/ha) | 66 | 220 |
| Return to assets (%) | 1.8 | 5.5 |
Farm enterprise comparison
Wool sheep
South West Victoria
Table 3 shows the average characteristics of wool producing enterprises in South West Victoria for the 10 year period 2001-11. The top 20% of farms are ranked by operating profit per effective hectares.
Table 3. Production and financial characteristics of average and high profitability wool enterprises in south west Victoria 2001-11 average.
| Farm parameter | Average all farms | Top 20% |
| Stocking rate (DSE/ha) | 15.1 | 17.3 |
| Marking (%) | 75 | 76 |
| Wool per head (kg clean) | 3.7 | 3.7 |
| Wool per hectare (Kg) | 37 | 43 |
| Fibre diameter (micron) | 18.9 | 19 |
| Net wool price, clean ($/kg) | $10.57 | $11.29 |
| Sheep sale price ($/head) | $54 | $58 |
| Pasture costs; $/ha, ($/DSE) | $50 ($3.30) | $54 ($3.12) |
| Supplementary feed; $/ha, ($/DSE) | $64 ($4.24) | $49 ($2.83) |
| Animal health; $/ha, ($/DSE) | $26 ($1.72) | $29 ($1.68) |
| Gross Margin ($/DSE) | $19 | $27 |
| Gross Margin ($/ha) | $273 | $455 |
| Gross Margin ($/ha/100mm rainfall) | $43 | $74 |
Characteristics of the most profitable wool enterprises; More profitable operations run a higher stocking rate with lower levels of supplementary feeding and achieve the same production per head but with greater product sold/ha which leads to higher profitability per head.
North East Victoria
Table 4. Production and financial characteristics of average and high profitability wool enterprises in North East Victoria 2004 -11 average.
| Farm parameter | Average all farms | Top 20% |
| Stocking rate (DSE/ha) | 9.2 | 11.0 |
| Marking (%) | 75 | 79 |
| Wool per head (kg clean) | 3.6 | 3.6 |
| Wool per hectare (Kg) | 20.3 | 24.7 |
| Fibre diameter (micron) | 18.6 | 18.7 |
| Net wool price, clean ($/kg) | $10.06 | $9.81 |
| Sheep sale price ($/head) | $59 | $63 |
| Pasture costs; $/ha, ($/DSE) | $22 ($2.39) | $25 ($2.27) |
| Supplementary feed; $/ha, ($/DSE) | $36 ($3.91) | $30 ($2.72) |
| Animal health; $/ha, ($/DSE) | $12 ($1.30) | $13 ($1.18) |
| Gross Margin ($/DSE) | $20 | $27 |
| Gross Margin ($/ha) | $176 | $289 |
| Gross Margin ($/ha/100mm rainfall) | $29 | $49 |
In the North East analysis, the most profitable wool flocks are characterised by a higher stocking rate with similar production per head, greater production/ha but lower per head costs, especially supplementary feed.
Prime lambs
South West Victoria
Table 5 shows the key characteristics of all prime lamb enterprises in the South West of Victoria for 2001-11. This covers a range of ewe breeds as Merinos, Crossbreeds and self-replacing Composites. The top 20% of farms are ranked by operating profit per effective hectares.
Table 5. Production and financial characteristics of average and high profitability prime lamb enterprises in South West Victoria, 2001-11 averages.
| Farm parameter | Average all farms | Top 20% |
| Stocking rate (DSE/ha) | 16 | 18.8 |
| Marking (%) | 102 | 104 |
| Lamb production carcass weight (kg/ha) | 103 | 143 |
| Wool (kg/ha greasy) | 35 | 42 |
| Net wool price, greasy ($/kg) | $4.65 | $5.01 |
| Average lamb carcass price ($/kg) | $4.23 | $4.57 |
| Pasture costs; $/ha, ($/DSE) | $64 ($4.00) | $74 ($3.94) |
| Supplementary feed; $/ha, ($/DSE) | $46 ($2.88) | $45 ($2.39) |
| Animal health; $/ha, ($/DSE) | $26 ($1.63) | $31 ($1.65) |
| Gross Margin ($/DSE) | $25 | $37 |
| Gross Margin ($/ha) | $394 | $656 |
| Gross Margin ($/ha/100mm rainfall) | $61 | $104 |
As for wool sheep, more profitable operations run a higher stocking rate, achieve similar production per head but with greater value for product sold/ha and less supplementary feed/DSE. More profitable properties spent more on pastures per hectare. As there is a diversity of ewe breeds and prime lamb systems in the analysis, some of the reason for little difference in lambing percentages may be attributed to Merino flocks with high wool returns and low lambing percentages (as was the case in in 2010/11). This illustrates the contribution of wool to returns.
Figure 1 shows average Gross Margins as $/ha/100mm rainfall for the period 2006-11 for enterprises that have Merino as the ewe base and those that run Crossbred ewes. Composite or obvious self-replacing meat enterprises are not included due to small numbers. Whilst the five year average shows little difference in enterprise Gross Margins/ha/100 mm, there is considerable variability between years. Also, there is also as much variability within these systems in any one year as between enterprises. There are some very profitable prime lamb enterprises based on Merino ewes and some that run well below average, a similar situation to crossbred ewe systems.
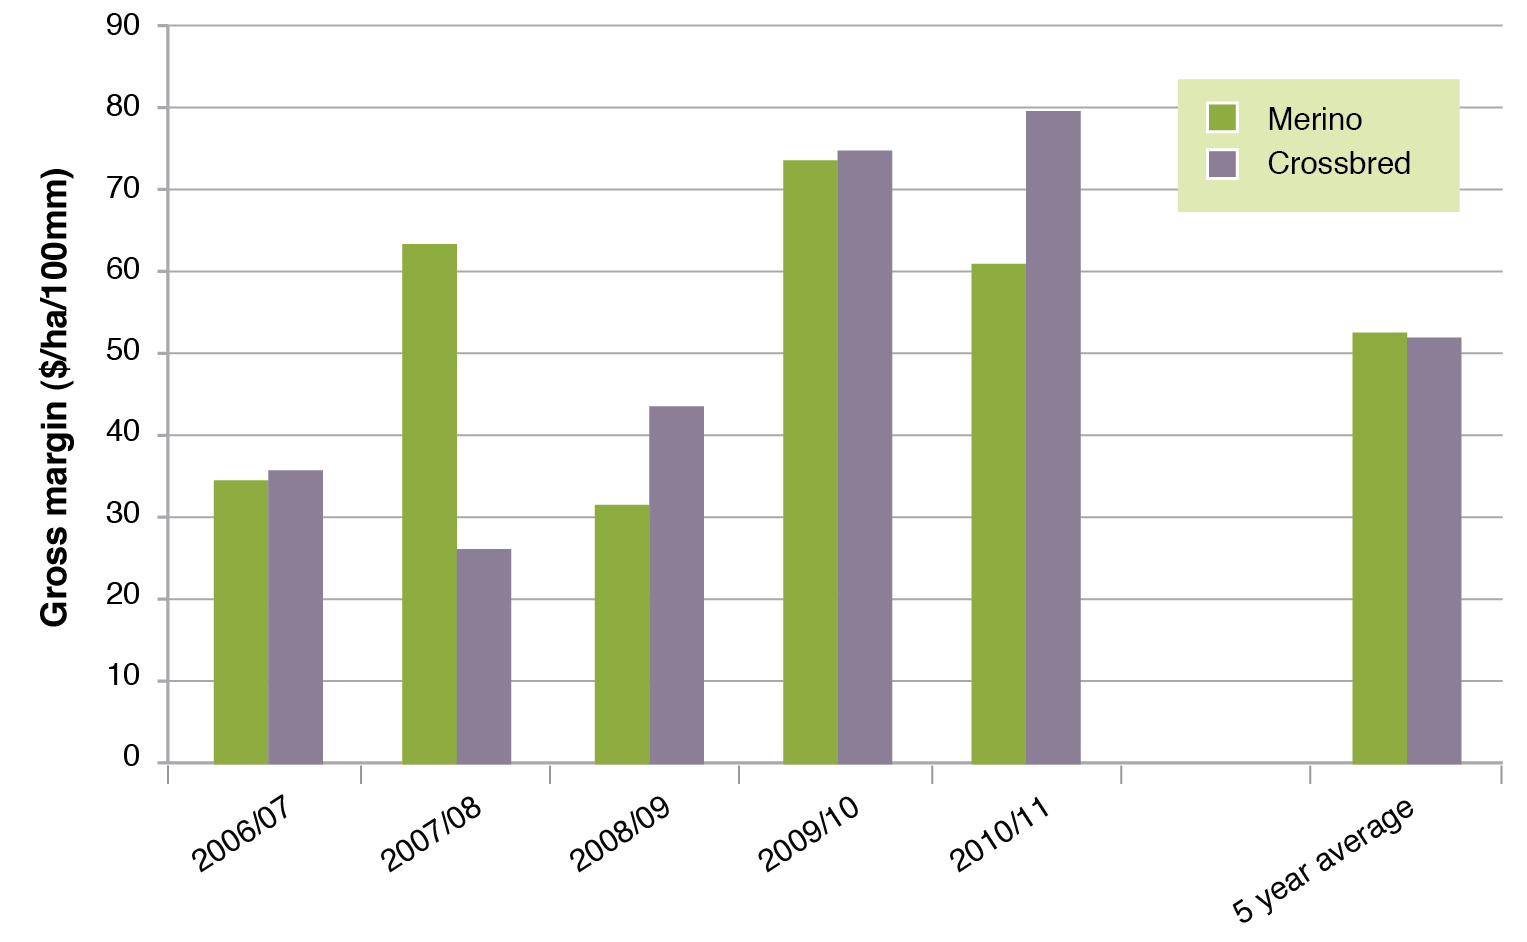
Figure 1. Annual Average Gross Margins as $/ha/100 mm rainfall for south-west farms that run Merino and crossbred ewes as the ewe base for a prime lamb enterprise.
North East Victoria
There is limited historical data available for enterprises other than wool in North East as beef cattle and prime lamb data have only been collected since 2008. The data collated in Table 6 only includes results for 2008-11.
Table 6. Production and financial characteristics of average and high profitability prime lamb enterprises in North East Victoria, 2008 -11 averages.
| Farm parameter | Average all farms | Top 20% |
| Stocking rate (DSE/ha) | 8.8 | 10.3 |
| Marking (%) | 100 | 99 |
| Lamb production carcass weight (kg/ha) | 60 | 74 |
| Wool (kg/ha greasy) | 18 | 22 |
| Net wool price, greasy ($/kg) | $2.20 | $3.98 |
| Average lamb carcass price ($/kg) | $4.28 | $4.38 |
| Pasture costs; $/ha, ($/DSE) | $23 ($2.61) | $24 ($2.33) |
| Supplementary feed; $/ha, ($/DSE) | $24 ($2.72) | $16 ($1.55) |
| Animal health; $/ha, ($/DSE) | $13 ($1.48) | $17 ($1.65) |
| Gross Margin ($/DSE) | $25 | $37 |
| Gross Margin ($/ha) | $220 | $398 |
| Gross Margin ($/ha/100mm rainfall) | $32 | $62 |
Despite small numbers in this data set, the figures in Table 6 reflect similar trends for prime lamb enterprises in South West Victoria. The top performing enterprises had higher stocking rates and meat and wool production per hectare without incurring higher costs. The higher contribution of wool to sheep income may also be due to the mix of both production merino and crossbred enterprises.
Beef cattle
The key characteristics of beef cattle herds surveyed in the South West for 2001-2011 are shown in Table 7. There is a large variation in herd size, so average values are less reliable than for sheep operations. As with prime lamb enterprises there is a diversity of production systems (autumn calving herds, spring calving herds and/or trading operations). This makes comparisons more difficult than for sheep enterprises.
Table 7. Production and financial characteristics of average and high profitability beef enterprises in South West Victoria.
| Farm parameter | Average all farms | Top 20% |
| Stocking rate (DSE/ha) | 15.6 | 20.6 |
| Calving (%) | 88% | 89% |
| Average sale weight (kg/hd) liveweight | 418 | 430 |
| Beef production liveweight (kg/ha) | 314 | 548 |
| Average sale price liveweight ($/kg) | $1.84 | $2.11 |
| Pasture costs; $/ha ($/DSE) | $62 ($3.97) | $104 ($5.05) |
| Supplementary feed; $/ha, ($/DSE) | $90 ($5.77) | $100 ($4.85) |
| Animal health costs; $/ha, ($/DSE) | $18 ($1.15) | $30 ($1.46) |
| Gross margin ($/DSE) | $20 | $40 |
| Gross Margin ($/ha) | $329 | $818 |
| Gross Margin ($/ha/100mm rainfall) | $49 | $118 |
Higher profits are linked to higher stocking rates with similar or better per head production (as sale weight and price), with higher spending on pastures but less per head on supplementary feeding.
The top 20% of farms also contained a high proportion of cattle with a significant trading operation, highlighting the difficulty in achieving good pasture utilization from a dedicated cow/calf operation.
Up to date beef cattle comparisons are available from the AGRICULTURE VICTORIA website at http://agriculture.vic.gov.au/agriculture/livestock/farm-monitor-project
Livestock and Pasture Issues
Key profit drivers for the main livestock enterprises in South West Victoria are stocking rate and kilograms of product (meat and/or wool) per hectare. Labour efficiency is higher and expenditures on pasture through fertiliser is also higher, but expenditure on supplementary feed is less.
Hence, a productive pasture base with a well matched enterprise system, is key to a profitable enterprise.
Some of the resources in the EverGraze website can help optimize pasture production by addressing soil fertility,the best pasture species for purpose and place and improving pasture utilisation by matching the enterprise system (stocking rate and type).
Improve soil fertility
Soil fertility may be optimised through appropriate fertilising and grazing management. Soil type, grazing management, land class, rainfall and cash flow all contribute to requirements for the need to supplement pastures with nutrients. Guidelines for understanding and improving soil fertility for your farm are available in other sections of the EverGraze website:
- Soil testing program and fertilising accordingly,
- Boost winter growth with winter active perennial species and additives that increase winter pasture growth (e.g Nitrogen or Gibberellic Acid),
- Rotational grazing and how that might become part of a grazing and pasture management system,
- Farm planning with smaller paddocks fenced to land class and soil type.
Improve pasture production and length of growing season with the right perennials
Once soil nutrient limitations are removed, pasture production may be optimised in both total quantity produced over the year and/or production in limiting times of the year (eg summer or winter). Options include:
- Pasture renovation with more productive varieties of perennial grasses suited to the soil, slope and enterprise
- Summer active perennials that will respond to summer rainfall (Hamilton EverGraze message – lucerne reduces risk and provides options).
Match the feed demand from the livestock to the feed supply (from the pasture)
Returns from productive pastures can only be made if the pastures are well utilised.
Stocking rates are highly dependent on
- Fertility of pasture systems driving growth,
- Length of the growing season driven by climate, soil fertility and pasture species,
- Matching of feed supply to animal demand (linked to lambing/calving date) (see EverGraze Exchange – Livestock Systems and Wagga Wagga Proof site,
- Producers attitudes to risk and poor seasons.
The response of pastures to phosphorus was reinvigorated in the mid 1990’s with the Long Term Phosphate Experiment at Hamilton and the associated Grasslands Productivity Program. Farmers around the state tested the animal and pasture production and profit response to applying capital rates of fertiliser (mainly phosphorus) on their own farms. The result was a significant lift in average phosphorus use and stocking rates as illustrated in Figure 2, despite an overall decline in wool price.
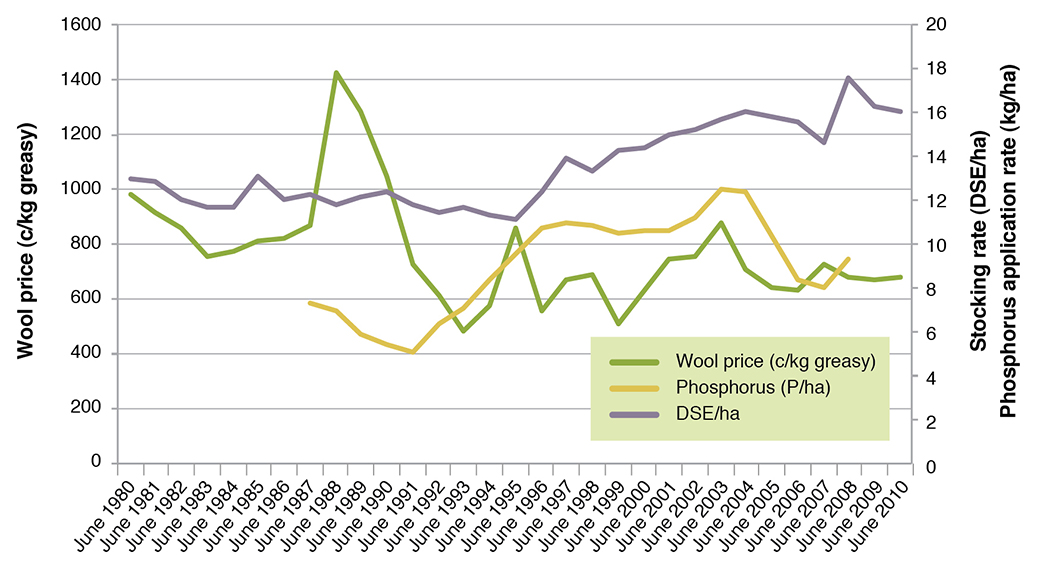
Figure 2. Changes in stocking rate, wool price and phosphorus application in western Victoria (Source Livestock Farm Monitor Project)
The Grasslands Productivity Program run in the 1990’s developed optimum stocking rates based on soil fertility (as Olsen P), length of the growing season and paddock size. Smaller paddocks can make efficient grazing management and pasture utilization easier. Table 8 shows estimated optimum stocking rates using these criteria.
Table 8. Optimum stocking rate (as DSE/ha) based on length of growing season (months), Olen P (mg/kg) and paddock size.
| Growing season (months) | 5 | 6 | 7 | 8 | 9 | 10 | 11 | 12 |
| DSE/ha for paddocks less than 20 ha | ||||||||
| Olsen P 10 mg/kg | 11 | 14 | 17 | 20 | 24 | 28 | 31 | 34 |
| Olsen P 20 mg/kg | 12 | 16 | 19 | 23 | 26 | 29 | 33 | 36 |
| DSE/ha for paddocks more than 20 ha | ||||||||
| Olsen P 10 mg/kg | 8 | 11 | 15 | 18 | 21 | 25 | 28 | 32 |
| Olsen P 20 mg/kg | 10 | 13 | 16 | 20 | 23 | 27 | 30 | 33 |
