Integration of native and improved pasture systems increases profit
Integrating management of improved and native pastures by grazing with a single flock of ewes is more profitable than grazing ewes and wethers separately.
Key findings
- An ‘Integrated’ system, where a single mob of ewes were grazed across native (63%) and phalaris-based (37%) pastures, produced 136-225 kg/lamb/ha and 11-18 kg wool/ha. A ‘Separate’ system, where ewes and lambs were rotated on phalaris-based pastures and wethers were set stocked on native pastures, produced 75-156 kg lamb/ha and 18-21 kg wool/ha.
- There were no treatment differences in lamb weaning weights (24-35 kg/hd), weaning percentages (92-141%) or ewe clean wool production per head (2.7-3.8 kg/hd).
- Gross margins of the Integrated system were significantly higher than the Separate system under all of six price scenarios for wool and lamb in 2008, and in five of six price scenarios for 2009 and 2010.
- The Integrated system was capable of significantly increasing stock pressure (to 17 DSE/ha) to manage annual grasses in native pastures in early spring compared to the Separate treatment which remained at 4 DSE/ha throughout the year. Stock pressure could be completely removed in summer in the native pasture to allow native grasses to set seed. However, given the short period of the experiment, and the variable seasons, there were no treatment differences in pasture composition.
|
|
|
Read more about this research
The opportunity
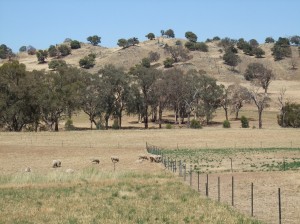
Where graziers have maximised the opportunity to improve pastures on arable parts of their land, then there is an opportunity to increase profitability by increasing productivity of native pastures on non-arable hill country. Native pastures in North East Victoria and Southern NSW are traditionally grazed by dry stock such as wethers. Production from these areas can be increased by increasing pasture growth and quality with fertiliser, making the pastures suitable for higher value breeding stock. However, the increased fertiliser inputs and stocking rates often come at the cost of the important native perennial species in those pastures. One way of managing the persistence of the native perennial component is to increase grazing pressure in spring to control competition from fertiliser-responsive (nitrophilous) annual species, and reduce grazing pressure in summer, allowing recruitment and/or vegetative spread of the natives. The question is whether this is an achievable and profitable way to manage native pastures, while managing feed supply and demand on areas sown to improved perennials.
The Holbrook Proof Site tackled this question with a comparison of two sheep systems grazing native pasture on non-arable country and phalaris on arable country. This page describes the theory behind the two systems and an economic analysis. Seasonal conditions and the length of the experiment at Holbrook prevented statistically significant treatment differences in pasture composition being observed, however important insights into influences of management strategies and rainfall on composition and persistence of native pastures (and phalaris at Holbrook) across Proof and Supporting Sites can be found in the Chiltern/Holbrook and Orange Proof Site composition messages. The dynamics of native pasture composition and production under different fertiliser and grazing regimes (leading to the design of the EverGraze native experiments) are also provided in Virgona 2007. Livestock production responses on native pastures are also provided for Chiltern and Orange.
What was done?
Holbrook grazing systems
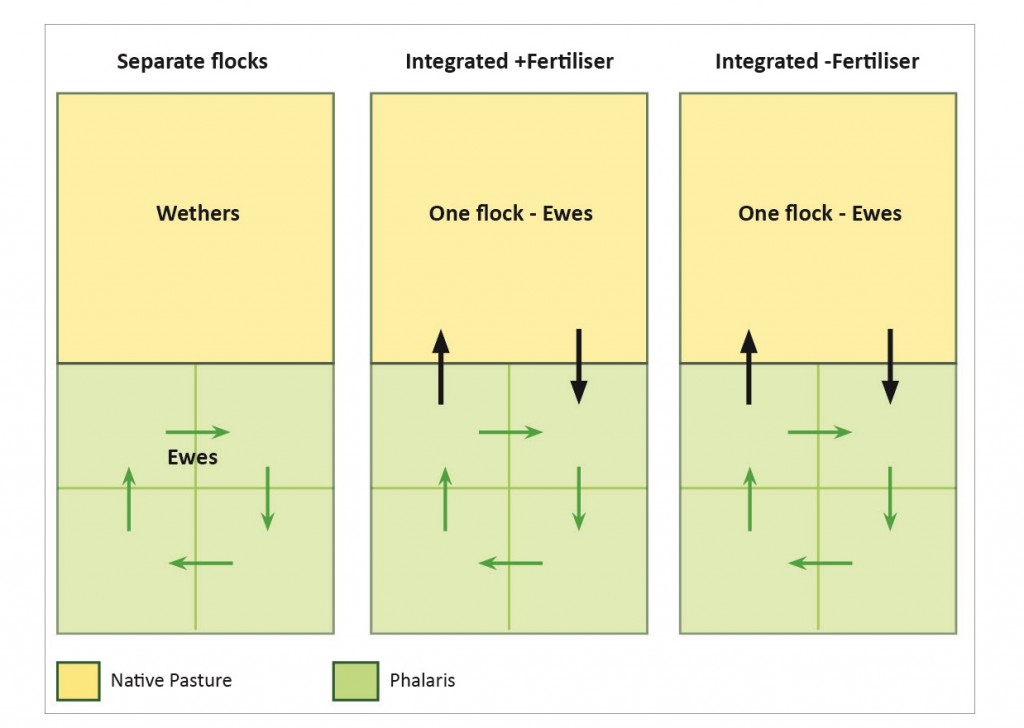
Two grazing systems were evaluated at Holbrook from 2008-2010 and are represented in Figure 1. The traditional approach (Separate treatment) of placing higher value breeding stock on improved pastures (phalaris, cocksfoot, sub clover) with lower value dry stock (wethers) on native country was compared against a single breeding flock that grazed across both pasture types (Integrated). In a third treatment (run from 2009-2010), the Integrated system was run with no fertiliser inputs on native pastures. The phalaris pastures in each treatment were 1 ha (37%) while the native pastures were 1.7 ha (63%). Merino ewes (CentrePlus) joined to terminal sires were used in both systems with Merino wethers grazing the native pastures in the Separate treatment.
|
|
Management
Phalaris pastures were subdivided into four cells and grazed on a two week on, six week off basis, as for the Simple Rotation regime in the Broadford Grazing Experiment. In the Separate system this management was applied throughout the experiment. In addition, wethers were set stocked on the native pasture at rates from 3-5 DSE/ha throughout the experiment.
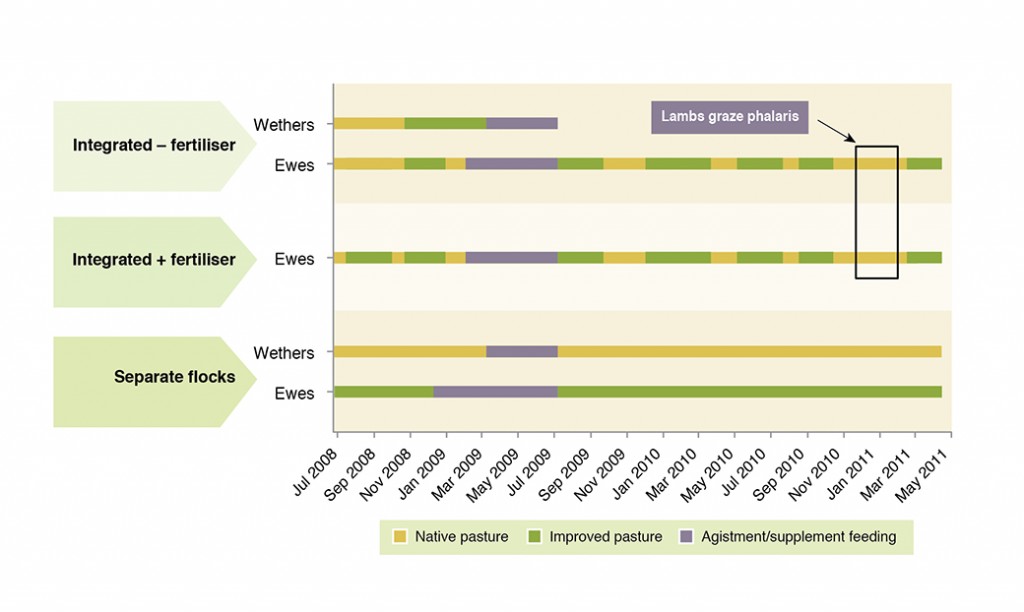
In the Integrated systems, ewes and lambs were moved after marking onto the native plots (usually mid-October) to increase grazing pressure on the early maturing annual species. Thereafter, they returned to the phalaris and grazed similarly to the Separate treatment, allowing later flowering native grasses to grow and set seed.
In 2008 and 2009, lambs were sold after weaning. Ewes remained on the phalaris until a late summer-early autumn grazing of the native plots took place to utilise any green feed.
In 2010, the lambs were weaned onto the phalaris pasture in late December and ewes left on the native pasture until early February. Otherwise the only other time the native pasture was grazed was for a short spell in mid-winter as dictated by feed availability and quality. Figure 2 shows the stock movements for the various treatments.
|
|
What was found?
Rainfall
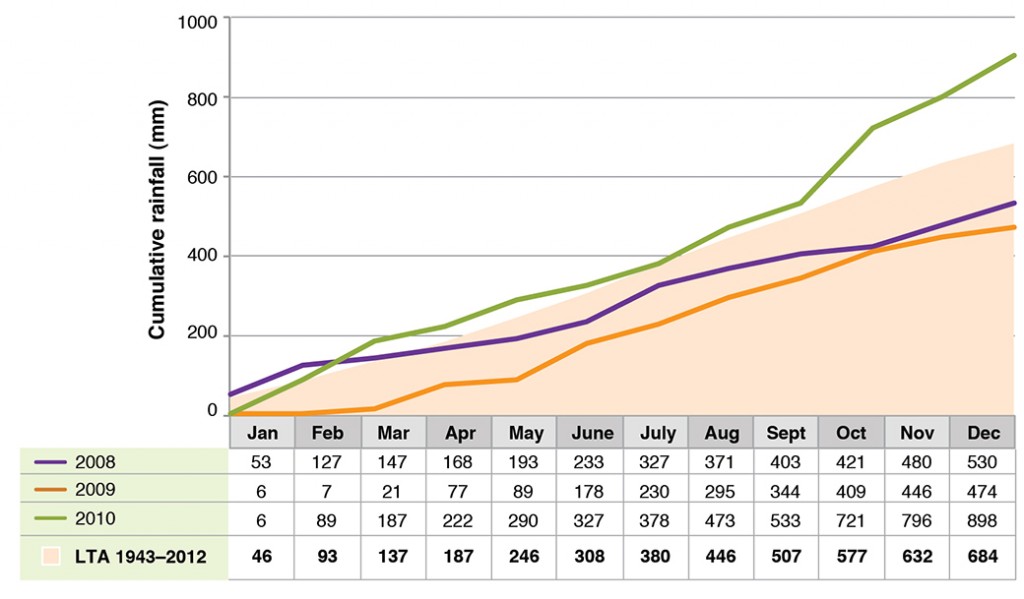
Rainfall was below average in 2008 and 2009 and well above average in 2010 (Figure 3).
|
|
Further details on climate conditions during the experiment can be found on the Proof Site Climate page.
Climate trends for the region can be found on the Regional Context Climate page.
Annual average stocking rates
Stocking rates were originally set at 8.3-8.8 DSE/ha in 2008 and were subsequently reduced back to 5.0-5.3 with the dry season in 2009 (Table 1). They were increased with more favourable conditions in 2010, although rainfall was so high in that year that pastures were under-utilised.
Table 1. Annual average stocking rates at Holbrook Proof Site 2008-2009
| 2008 | 2009 | 2010 | |
| Separate | 8.3 | 5.3 | 7.4 |
| Integrated + fertliser | 8.8 | 5.3 | 8.0 |
| Integrated – fertiliser | 5.0 | 7.7 |
Feed on offer
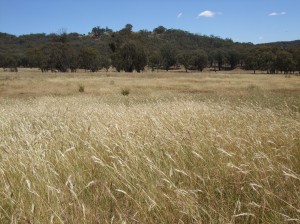
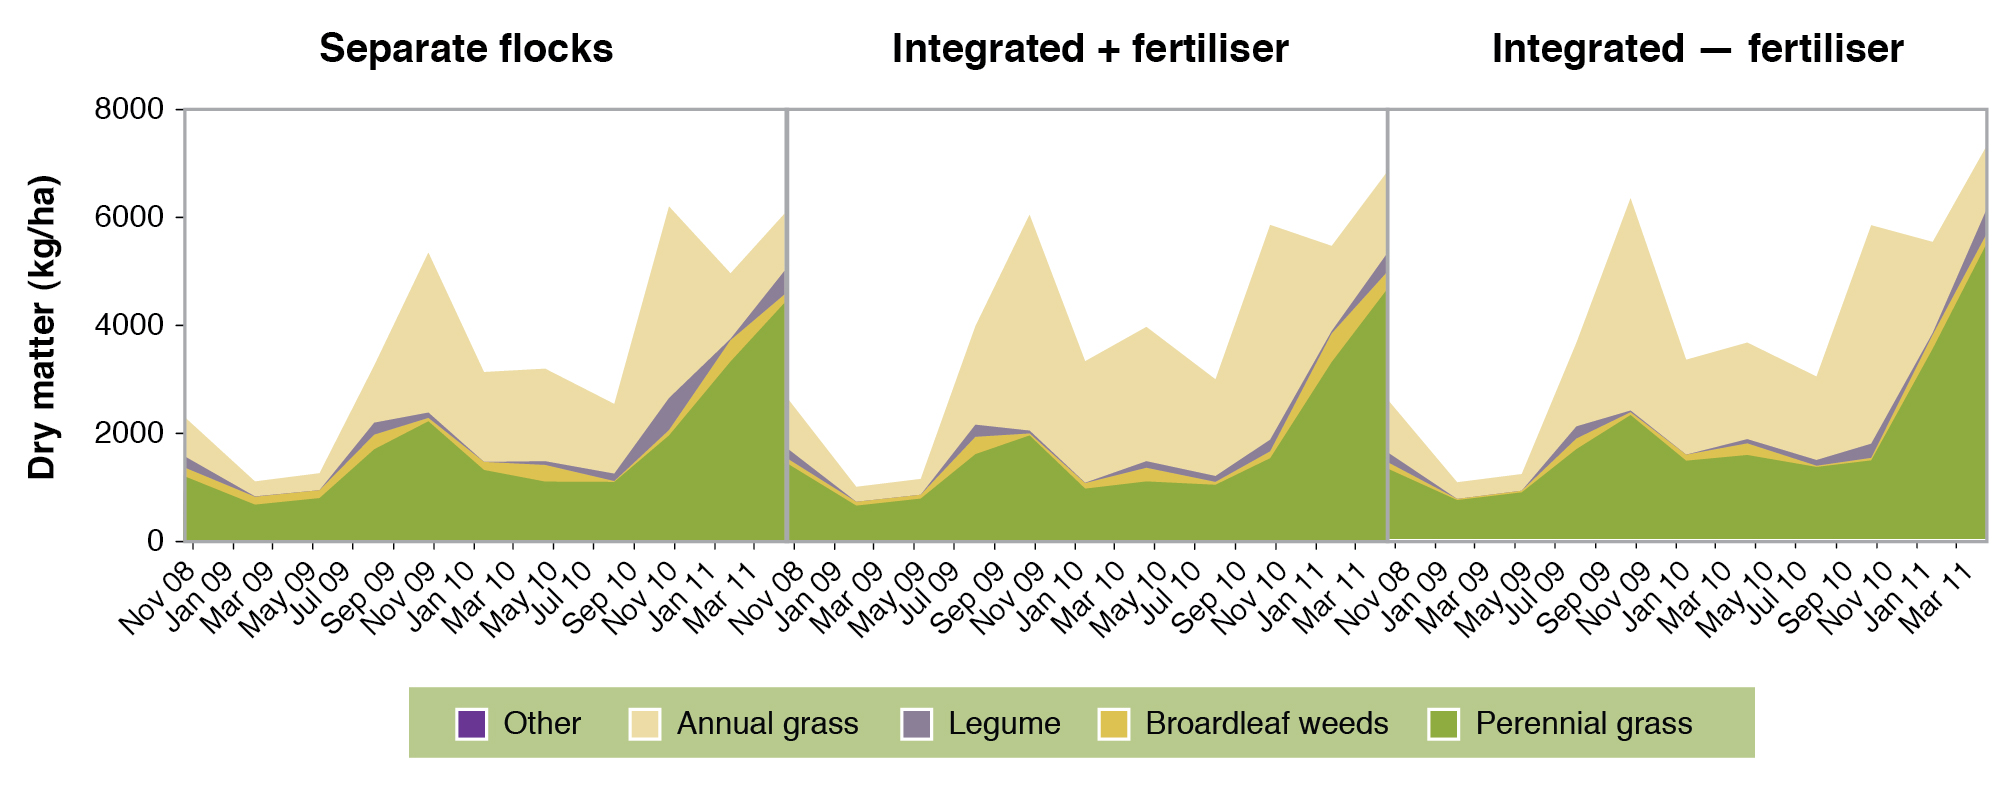
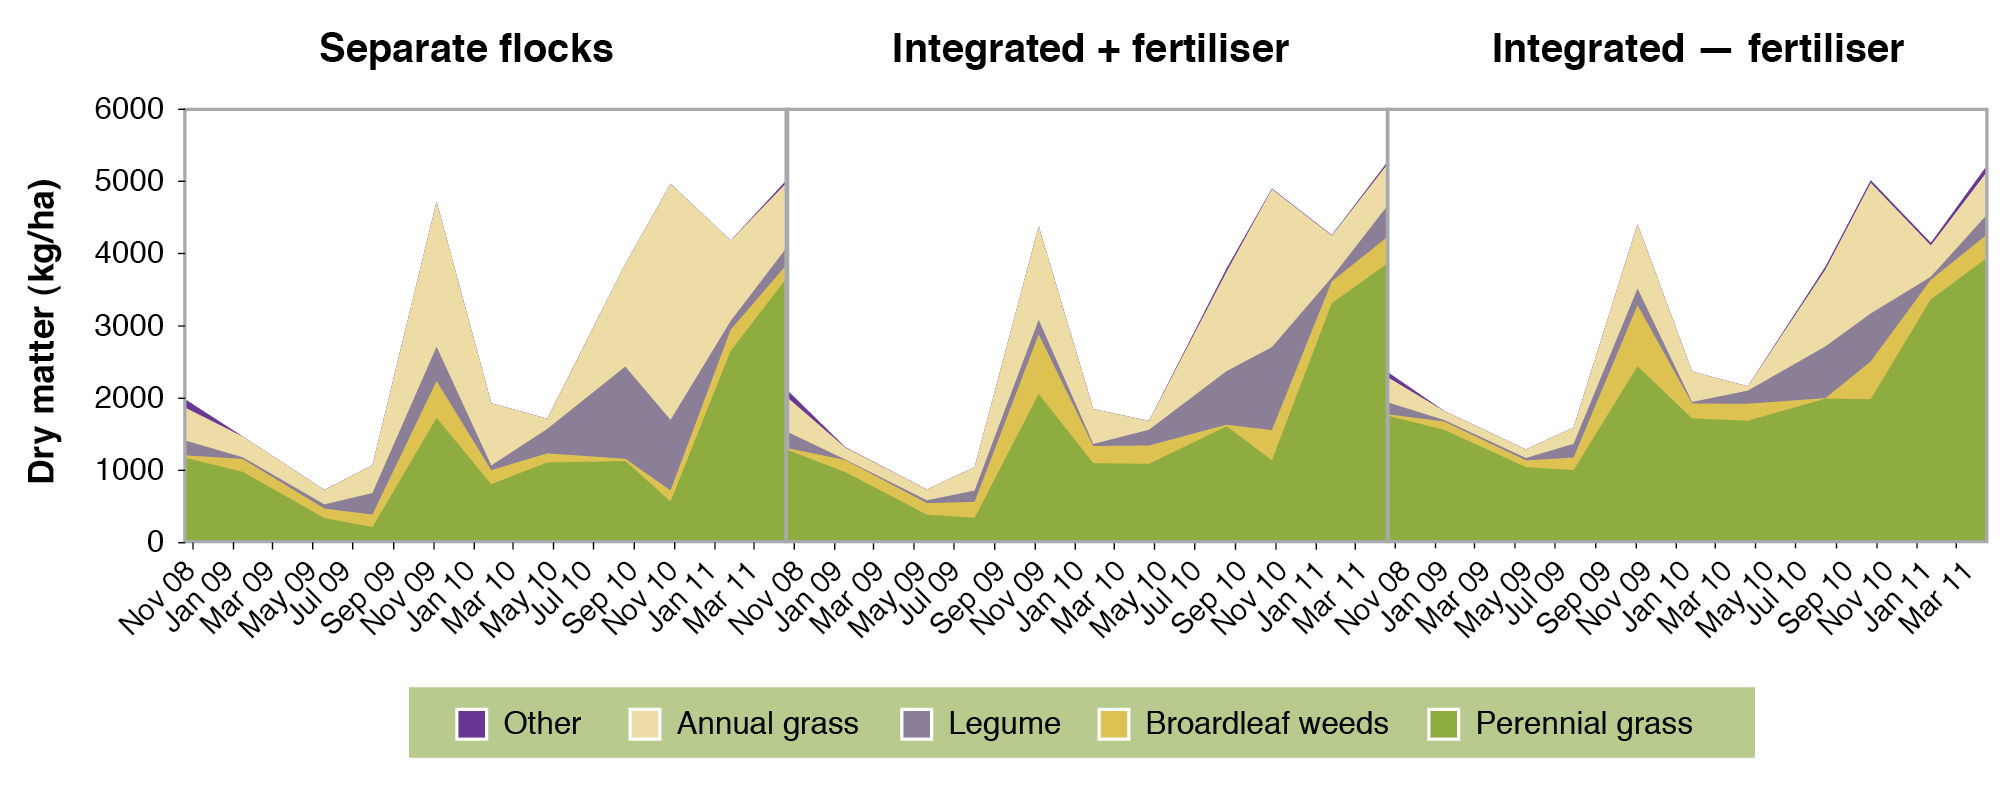
Feed on offer (FOO) for the phalaris and native sites (averaged across all treatments) are presented in Figures 2 and 3. Low utilisation during 2010 was evident in both the native and phalaris. Both sites had a high proportion of annual grass species. In the phalaris, this was mostly barley grass while in the native pasture, both barley grass and silver grass were present. Both sites had a low clover percentage until 2010 when the clover in the native site improved with high rainfall in that year. The presence of sub clover in the native site pasture was important for feed quality and response to fertiliser inputs (see the Livestock production key message). However, it also highlighted the need to stay on top of nitrophilis annual grasses during spring to ensure persistence of the native component. Further results and discussion on composition and basal cover are provided in the Composition message.
|
|
|
|
Stocking rate profiles on phalaris and native
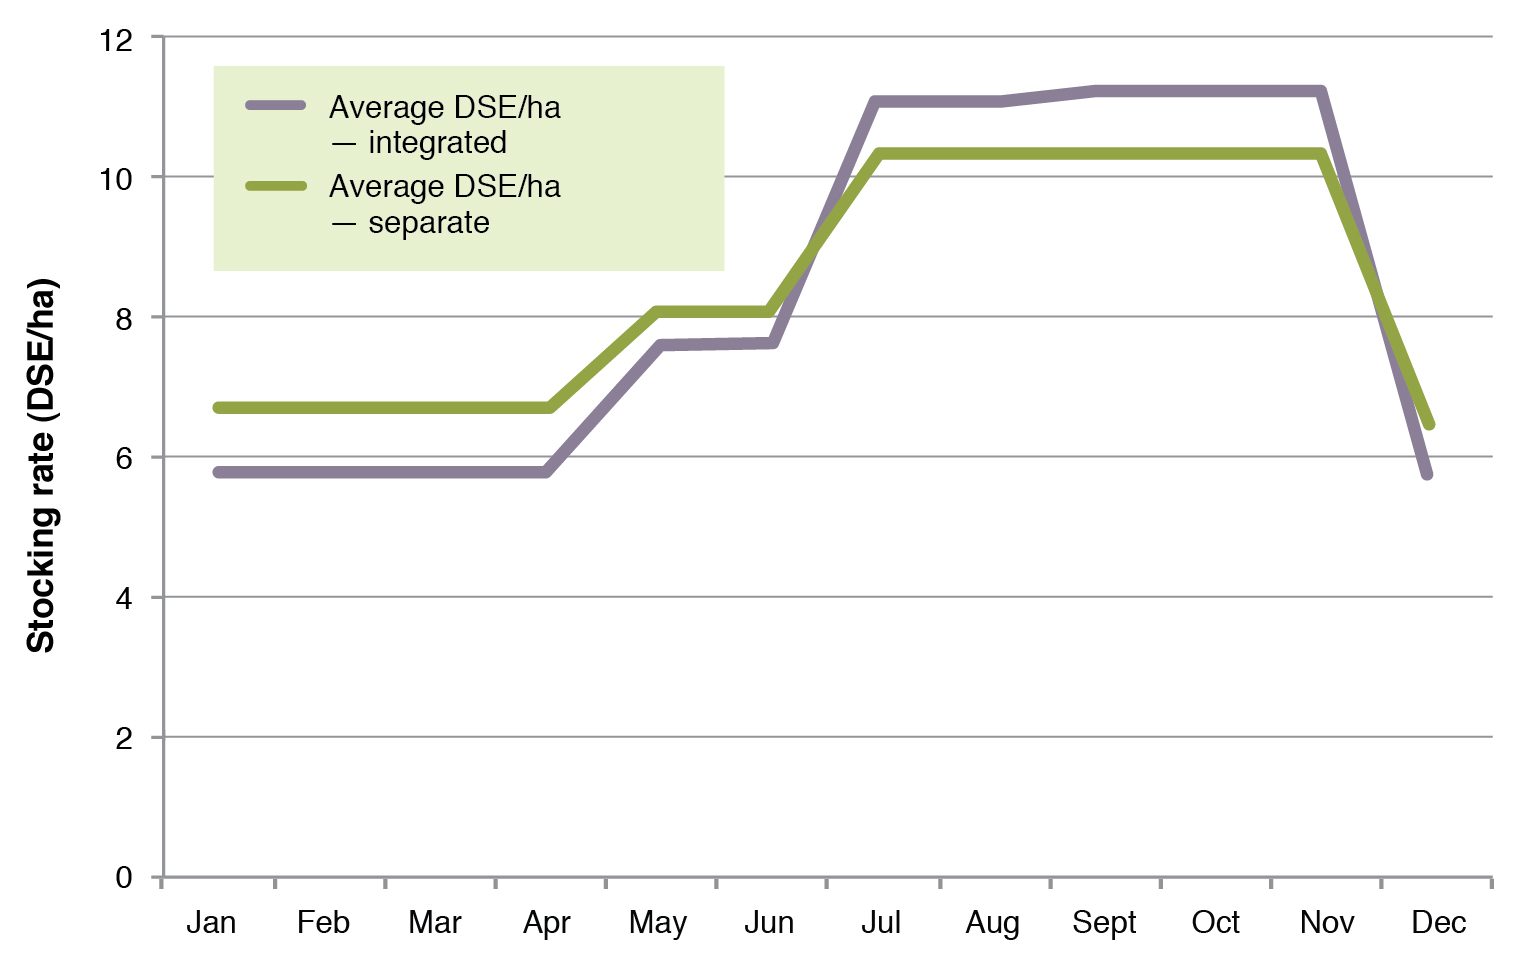
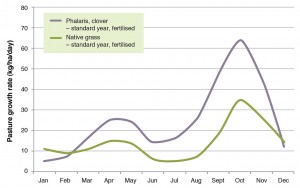
Using the EverGraze stocking rate calculator, monthly stocking rates were calculated for the Integrated and Separate treatments at hypothetical annual average stocking rates of 8 DSE/ha (Figure 6). The Integrated system had a slightly higher late winter/spring stocking rate and a lower summer/autumn stocking rate, which is a slightly better match with standard pasture growth curves, although the difference is small (Figure 7).
|
|
|
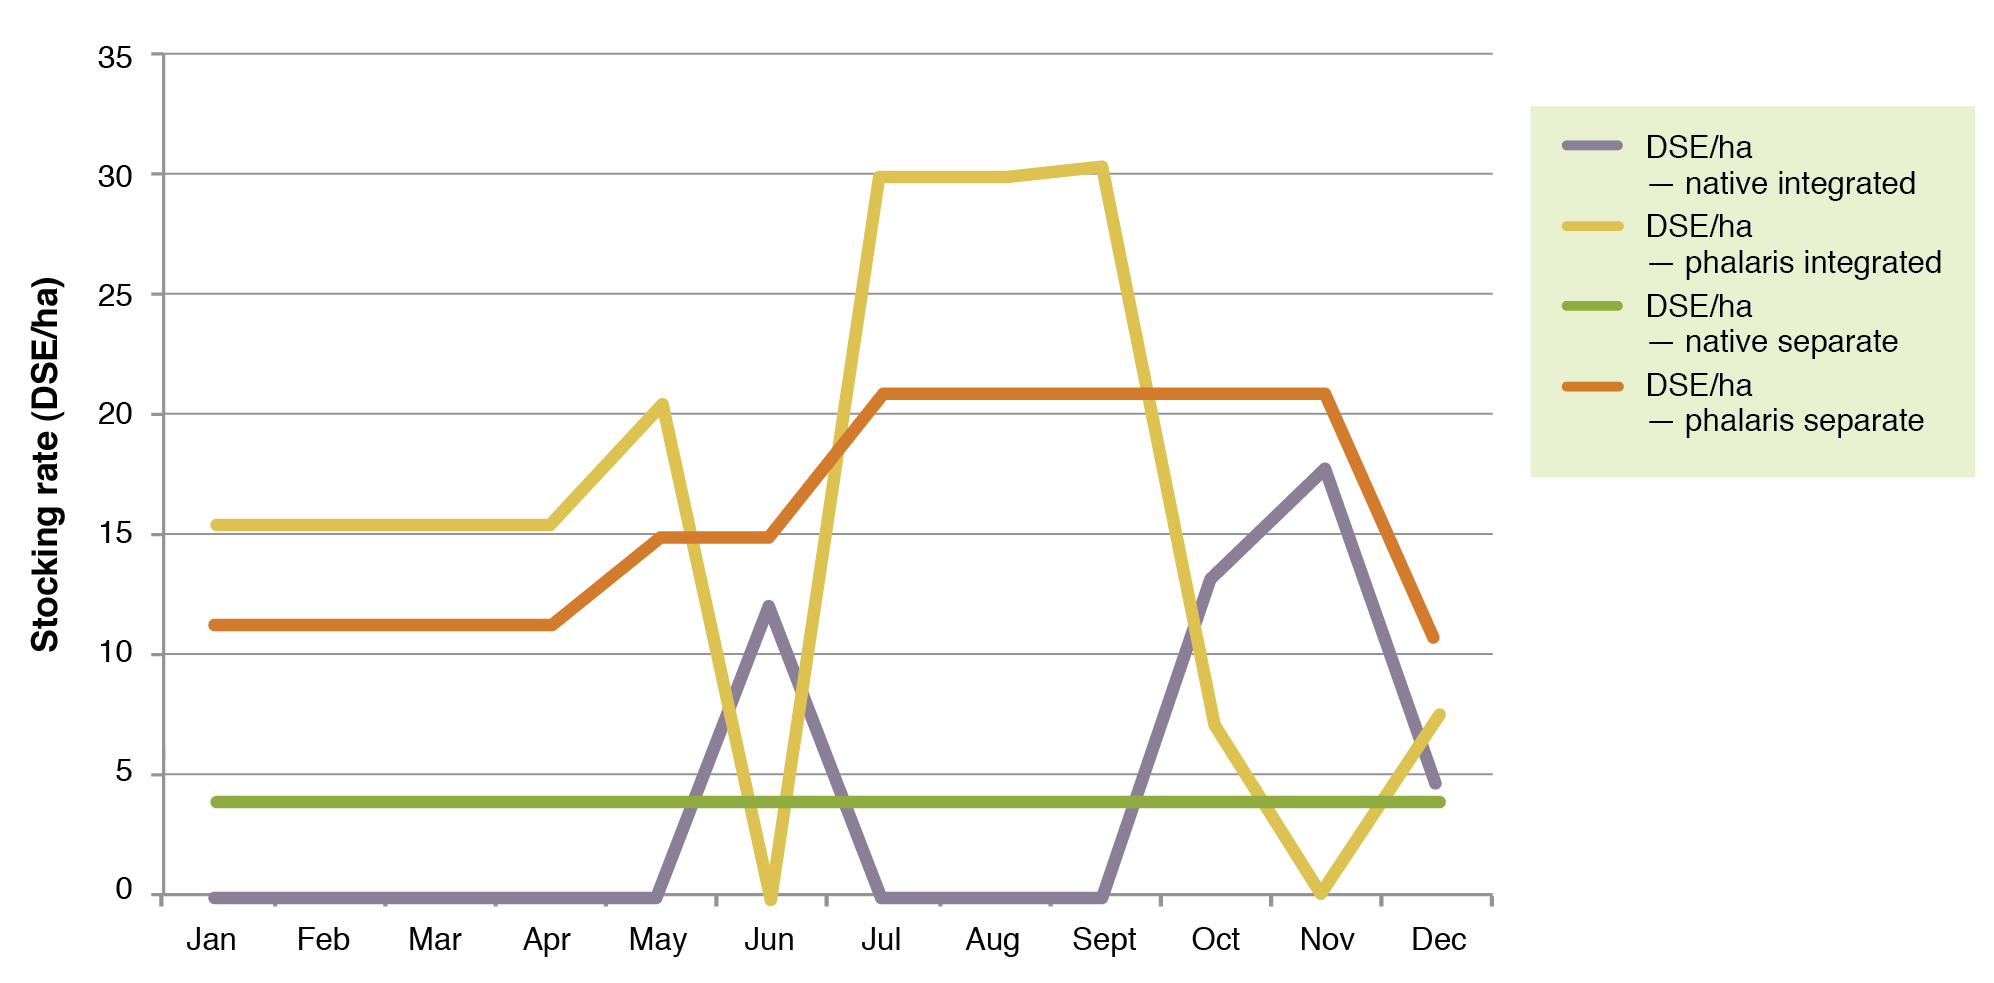
Monthly stocking rates can also be calculated for the different pastures within the systems (Figure 8). In this scenario, wethers in the separate treatment are grazed at 4 DSE/ha year-round and ewes are grazed on the phalaris at an annual average stocking rate of 16 DSE/ha. In the Integrated treatment, ewes are grazed on the native pastures for the month of June and from the second week of October to mid-December. The annual average stocking rate on the phalaris and native remains at 16 DSE/ha and 4 DSE/ha respectively. This highlights the high capacity for the Integrated system to increase grazing pressure on the native pasture in spring (helping to get on top of nitrophilis annual grasses), and allowing the natives to rest through summer. However, grazing pressure is removed from the phalaris at the peak growth period during October. This may be useful during failed springs such as those experienced in 2008 and 2009, but measures such as cutting hay or silage may be needed to stay on top of phalaris in wetter years such as that experienced in 2010.
In the Integrated system, grazing pressure on the phalaris is relieved in June and then stocking rate increases to 30 DSE/ha through July, August and September for lambing. The resulting average winter stocking rate (June-August) is similar for both treatments (20 DSE/ha and 19 DSE/ha for the Integrated and Separate treatments respectively).
|
|
Production
There were no significant treatment differences in lamb weaning weight, indicating that during the time lambs grazed the native pastures in the Integrated treatment (October and November), growth of the lambs was not compromised compared to lambs grazing phalaris. Similarly, there were no significant treatment differences in ewe wool production per head.
At 92%-141%, weaning percentages were well above regional averages which were 72% in 2009 and 78% in 2010. This is likely to have been influenced by the small mob sizes (between 6 and 14 ewes per plot), as well as good genetics (Centre Plus Merinos), and managing to Lifetimewool condition score and FOO targets.
There were significant treatment differences in the lamb and wool production per hectare. This stands to reason given there were more ewes (and lambs) in the Integrated system and more wethers in the Separate treatment.
Table 2. Production results from Holbrook EverGraze Proof Site
| 2008 | Lambing% | Weaning % | Weaning weight | Sale weight | Lambs/ha | kg lamb/ha | Ewe kg wool/hd | Wether kg wool/hd | Kg wool/ha |
| Separate | 154 | 126 | 32 | 32 | 5 | 156 | 3.8 | 4.2 | 22.5 |
| Int+F | 164 | 141 | 29 | 29 | 7.6 | 225 | 3.4 | 18.4 | |
| lsd (P<0.05) | ns | ns | ns | ns | 1.2 | 39 | ns | 0.7 | |
| 2009 | Lambing% | Weaning % | Weaning weight | Sale weight | Lambs/ha | Lamb kg/ha | Ewe kg wool/hd | Wether kg wool/hd | Kg wool/ha |
| Separate | 144 | 122 | 34 | 34 | 2.2 | 76 | 3.5 | 4.8 | 18 |
| Int+F | 132 | 117 | 34 | 34 | 4 | 136 | 3.4 | 11.4 | |
| Int-F | 151 | 135 | 35 | 35 | 4 | 142 | 3.7 | 11.5 | |
| lsd (P<0.05) | ns | ns | ns | ns | 0.6 | 21 | ns | 0.7 | |
| 2010 | Weaning % | Weaning weight | Sale weight | Lambs/ha | kg/ha | Ewe kg wool/hd | Wether kg wool/hd | Kg wool/ha | |
| Separate | 96 | 23 | 29 | 2.6 | 75 | 2.7 | 5 | 20.9 | |
| Int+F | 92 | 26 | 30 | 4.6 | 138 | 2.8 | 14 | ||
| Int-F | 102 | 24 | 29 | 4.9 | 145 | 3.1 | 14.9 | ||
| lsd (P<0.05) | ns | ns | ns | 0.9 | 29.7 | ns | 0.7 |
Crunching the numbers
As this was a systems experiment, it is more appropriate to analyse plot profitability rather than physical outputs. An analysis of variance was conducted on the gross margin – which had to be calculated for each plot. The results were heavily dependent on the prices used for lamb and wool. Figure 9 shows a time series of the last 20 years of prices of the 19 micron wool indicator and the 18-22 kg dressed lamb price. It is clear that the prices of both commodities have fluctuated widely over the last 20 years. Instead of selecting a fixed (averaged) price, a range of price scenarios were analysed. The scenarios were arrived at by analysing the proportion of time in the last 20 years that prices of both commodities had remained within quartile boundaries. The proportion of the last twenty years that prices have remained within these groups is presented in Table 3.
|
|
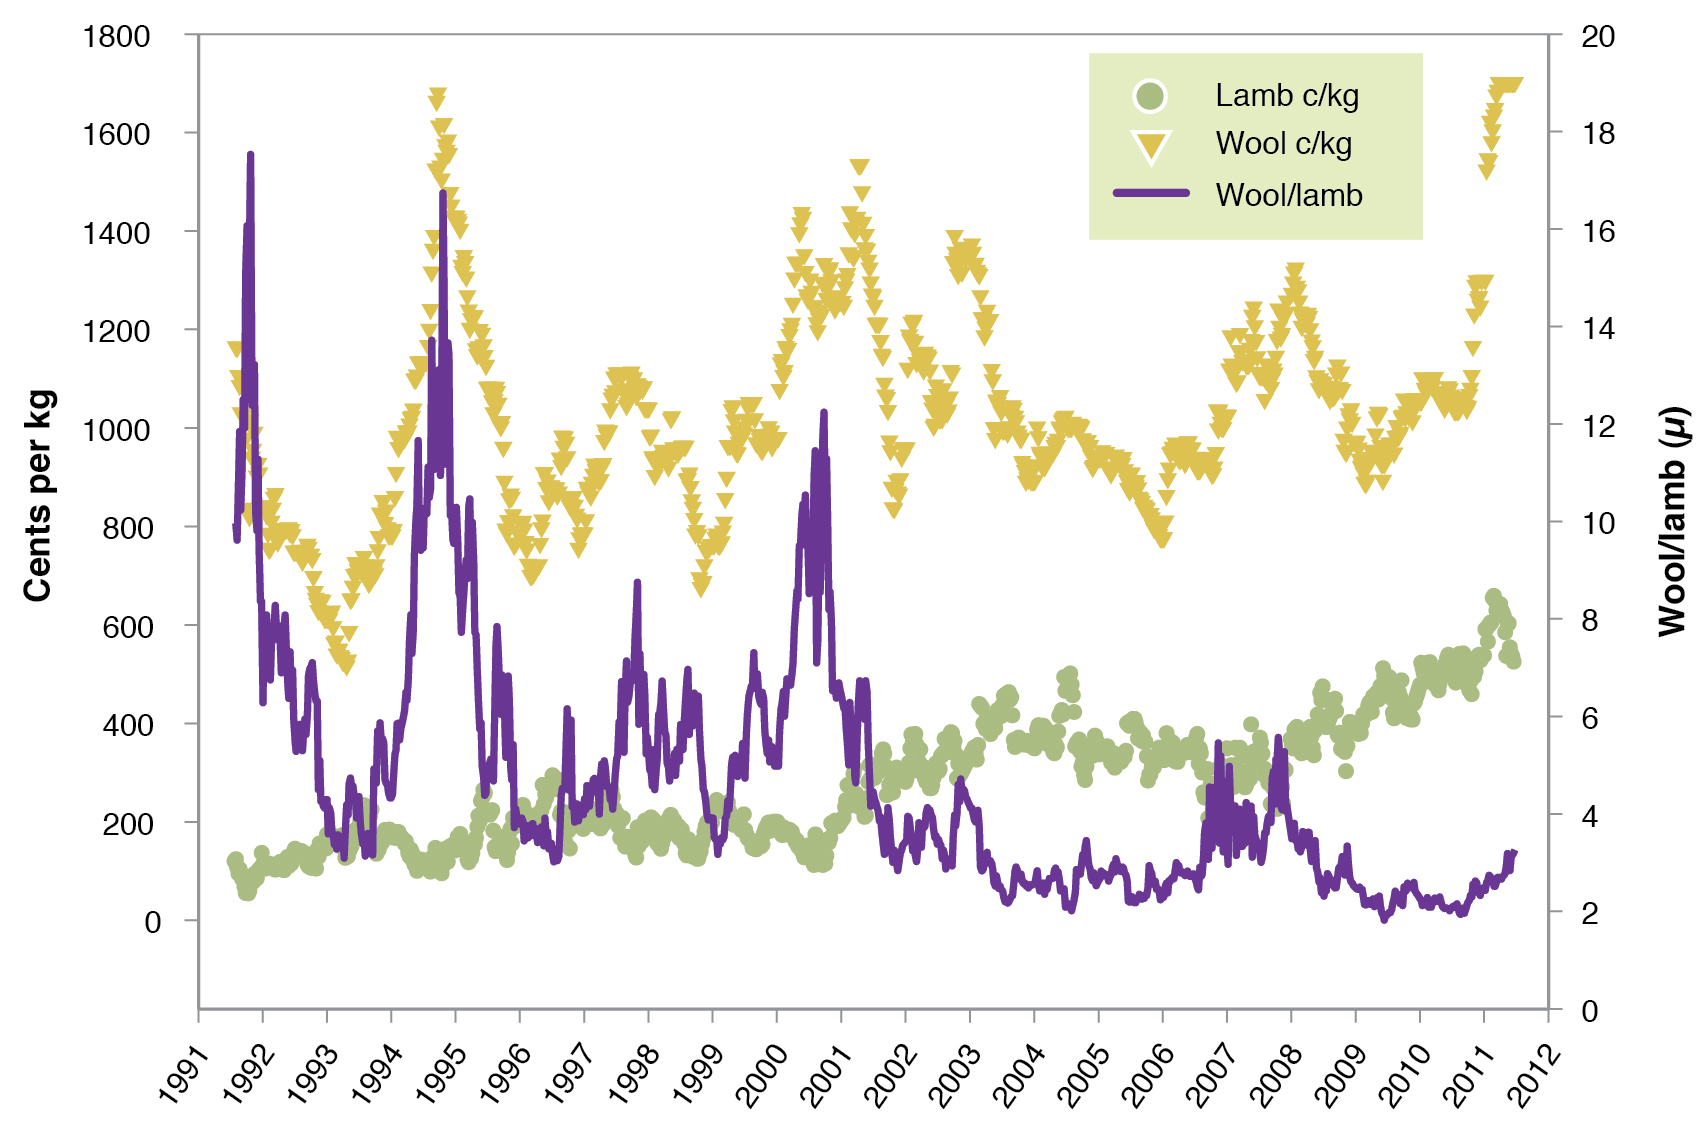
Table 3: Proportion (%) of the period 1991-2011 that lamb and wool prices have occurred within the specified quartile limits. The figures in bold were selected for scenario analysis
| Wool | ||||
| Lamb | Lower | 2nd | 3rd | Upper |
| Lower | 10.2 | 3.4 | 4.2 | 7.3 |
| 2nd | 9.2 | 7.1 | 4.2 | 4.6 |
| 3rd | 3.7 | 8.7 | 5.2 | 7.4 |
| Upper | 1.9 | 6.2 | 11.1 | 5.7 |
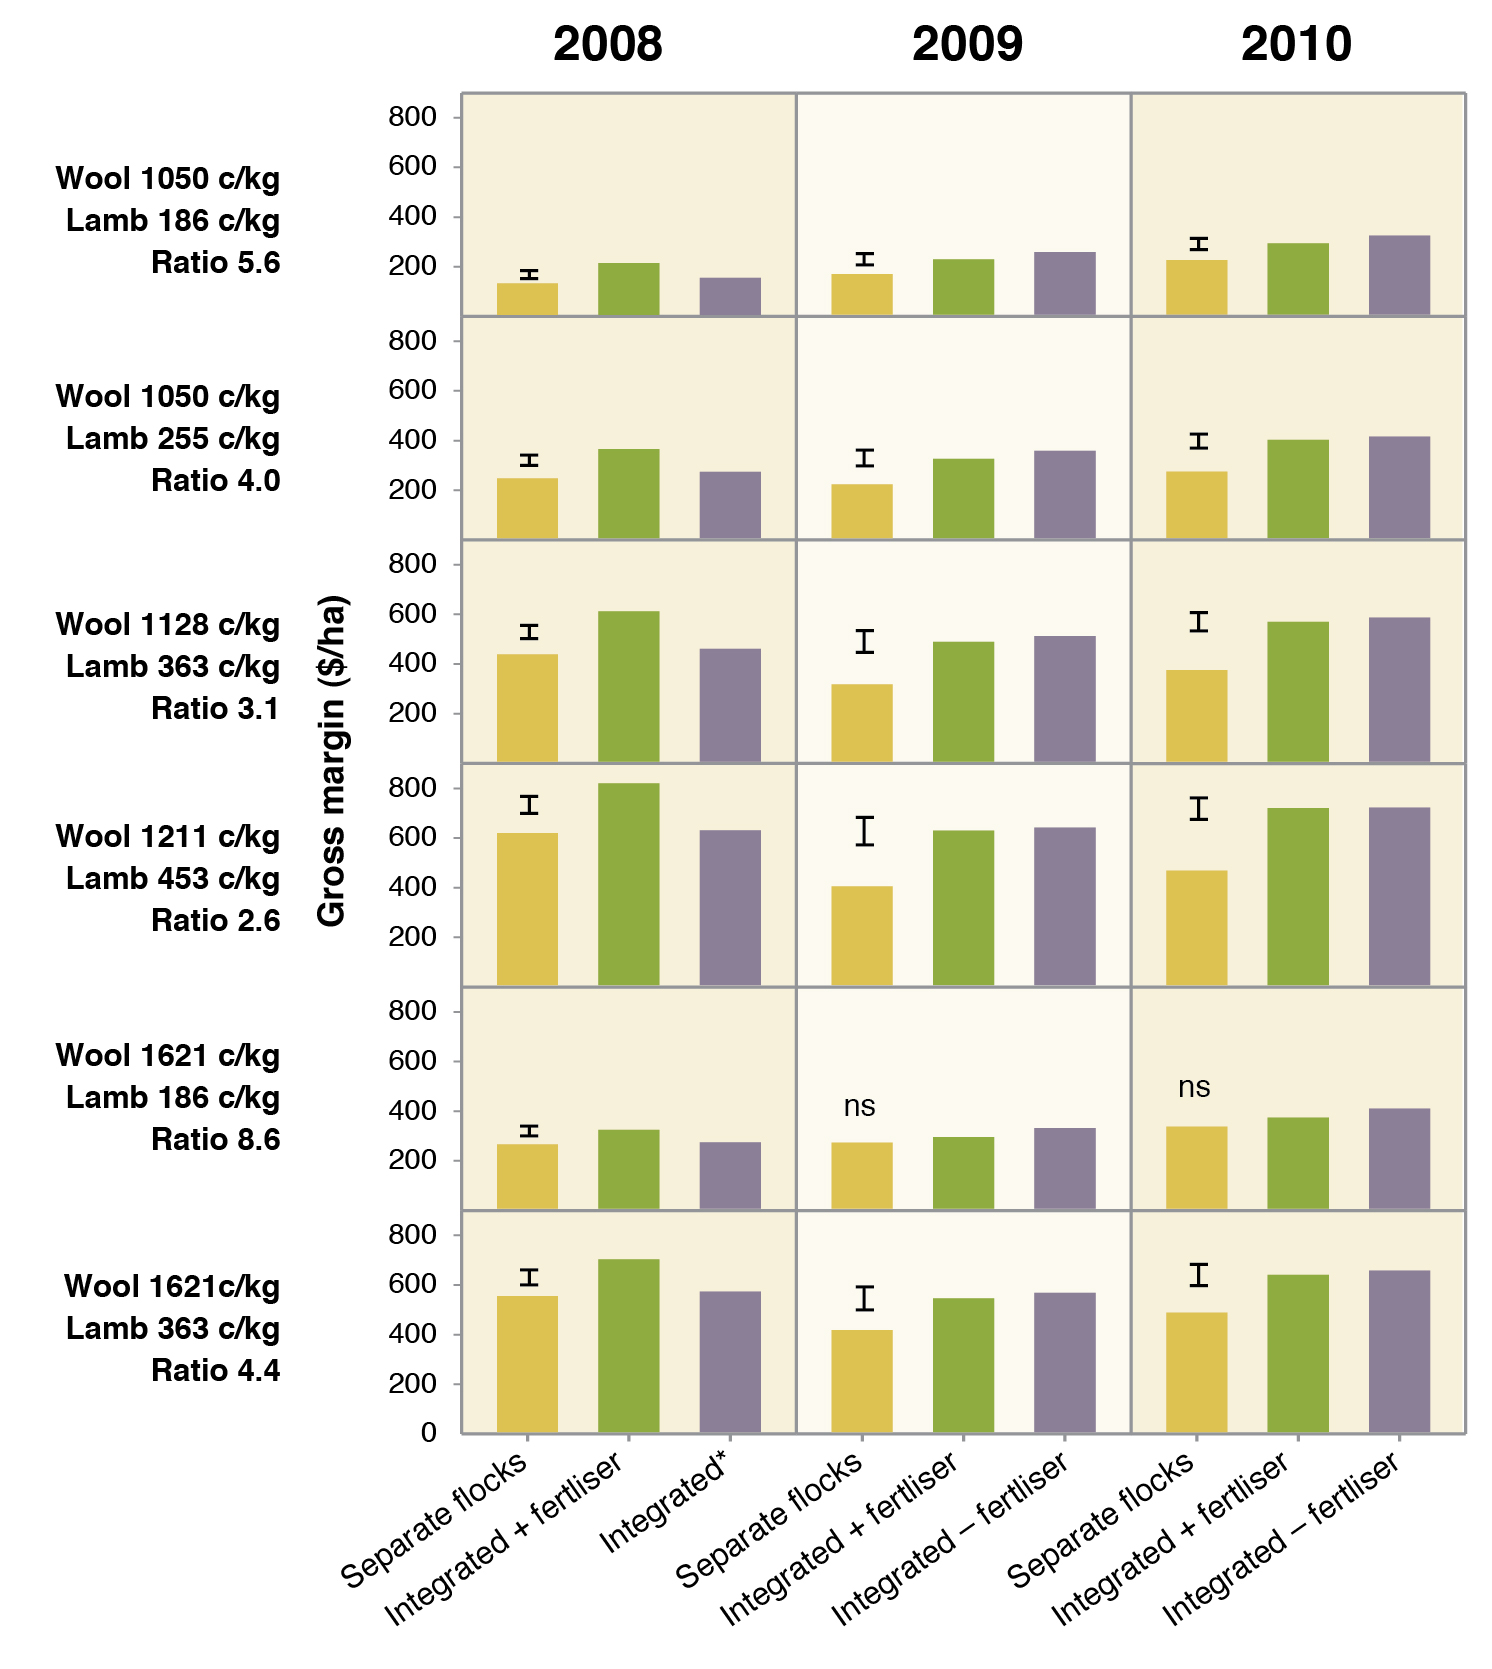
Gross margins were calculated for each plot using actual plot data except the weaning percentage which was averaged across all treatments for each year (as there were no significant treatment differences in weaning percentages, even though they did vary considerably). The results are presented in Figure 10.
Due to the fact that the Integrated -fertiliser treatment was not imposed over the duration of the experiment, comments are confined to differences between the Separate and Integrated+ fertiliser treatments. It is clear that the Integrated +fertiliser treatment returned significantly greater gross margins for five out of the six price scenarios across the years. It is also evident that the price scenarios clearly affect the proportional advantage of the Integrated +fertiliser treatment over the Separate treatment. The favourable outcome for the Integrated treatment is a result of price relativities between lamb and wool.
|
|
Putting the research into practice
The Holbrook Proof Site results indicate that integrating the management of native and improved pastures with reproductive stock is more profitable than running ewes and wethers separately. However, the most suitable management regime for an individual farm will depend on a range of variables. Some considerations are provided below.
Ewes, wethers or cattle?
Enterprise selection and target markets are dependent on several factors such as skills and passion of the farmer, labour requirements, suitability of the land, pastures and infrastructure, existing livestock capital, as well as profitability. These factors are considered in the EverGraze Exchange – Livestock systems for profitable and sustainable use of perennial pastures.
If considering increasing the proportion of ewes compared to wethers, consider the proportion and quality of native pastures on the farm. At Chiltern, lambs grew at acceptable rates for store lamb production on a low fertility Microlaena-based native pasture. On a high fertility native pasture at Orange, lambs could be taken to finished weights in some years. However, native pastures based on lower quality species such as spear grass and kangaroo grass, and with low clover content, are unlikely to be suitable for lamb production. These pastures may at times be suited to cattle, or dry sheep (see Woomargama and Spring Valley case studies below).
On-farm experience
When to graze native pastures
The timing of grazing will depend on the objectives for management of the pastures and livestock. Strategies for grazing native pastures are described in the EverGraze Action – Managing native pastures in Victoria, the Chiltern EverGraze Proof Site Composition key message, and the EverGraze Exchange – Nuts and Bolts of Grazing Management.
At Holbrook, native pastures were grazed between October and mid-November, rested for summer, and grazed again for a short period in June. The spring graze helps to reduce competition from annual grasses, clovers and broadleaf weeds, and at Holbrook, there was no penalty to lamb production by using the native pastures during this period. The summer rest allows native grasses to produce seed. The June graze helps to relieve pressure on introduced pastures, to build a winter feed wedge.
In seasons with high spring rainfall, it may be necessary to conserve fodder or use agistment to stay on top of phalaris pastures if grazing pressure is removed during spring. If the aim is to increase native grass dominance by seedling recruitment, it may be necessary to graze the native pastures in late summer/autumn to open up spaces for germination. Relieving pressure from introduced pastures at the autumn break will also help with persistence of introduced perennial grasses such as phalaris, which require three to four leaves prior to grazing at that time of year. All pastures on flat to mildly undulating land should remain above 70% ground cover at all times, and on steeper country, ground cover should be maintained above 90%.
|
|
|
Integrated management at Spring Valley
Ian Locke runs beef cattle and prime lambs on his property ‘Spring Valley’ near Holbrook. The farm is undulating with about 80% sown to productive perennials (mostly phalaris and sub clover). Native pastures make up 15% of the property, including the steep and often rocky hill country.
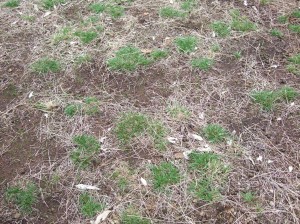
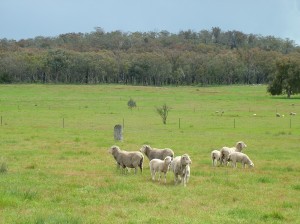
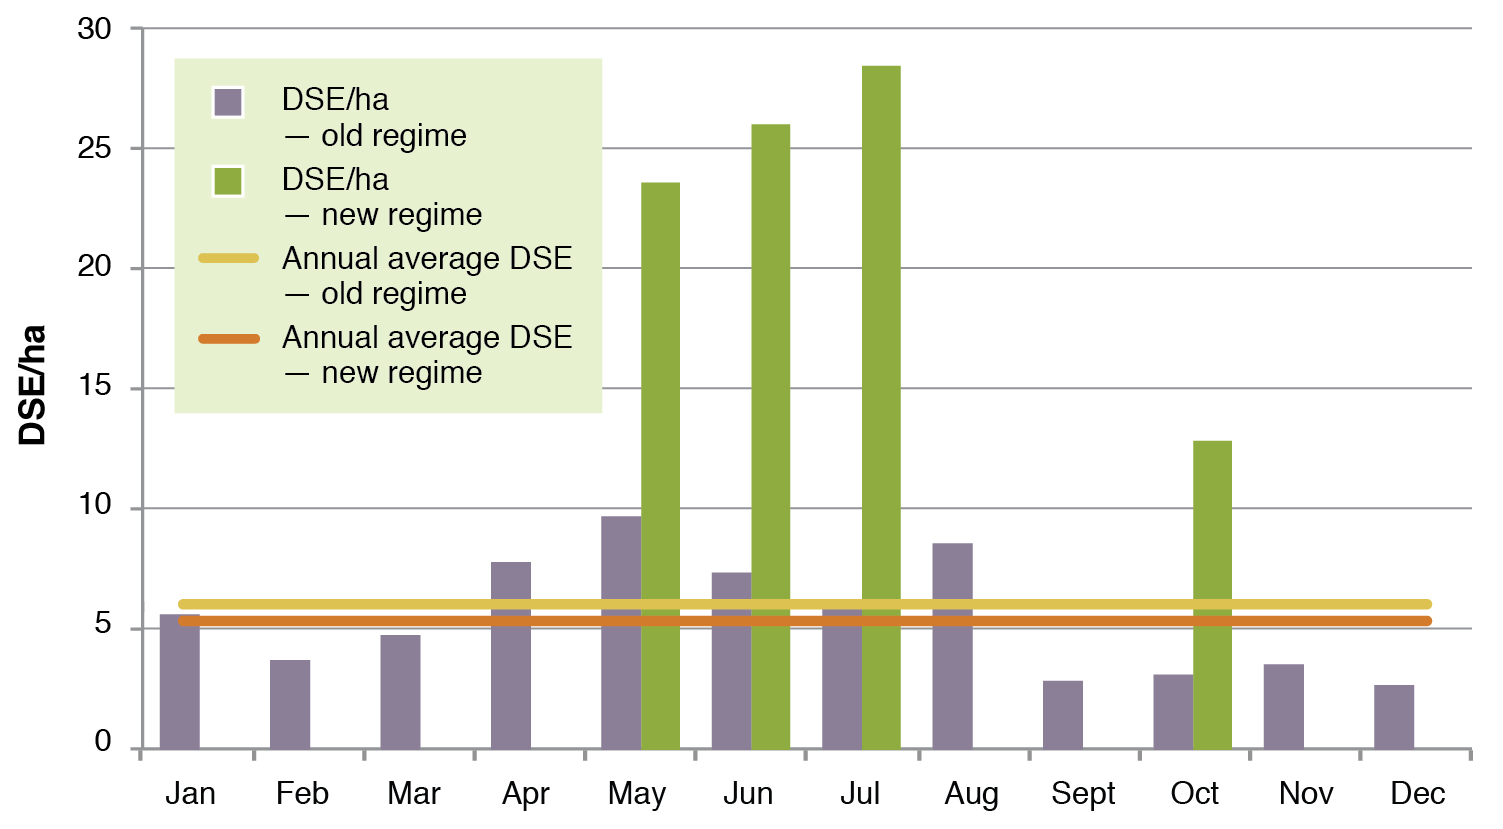
Previously, fertilised native pastures were set stocked with wethers for twelve months of the year, resulting in low ground cover, high levels of Patterson’s curse and poor production. In the new system, the wethers were removed and replaced by spring calving cows through winter until the last month before calving. This strategy improved the fitness of the cows and relieved the pressure from phalaris during the winter feed gap. Sheep grazed the native pastures for a short period in October to reduce the annual weed biomass, and the native pastures were then rested for the summer to allow them to seed and regenerate. The result was improved ground cover and perennial native grass composition, reduced weed burden and increased overall productivity. The stocking rates achieved on native pastures in the former wether system compared to the new strategic grazing system are presented in Figure 11. In this system, Ian discontinued fertiliser application to the native pastures which were on lighter soils than the Holbrook Proof Site and therefore less likely to respond. Removing fertiliser inputs also helped to keep weeds under control. Further details on the Spring Valley trails can be seen in the EverGraze case study found here.
|
|
|
|
|
Integrated management at Woomargama Station
Chris Mirams provided a great example of how livestock can be allocated to pastures and management of rotational grazing through the seasons within the constraints of a real farm. The land classification and allocation of livestock at Woomargama Station is presented in Figure 12.
|
|
|
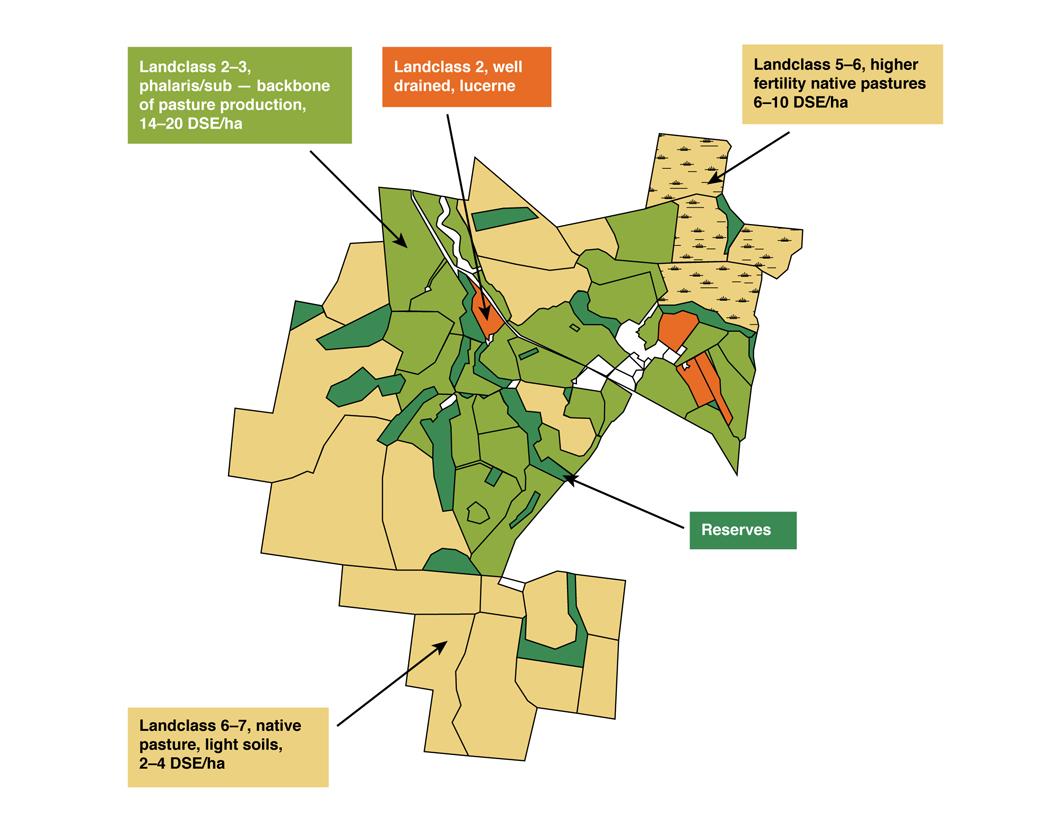
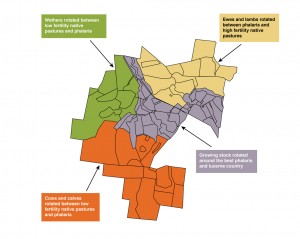
In the Woomargama example, all pastures were rotationally grazed with strategic rests of the native pastures. By allocating each livestock class to a different ’block‘ of the farm, Chris was able to run less mobs and allocate a significant amount of paddocks to each mob. This had labour and ease of management advantages as the number of mobs were significantly reduced.
Spring calving cows and calves were rotationally grazed predominately on native pastures, with some improved pastures to manage nutrition prior to joining. Spring lambing ewes were rotationally grazed around higher quality native pasture in combination with improved pastures. Ewes were joined 50 per cent to a terminal sire to provide options for selling stores or finishing some lambs on lucerne in good seasons, and 50 per cent to Merinos as replacements. Wethers grazed predominately low fertility native pastures, with some improved areas to maintain their condition, preventing a break in the wool. The low fertility native pastures were poorer quality than the higher fertility pastures of the Holbrook Proof Site experiment, and hence may not have been suitable for ewes and lambs. Chris also said that (in the self-replacing system) having the wethers reduces the amount of lambs needing to be carried over summer, since summer activity in the pastures was limited to the small amount of lucerne (sown wherever the soils were suitable), and some fodder crops sown as part of a renovation program.
The highest production areas were sown to phalaris/sub clover pastures which were proven to persist through time. These areas, together with the lucerne and fodder crops, were reserved for growing stock. The limited area available for growing lucerne and the high proportion of phalaris on the farm meant that it was difficult to capitalise on a good spring, as was the case in the Holbrook Proof Site. Chris managed the surplus by cutting silage which helped minimise the impact of dryer seasons. The area reserved for silage was determined based on seasonal conditions leading up to spring. If it were possible to include more lucerne in the system, this would have reduced the spring surplus and allowed feed quality to be retained for longer, as was observed in the Wagga Wagga Proof Site.
Further information can be found in the Woomargama Station EverGraze Case Study.
What it all means
The results from the Holbrook experiment indicate that it is more profitable to run a single mob of ewes across both native and improved perennial pastures, compared to using native pastures to graze wethers. The results also indicated that grazing ewes on native pastures for a short period in winter, and for six weeks in spring, has no impact on wool or lamb production compared to ewes grazing phalaris only. The Integrated system may have benefits to pasture composition although this was not observed in the years of the experiment. The enterprise choice and exact management setup will differ for each unique farm situation.
Authors and contributors
Kate Sargeant, formerly Agriculture Victoria Benalla
Dr Jim Virgona, formerly Charles Sturt University, Wagga Wagga
Acknowledgements
EverGraze is a Future Farm Industries CRC research and delivery partnership. Research at the Holbrook Proof site was led by Dr Jim Virgona, supported by technical officer Shane Hildebrand both from Charles Sturt University, Wagga Wagga. An enthusiastic Regional Advisory Group consisting of farmers, consultants, extension officers and Catchment Management Authority staff provided significant input in to the direction, management and interpretation of outcomes to make them relevant to farmers.
Further Information
- EverGraze Exchange – Nuts and Bolts of Grazing Management
- EverGraze Action – Managing native pastures in Victoria
- EverGraze Action – Dividing up the farm for grazing management
- EverGraze Action – Identifying native pastures
- Broadford Grazing Experiment
- Chiltern EverGraze Proof Site key message: Composition and production from native pastures in response to fertiliser and rotational grazing
- Chiltern EverGraze Proof Site – Lamb production from native pastures
- Chiltern EverGraze Proof Site – Ecology of Microlaena
- Orange EverGraze Proof Site – Landscape variability can be identified, mapped and managed
- Orange EverGraze Proof Site – Composition of pastures with a high native perennial component is stable under managed grazing
- Orange EverGraze Proof Site – The effect of grazing intensity on production and profit from native pastures
- Utilizing the native country in an overall farm production system – Ian Locke
