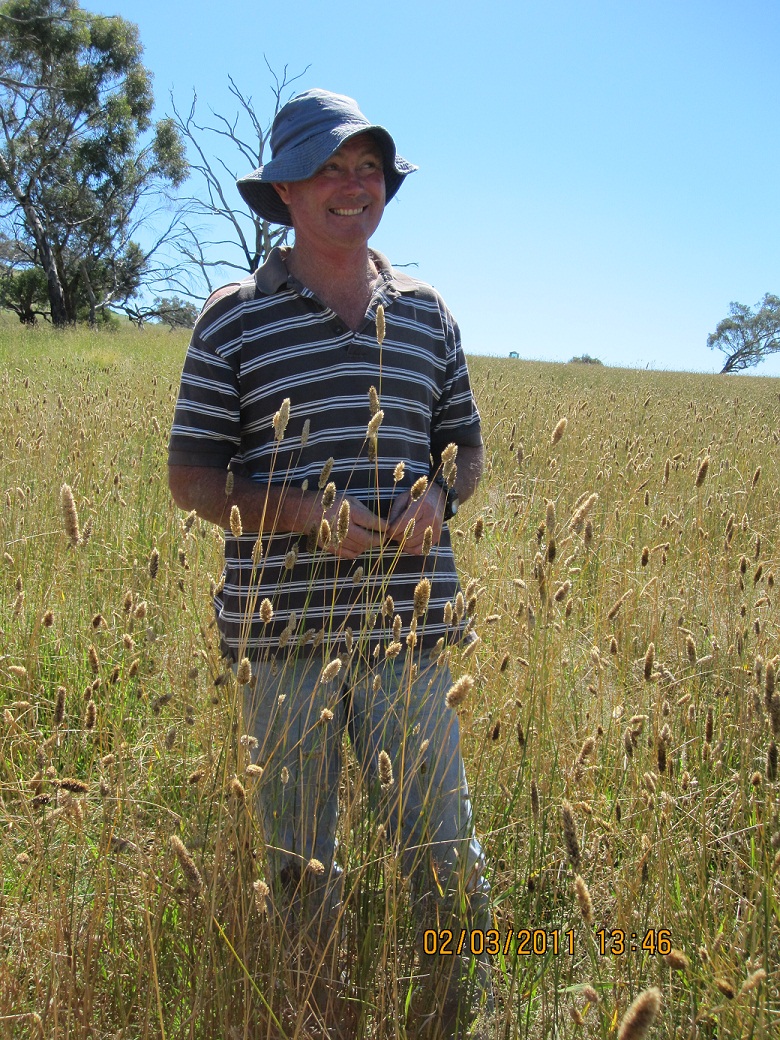
Holbrook Caring For Our Country EverGraze Supporting Site (John and Anne Keogh)
Implementing whole farm grazing strategies in southern NSW
Also see Implementing whole farm grazing strategies at Holbrook case study and the final report for the Holbrook Supporting Site.
Fast Facts
Site Location: Holbrook, southern NSW
Host producers: John and Anne Keogh
Producer group: Holbrook Landcare Group
Site Coordinators: Tim Ekberg, Jeff Hirth
Duration: 2010-2012
Site focus: Landclass fencing and rotational grazing to improve pasture quality, persistence and utilisation of phalaris and native pastures, including management of silver grass.
The Farm
Rainfall: 850 mm
Enterprises: Merino ewes, trade cattle
Farm area: 463 ha
Soils and topography on the farm: Undulating foothill country backing on to granitic outcrops.
The Site and Treatments
While the granitic outcrops at this site remain too steep and rocky to clear, the surrounding foothills had been cleared by early settlers. After WWII until the 1967 drought, monocultures of Mt Barker and Tallarook sub clover were grown on the Big Hill site for commercial seed production. Over the following 40 years, these pastures received negligible fertiliser inputs and degraded to annual weeds and native grasses. In 2008, Big Hill paddock was re-sown to Holdfast (2 kg/ha) and Australian (1½ kg/ha) phalaris and Riverina (3 kg/ha) and Goulburn (2 kg/ha) sub clover, with increased inputs of superphosphate to increase pasture productivity.
Prior to setting up the supporting site, John participated in the EverGraze Whole Farm Grazing Strategies pilot training program and developed a grazing plan for their property based on principles described in the Nuts and Bolts of Grazing Strategies EverGraze Exchange. The plan included seasonal management objectives for pastures and livestock, mob sizes, grazing locations throughout the year, risk management, calving/ lambing strategies and water and fencing requirement.
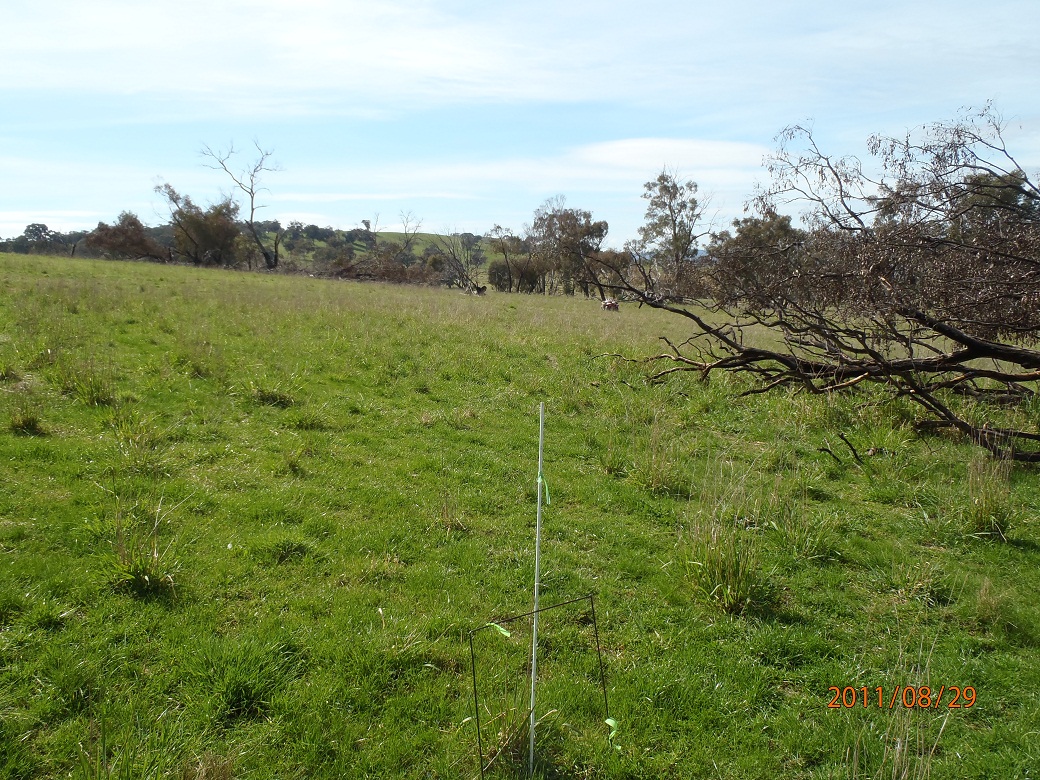
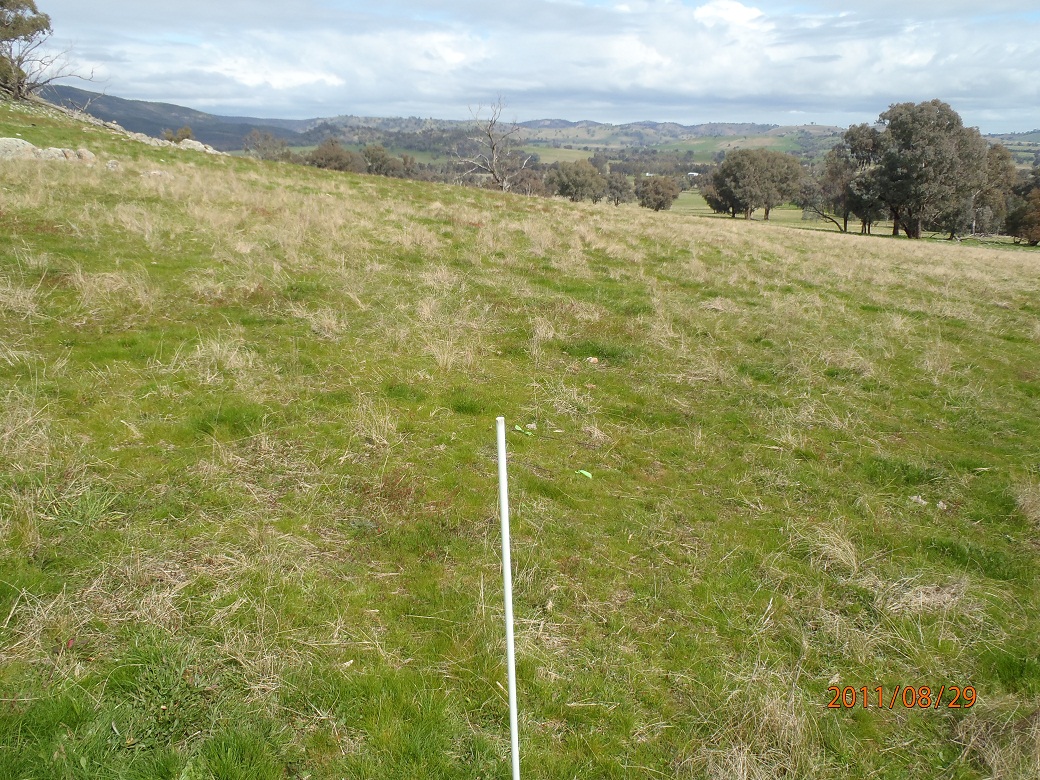
Two paddocks were selected for monitoring. The first, a large, land class 3 paddock (Big Hill – 45 ha), was subdivided into three 15 ha paddocks based on principles described in the EverGraze Action Dividing up the Farm for Grazing Strategies. Before the sub-division, livestock grazed the northern slopes much more heavily than the southern slopes, resulting in higher clover contents on the northern side and un-grazed residuals on the southern side.
The second site (Kennedy’s – 16 ha) was a native pasture with two distinct aspects (west and north east facing slopes) and correspondingly different pasture composition and dry matter production.
Prior to establishment of the Supporting Site, the grazing practice on both paddocks was closer to set stocking than strict rotational grazing (i.e. ‘drift grazing’). Paddocks and management strategies are described in Table 1.
Table 1. Paddocks and management strategies
| Paddock name Land class & description | Pasture composition | Management objective |
Management strategy |
| Dan’s Land class 3 North-facing undulating slopes |
21% phalaris, 27% sub clover, 42% annual grasses, 5% other perennial grasses, 5% bare ground |
Reduce capeweed and annual grasses and maintain phalaris persistence. | Rotational grazing based on principles implemented at Broadford Grazing Experiment: Graze phalaris at 4-leaf stage with rest periods:(20-30 days spring, 70 days summer, 30-50 days autumn (allow 4 leaves to appear before first grazing), 40-60 days winter). Maintain ground cover > 70% and FOO >800 kg/ha dry matter, especially in Autumn to minimise capeweed and barley grass germination. Use a large mob to crash graze barley grass in early spring to 500 kg/ha in early August |
| Kerlin’s Land class 3 Northeast/east-facing gentle slopes |
23% phalaris, 16% sub clover, 44% annuals, 10% other perennials, 7% bare ground |
Reduce capeweed and annual grasses and maintain phalaris persistence. | Rotational grazing and ground cover/FOO targets as above. |
| Big Hill – South Land class 3 South facing undulating slopes |
18% Phalaris, 4% sub clover, 65% annual grasses, 8% other perennials, 5% bare ground |
Increase phalaris utilisation, increase sub clover content and overall feed quality. | Rotational grazing as above. Fence off from north and east facing slopes to increase utilisation. Reduce FOO to 800-1000 kg/ha prior to the autumn break to favour clover germination. |
| Kennedy’s Land class 4 West and northeast facing rocky slopes |
Northeast: 5% Microlaena (weeping grass), 2% sub clover, 82% annuals (silver grass, capeweed, etc), 9% bare ground |
Increase/maintain proportion of native grasses, reduce silver grass and capeweed, maintain clover % for feed quality and nitrogen fixation. | Rotational grazing throughout the growing season. Graze when FOO is 1500-2000 kg/ha and remove stock when it reaches 1000 kg/ha. Apply phosphorus to increase clover %. Heavily graze mid spring to reduce biomass and weeds and allow for late maturing native grass to grow and flower. Maintain ground cover >75% at all times. |
Measurements
The standard EverGraze Supporting Site Quickchecks protocol was implemented. Measurements were as follows:
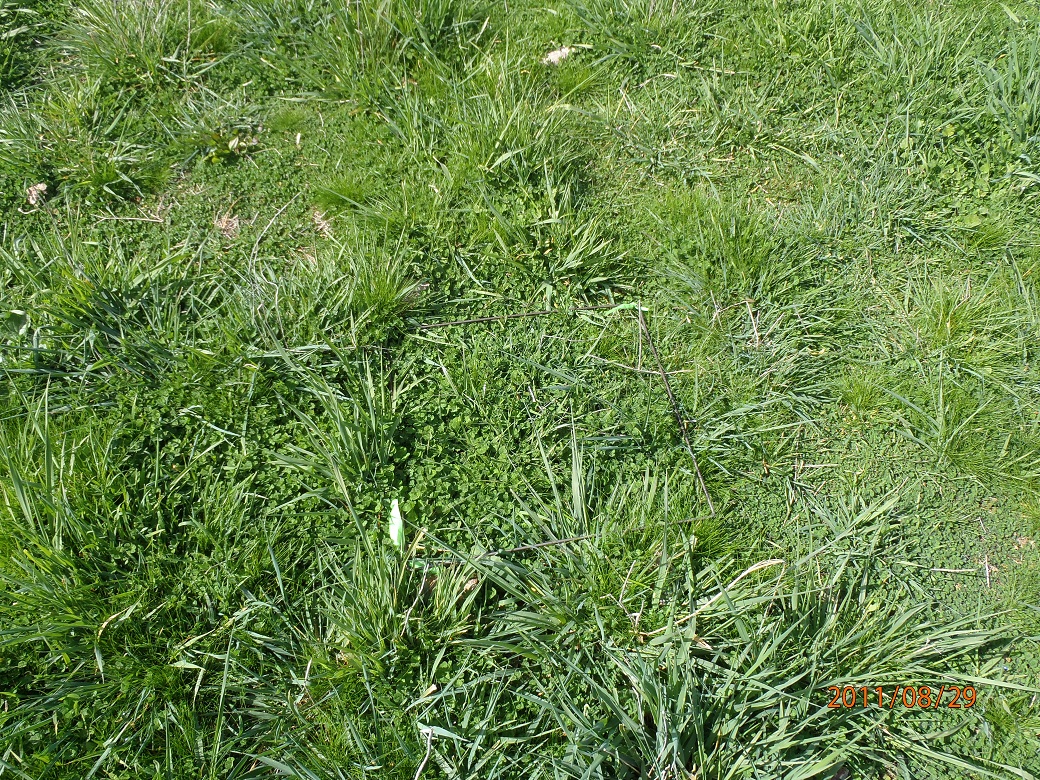
- Pasture condition – availability (kg/ha), composition, ground cover, perennial species persistence (basal cover)
- Spring dry matter yield via hay cut
- Grazing days (DSE/ha) were recorded using the calculator available in EverGraze Feedbase Planning and Budgeting Tools
- Soil testing
- Expenses – capital and variable costs
Results
Land classes, pasture types and maintenance phosphorus requirements
John used the method described in the EverGraze Action – Dividing up the Farm for Grazing Management to identify land classes, pasture types and aspects of his farm which would perform differently. He then mapped the farm, making out these different areas using the iFarm program. He was able to export a list of paddocks and their sizes from iFarm which he then used in the EverGraze Feedbase Planning and Budgeting Tools to record stock movements and DSE grazing days/ha throughout the year. Using the calculator, he then calculated the maintenance phosphorus requirement for each paddock, based on their carrying capacity.
John’s paddocks, grazing days and corresponding maintenance phosphorus fertiliser requirements are listed in Table 2. Using this data, John can see that there is a large range in stocking rates and fertiliser requirements across the paddock, with the best producing phalaris pastures carrying 15-23 DSE/ha and requiring 150-200 kg/ha single super phosphate and the land class 6 native pastures carrying 1-3 DSE/ha and requiring just 10-30 kg/ha single super for maintenance.
The data can also be used to identify paddocks that are not performing, such as Wombat’s, which is sown to phalaris/sub clover but only carrying 5 DSE/ha. John might take a soil test on this paddock to identify deficiencies. The data can also be used to identify where paddocks may be performing unexpectedly well, such as Yabbie paddock which is a native pasture carrying 11.5 DSE/ha and requiring 100 kg/ha single super phosphate to maintain phosphorus levels.
Table 2. DSE Grazing Days recorded in the Feed Budget and Rotation Planner
| Paddock | Ha | Landclass | Pasture or crop | Aspect | DSE grazing days | DSE/ha | Kg P/DSE required for maintenance |
Kg P/ha needed | Single super Kg/ha |
| Smith’s | 1.94 | 2 | Phalaris, clover | 16020 | 22.6 | 0.8 | 18.1 | 206 | |
| Gobius | 2.55 | 2 | Phalaris, clover | 18640 | 20 | 0.8 | 16 | 182 | |
| Annie’s | 5.06 | 3 | Phalaris, clover | South | 33900 | 18.4 | 0.8 | 14.7 | 167 |
| Damalien | 4.49 | 2 | Phalaris, clover | 25510 | 15.6 | 0.8 | 12.5 | 142 | |
| Hirst | 15.37 | 3 | Phalaris, clover | South | 73400 | 13.1 | 0.8 | 10.5 | 119 |
| Fescue | 3.1 | 2 | Phalaris, clover | 14530 | 12.8 | 0.8 | 10.3 | 117 | |
| Ellens | 6.6 | 3 | Phalaris, clover | 30150 | 12.5 | 0.8 | 10 | 114 | |
| Woolpress | 17.64 | 2 | Clover weeds | 78480 | 12.2 | 0.8 | 9.8 | 111 | |
| Yabbie | 2.94 | 6 | Native | 12320 | 11.5 | 0.8 | 9.2 | 104 | |
| Kurrajong | 17.64 | 3 | Phalaris, clover | South | 72740 | 11.3 | 0.8 | 9 | 103 |
| Big Dam | 18.61 | 3 | Phalaris, clover | North | 73360 | 10.8 | 0.8 | 8.6 | 98 |
| Airstrip | 9.13 | 2 | Native | 34340 | 10.3 | 0.8 | 8.2 | 94 | |
| Front | 7.4 | 3 | Phalaris, clover | South | 27660 | 10.2 | 0.8 | 8.2 | 93 |
| Phalaris | 9.62 | 2 | Phalaris, clover | 34540 | 9.8 | 0.8 | 7.9 | 89 | |
| Picnic | 25.28 | 3 | Phalaris, clover | North | 86950 | 9.4 | 0.8 | 7.5 | 86 |
| John | 2 | 6 | Native | 6860 | 9.4 | 0.8 | 7.5 | 85 | |
| Kerlin’s | 14.6 | 3 | Phalaris, clover | 49800 | 9.3 | 0.8 | 7.5 | 85 | |
| Green reserve | 12.09 | 3 | Phalaris, clover | North | 38910 | 8.8 | 0.8 | 7.1 | 80 |
| Big Hill | 16.9 | 3 | Phalaris, clover | South | 54237 | 8.8 | 0.8 | 7 | 80 |
| Red Box | 19.95 | 3 | Clover weeds | 61270 | 8.4 | 0.8 | 6.7 | 76 | |
| Long | 5.13 | 3 | Clover weeds | 15200 | 8.1 | 0.8 | 6.5 | 74 | |
| Dan’s | 16.7 | 3 | Phalaris, clover | 47400 | 7.8 | 0.8 | 6.2 | 71 | |
| Clear | 23.02 | 3 | Phalaris, clover | South | 64950 | 7.7 | 0.8 | 6.2 | 70 |
| Bridgets | 10.24 | 3 | Phalaris, clover | North | 28150 | 7.5 | 0.8 | 6 | 68 |
| Gens | 1.36 | 4 | Clover weeds | 3570 | 7.2 | 0.8 | 5.8 | 65 | |
| Forrest | 14.74 | 3 | Clover weeds | 36820 | 6.8 | 0.8 | 5.5 | 62 | |
| Silo | 8.56 | 2 | Phalaris, clover | 19380 | 6.2 | 0.8 | 5 | 56 | |
| Back | 8.19 | 3 | Trit 2010 | 17320 | 5.8 | 0.8 | 4.6 | 53 | |
| Wombats | 18.12 | 3 | Phalaris, clover | North | 37220 | 5.6 | 0.8 | 4.5 | 51 |
| Ram Nth | 4.06 | 4 | Native | 7100 | 4.8 | 0.8 | 3.8 | 44 | |
| Gabes | 8.59 | 3 | Trit 2010 | 13720 | 4.4 | 0.8 | 3.5 | 40 | |
| Hurley’s | 9.03 | 6 | Native | 11720 | 3.6 | 0.8 | 2.8 | 32 | |
| Jimmy’s | 4.77 | 7 | Native | 6130 | 3.5 | 0.8 | 2.8 | 32 | |
| Duck | 20.04 | 3 | Trit 2010 | 24520 | 3.4 | 0.8 | 2.7 | 30 | |
| West Back | 26.8 | 4 | Trit 2010 | 32760 | 3.3 | 0.8 | 2.7 | 30 | |
| Keoghs | 8.69 | 6 | Native | 7860 | 2.5 | 0.8 | 2 | 23 | |
| Mark | 3.81 | 7 | Native | 2820 | 2 | 0.8 | 1.6 | 18 | |
| GR Creek | 8 | 6 | Native | 5440 | 1.9 | 0.8 | 1.5 | 17 | |
| Mat | 8.73 | 6 | Native | 4720 | 1.5 | 0.8 | 1.2 | 13 | |
| Luke | 16.7 | 6 | Native | 7540 | 1.2 | 0.8 | 1 | 11 | |
| Grant’s | 13.5 | 6 | Native | 5120 | 1 | 0.8 | 0.8 | 9 |
Livestock management in rotational grazing
After completing the Whole Farm Grazing Strategies program, John combined his mobs and implemented a rotational grazing system, using 10 or more paddocks in a rotation, based on principles demonstrated at the Broadford Grazing Experiment. The aim was to significantly increase pasture utilisation and production, thereby increasing stock carrying capacity. John also hoped that implementing the rotation would increase the persistence of phalaris and reduce bare ground and capeweed which had been a problem through the drought.
When John first implemented the rotation, while the increased utilisation was obvious, he noticed that the ewes and lambs were not performing as well as they had been when set stocked. This is consistent with findings from Broadford Grazing Experiment and Orange EverGraze Proof Site, where stocking rates were significantly higher under rotational grazing, but individual animal performance was slightly reduced. John’s experience also highlights some important messages for when first implementing a rotational grazing system.
- Balance the needs of livestock and pastures when determining rest periods (for the pasture) and residual grazing height (to meet production targets).
- Running larger mobs will increase worm burdens and potential disease. This can be prevented by testing for worms regularly and ensuring that pastures are not grazed too close to the ground.
- Restricting livestock to a smaller grazing area will reduce their ability to selectively graze. This is good for improving pasture composition and stocking rates but may reduce individual animal performance. A less intensive rotation may be needed for finishing growing stock in spring.
- Closely monitor stock so that any changes in productivity can be identified early.
As producers get more experienced with running a rotation, it becomes more obvious when stock need to be moved and when performance is slipping. Other Holbrook case studies for Vicky Geddes, Chris Mirams and Ian Locke highlight how some of these management strategies can be developed over time so that the stocking rate benefit from rotational grazing can be achieved without significantly compromising individual animal performance.
Using the EverGraze Pasture Improvement Calculator to determine the value of land class fencing
Prior to fencing the Big Hill paddock, it was impossible to graze the southern section without overgrazing the north and east sections of the paddock. Dividing the paddock led to an estimated increase in stocking rate of 2 DSE/ha in the southern paddock and an increase in the sub clover content from 4% to 15% (as a result of increased light availability). See Getting sub clover back into the pasture for more information on this.
|
|
|
A cost benefit analysis of the fencing was developed using the EverGraze Pasture Improvement Calculator. Results are presented in Table 3. Four scenarios were calculated.
- In the first scenario, the fencing costs were $13,000 (the actual cost) over 45 ha of the three paddocks. It was assumed that the 2 DSE/ha stocking rate increase was achieved across all paddocks. In this scenario, the investment was profitable with a breakeven point of 10 years and internal rate of return 18%.
- In the second scenario, the stocking rate increase was only calculated for the Southern paddock (the value estimated by the group), considerably increasing the fencing cost per hectare. Under this scenario, the investment is not profitable without a subsidy to assist with the fencing cost.
- In the third scenario, a more generous stocking rate increase (5 DSE/ha) is estimated for the Southern paddock and results in a profitable investment with breakeven 11 years and internal rate of return 15%.
- In the final scenario, the stocking rate increase was 2 DSE/ha in the Southern paddock, but a cheaper (electric) fencing cost of $4000/km was used. In this scenario, the breakeven point is 14 years and with internal rate of return 12%. With a net present value of $11/ha the investment in this scenario is only just profitable.
In the investment analysis, any additional value from persistence of phalaris in the north and east paddocks has not been accounted for. Additional feed quality and therefore livestock production (other than stocking rate) from additional clover in the south paddock has also not been accounted for. To get a good idea of the potential stocking rate increase from higher utilisation of each paddock in this scenario, stocking rate should be monitored for a period of time.
Table 3: Value of landclass fencing for all paddocks and the southern paddock
| All paddocks | Southern paddock increase by 2 DSE/ha | Southern paddock increase by 4 DSE/ha | Southern paddock increase by 2 DSE/ha, fence cost $4/m | |
| Investment Costs | ||||
| Fencing cost ($/km) | $8 | $8 | $8 | $4 |
| Cost of fence (1.6 km) | $13,000 | $13,000 | $13,000 | $6,525 |
| Ha | 45 | 15 | 15 | 15 |
| Cost/ha | $289 | $867 | $867 | $435 |
| Paddock and pasture production values | ||||
| Estimated stocking rate prior to improvement (DSE/ha) | 10 | 10 DSE/ha | 10 DSE/ha | 10 DSE/ha |
| Stocking rate after improvement | 12 | 12 DSE/ha | 15 DSE/ha | 12 DSE/ha |
| Gross margin/DSE | $30 | $30 | $30 | $30 |
| Capital cost of livestock ($/DSE) | $50 | $50 | $50 | $50 |
| Cost/ha of additional fertiliser to account for higher stocking rate (1 kg P/ha/DSE @ $250/ha single super) | $6 | $6 | $14 | $6 |
| Economic and financial values | ||||
| Opportunity cost of invested capital | 12% | 12% | 12% | 12% |
| Expected annual inflation rate | 2.50% | 2.50% | 2.50% | 2.50% |
| Marginal tax rate | 20% | 20% | 20% | 20% |
| Interest on borrowed funds | 8% | 8% | 8% | 8% |
| Interest on investment funds | 5.50% | 5.50% | 5.50% | 5.50% |
| Results | ||||
| ^Net present value | $4,891 | -$4,848 | 2,278 | $11 |
| ^^Internal rate of return | 18% | N/A | 15% | 12% |
| Peak debt | -$13,069 | -$15,098 | -$13,032 | -$6,498 |
| Year of peak debt | 2 | 18 | 2 | 2 |
| Breakeven year | 10 | N/A | 11 | 14 |
| *Break even peak stocking rate (DSE/ha) | 11 | 14 | 14 | 12 |
| *Break even gross margin ($/DSE) | 31.85 | 41.1 | 35. 54 | 34.15 |
| ^The net present value is the additional money you will have in current terms above what you earned at your required rate of return, at the end of the investment period (20 years). | ||||
| ^^The internal rate of return is the breakeven discount rate for the investment. If all the money for the investment was borrowed, the IRR would represent the maximum interest rate the investor could afford without losing money | ||||
| *Break even peak stocking rate and gross margin are required to just break even ie. All costs are covered but there is no profit. | ||||
| There has been no allowance for additional labour | ||||
Silver grass management
Crash grazing was undertaken to control silver grass in the native and annual grass dominated paddock, Kennedys. Mobs of 1200 ewes were used to crash graze the site; however no reduction in silver grass was observed. It is likely that this was due to a lack of grazing pressure as the ewes were not able to graze the paddocks hard enough in early spring with lambs at foot. Wethers would have enabled greater grazing pressure.
 |
 |
| Despite an attempt to crash graze in early spring, grazing pressure was not high enough to have an effect on the silver grass. | |
The group were keen to experiment further to assess whether silver grass would reinvade after a chemical knock down with a simazine, and whether spraying silver grass offered the best cost/ benefit for its control. The group were also keen to know whether increasing the soil phosphorus would encourage Microlaena and annual ryegrass to compete with the silver grass. EverGraze research conducted at Chiltern Proof Site indicated that where there was minimal legume in the pasture, phosphorus fertiliser did little to change the production or composition of the pasture. Given the lack of clover in the Holbrook site, it might be expected that a similar result would occur here.
Acknowledgements
Thanks are extended to John and Anne Keogh for hosting the site. This site was supported by Caring for Our Country, Central Highlands Agribusiness Forum, Meat and Livestock Australia, and Future Farm Industries CRC through the National EverGraze Project.
Authors and contributors
Jeff Hirth, Private Consultant, Rutherglen, Victoria
Kate Sargeant, formerly Agriculture Victoria Benalla
Tim Ekberg, Farming Answers, Milawa, Victoria
Bindi Hunter, Agriculture Victoria Warnambool
Further Information
- Final report for Keoghs Holbrook Supporting Site
- Case study – Implementing whole farm grazing strategies at Holbrook
- EverGraze Action – Grazing Phalaris for production and persistence
- EverGraze Exchange – The nuts and bolts of grazing strategies
- EverGraze Action – Dividing up the farm for grazing management
- A simple guide to pasture establishment
- The Broadford Grazing Experiment
- Holbrook EverGraze research message – Integrated management of native pastures and phalaris
- Chiltern EverGraze research message – effect of grazing and fertiliser on pasture production and composition
- Orange EverGraze research message – Landscape variability can be identified, mapped and managed
