Wagga Wagga EverGraze Proof Site Climate
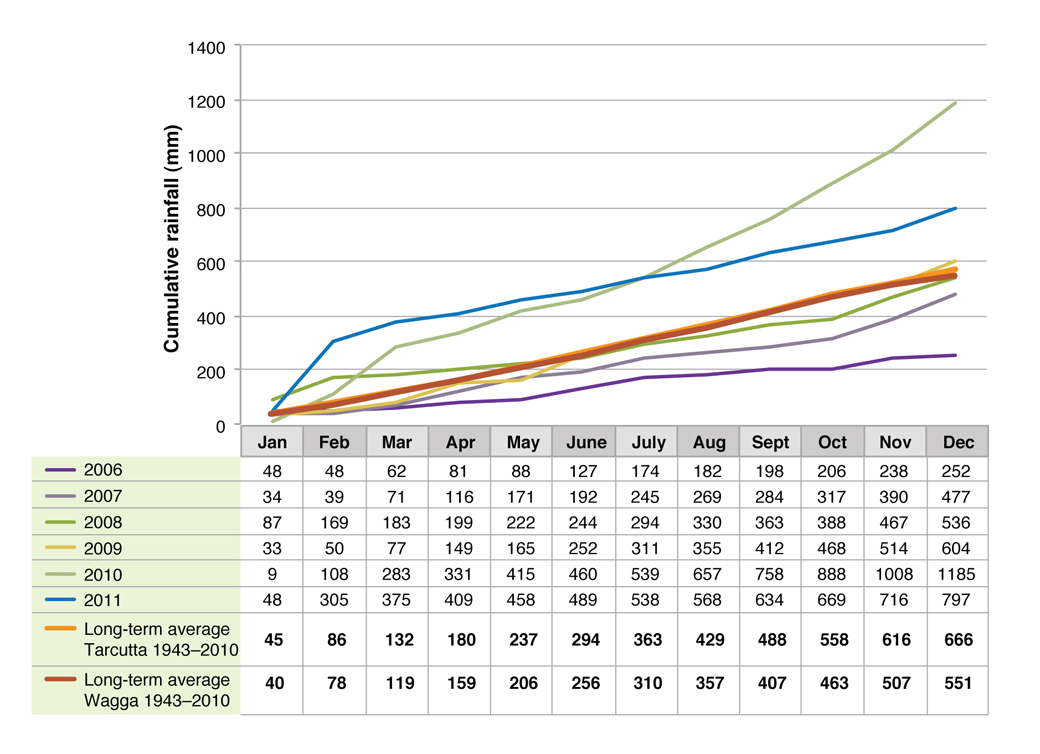
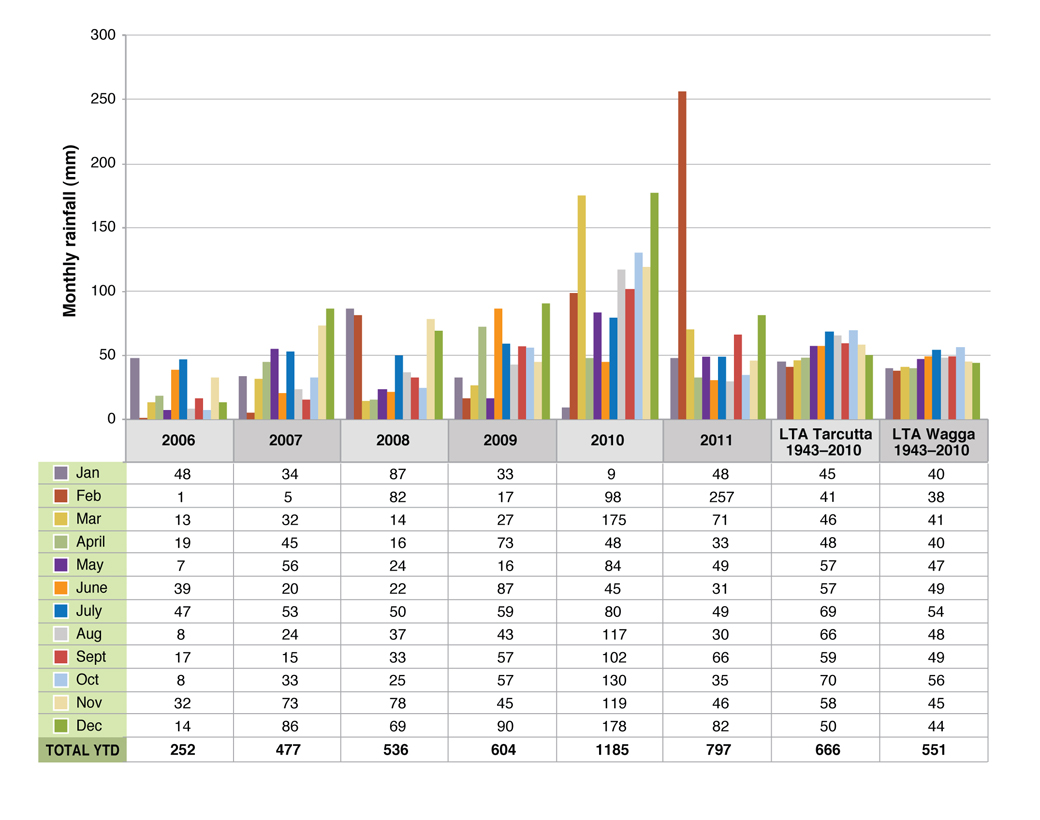
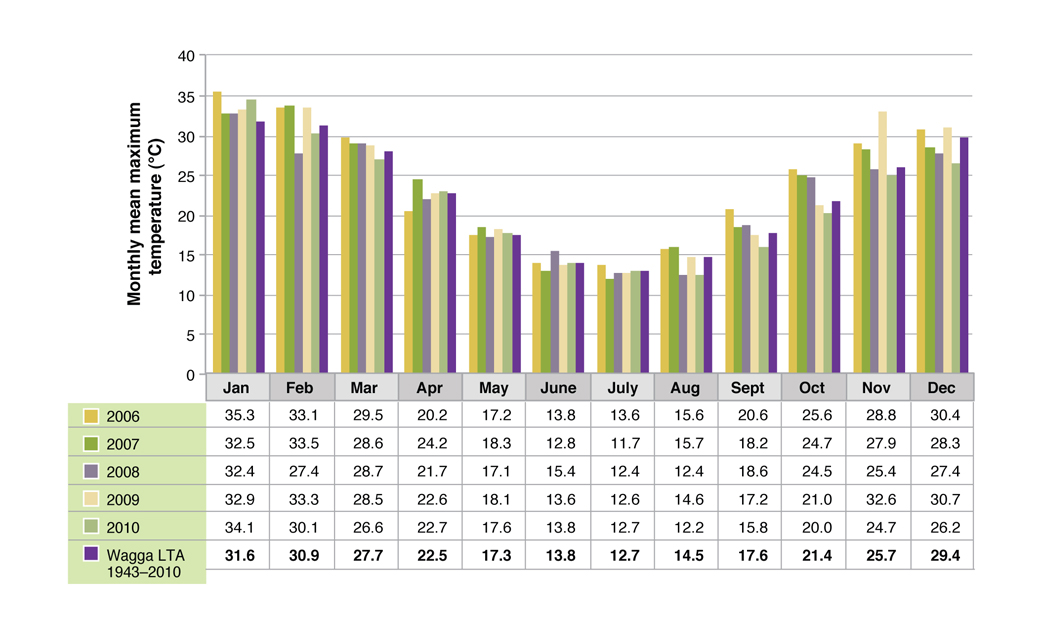
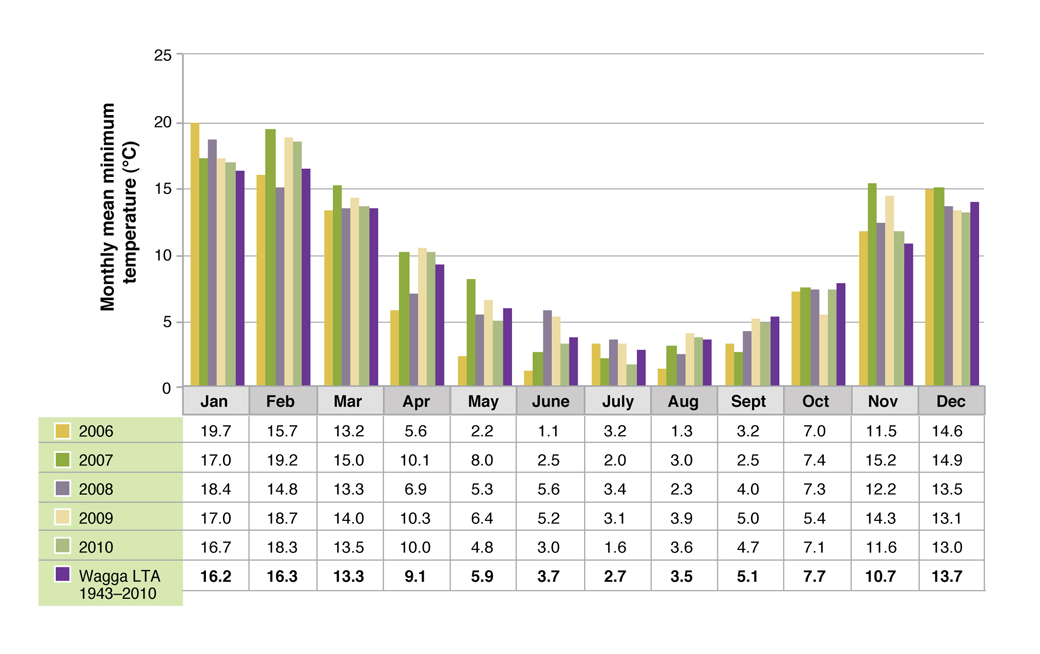
The Wagga Wagga Proof Site was located between Wagga Wagga and Tarcutta in the Southern Slopes of NSW. Average rainfall is 571 mm for Wagga Wagga and 666 mm for Tarcutta with a fairly even distribution throughout the year in both areas (Figures 1 and 2). Winter rainfall is relatively reliable with a higher degree of variability in autumn and spring. Hot dry summers (Figure 3) tend to be a limitation to persistence of shallow-rooted perennial species. Winters are relatively mild (Figure 4) compared to some other regions of southern Australia (eg. South West Victoria), although there is a high occurrence of frosts, with on average 24 days per year with minimum temperatures of 0oC or below.
Further details of climate and variability throughout the North East Victoria/Southern Slopes NSW/South West Victoria (Upper) regions can be found in the Regional Context.
Figures 1 and 2 describe the rainfall during the Wagga experiment and Figures 3 and 4 describe monthly average maximum and minimum temperatures. Rainfall patterns during the grazing experiment were unusual. In each year from 2006 to 2009, rainfall during spring was below average. Monthly rainfall of 8 to 32 mm in September and October 2006-2008 was well below the long-term average for Wagga Wagga of 50 to 60 mm for those months (between percentile 1 and 10 for the years 1941 to 2010). Rainfall in 2010 was well above average in most months, with 2010 being the wettest year on record for Wagga Wagga. High rainfall continued over the summer of 2010/2011.


