Understanding your stocking rate and feed supply demand profile
The first step for critically analysing your livestock system is to determine your stocking rate, and the relationship between feed supply and demand on your farm. Stocking rate is commonly measured in terms of dry sheep equivalents (DSE). A DSE represents the energy requirement of a dry 50 kg ewe which is 8.3 megajoules metabolisable energy per head per day (MJ ME/hd/day).
The farm stocking rate (DSE/ha) = number of stock of each class x DSE per head, divided by the number of hectares on the farm. Table 14 (sheep) and Table 15 (cattle) provide the DSE ratings of each livestock class. As a rough rule of thumb, 1 DSE will consume 1 kg dry matter (green) per head per day.
Energy requirements, and therefore DSE, vary considerably with stage of reproduction. It is therefore useful to understand the monthly stocking rate rather than simply the annual average. Estimating your monthly and annual stocking rate is useful for the following purposes:
- Understanding times of peak demand and comparing this to the pasture growth profile
- Comparing your monthly and annual stocking rate to other farmers in your local area to identify opportunities for improved pasture utilisation or a need to improve pasture performance to increase carrying capacity
- Estimating maintenance fertiliser requirements
The EverGraze Exchange, Livestock systems for profitable use of perennial pastures, provides considerations for making decisions relating to stocking rate and pasture utilisation.
The EverGraze Stocking Rate Calculator is an easy way to determine your stocking rate and the variability in livestock energy demands throughout the year.
Using the EverGraze Stocking Rate Calculator
The following video explains how the calculator can be used.
Figure 1 presents the stocking rate profile output from the calculator for August lambing and calving enterprises on a farm which is stocked at on average 12.2 DSE/ha but which has a minimum stocking rate in February-April of 7.8 DSE/ha and maximum of 20.6 DSE/ha in November, just before all young stock are sold off in December. Figure 2 shows the change in DSE per head for each livestock class on the farm.
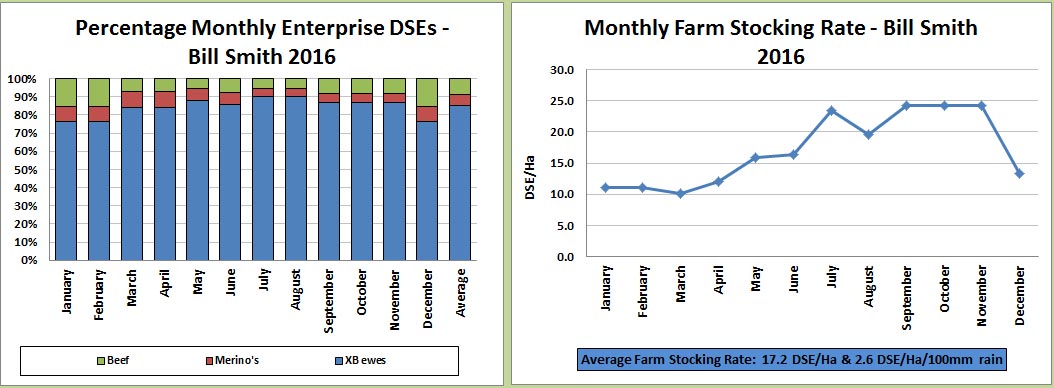
- Figure 1. Stocking rate profile for an example farm – output from the EverGraze Stocking Rate Calculator
Using the Feed Demand Calculator to analyse feed supply and demand
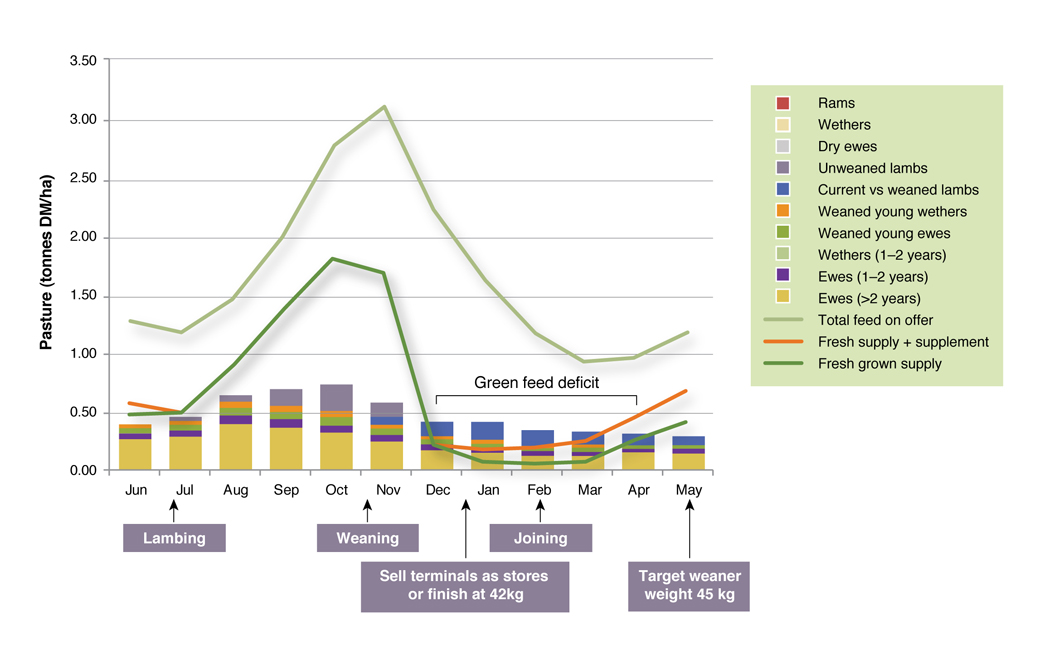
The MLA Feed Demand Calculator can be used to estimate the impact of changes to feed supply, stocking rates, time of calving/lambing. . Figure 2 shows the feed demand and feed supply for a self-replacing merino ewe flock near Balmoral in western Victoria. Ewes lambed from late July for 5 weeks, were weaned in late November with wethers and surplus ewes sold in autumn. Feed demand peaks in September – October when pasture growth is high. Pasture utilisation was 63% and minimum ground cover was about 1000 kg/ha. There is a deficit of freshly grown pasture compared to demand from December through to March. Summer active perennials could play a role here to shift some of the growth from early spring to late spring/summer. Full detail of how to use the Calculator are available on the MLA website.
Monitoring stocking rate on individual paddocks
To be able to understand how well different paddocks on the farm are performing, it can be very useful to monitor the stocking rate carried by individual paddocks on the farm. Within the Feedbase Planning and Budgeting Tool, there is a section called Farm Paddock Grazing Days Recorder that can be used to record animals grazing details for individual paddocks. However, this program is Excel based and so requires the user to regularly enter grazing details on a computer or tablet.
Alternatively, there are a number of commercial products such as Paddock Action Manager that can be used to record grazing details in the paddock using smart phones and purchased Apps.
Authors:
Kate Sargeant, formerly Agriculture Victoria, Benalla
Geoff Saul, Productive and Sustainable Agricultural Services, Port Fairy, Victoria.
Further Information
- EverGraze Exchange – Livestock systems for profitable use of perennial pastures
- EverGraze Exchange – The nuts and bolts of grazing strategies (online)
- EverGraze Exchange – Selecting pastures for place and purpose
- Hamilton EverGraze research message – Sheep systems for maximizing profit from perennials
- Wagga Wagga EverGraze research message – Flexibility in livestock systems is important for risk management in variable climates
