Tallangatta Valley Caring For Our Country EverGraze Supporting Site (Janet and Stuart Morant)
Improving pasture productivity in hill country
- Also see the following case study: Improving pasture productivity in hill country, Stuart and Janet Morant
Fast Facts
Site Location: Tallangatta, North East Victoria
Rainfall: 890mm
Farm area: 400 ha
Host producers: Janet and Stuart Morant
Enterprises: Spring calving crossbred cows (54 cows), 120 weaners, and Poll Dorset stud autumn lambing ewes (1900)
Producer group: Tallangatta Valley Landcare group
Site Coordinator: Jim Moll (2007-2008), Jeff Hirth (2008-2012)
Site focus
Establishment, production, persistence and cost analysis of summer dormant tall fescue and cocksfoot pasture mix and landclass fencing to manage less arable parts of the landscape.
Key points
- Native species on upper slopes were better managed through deferred grazing and land class fencing.
- Establishment of perennial species (winter active tall fescue and cocksfoot) on the lower slopes improved productivity, but the two species were not compatible for management in a mix.
- Reducing paddock size and implementing rotational grazing helped to increase pasture utilisation and stocking rates.
Background
The farm is located on the floor and eastern slopes of the Tallangatta Valley, with Tallangatta Creek flowing across the front of the property.
The upper slopes of the Tallangatta Valley have largely remained covered with native vegetation, particularly native grasses. This is because the soils are strongly acidic (pHCa = 3.8-4.0), relatively infertile (Olsen P = 4-10 mg/kg) and lightly textured. Traditionally, there has been little pasture improvement on this steeper country because of poor accessibility, limited water supplies and the need for ground cover over summer and autumn.
The Morant’s had found that perennial ryegrass pastures did not persist and so have sown much of the arable area of their property to phalaris. However, phalaris toxicity in the autumn is a risk for their stud ewes, and areas of the farm are extremely acidic and high in aluminium, making them unsuitable for phalaris, so they were looking to try an alternative persistent perennial.
The area chosen for the Supporting Site was a single 21ha paddock, low in fertility, very acid and covered with a mixture of native perennial grasses (predominately Microleana) and introduced annual species such as sub clover. The site had a mix of undulating country suited to establishment, and steeper country between two ridges that was better managed to promote the existing native perennials.
At the start of the Supporting Site, the Morant’s found that it was difficult to utilise the paddock and prevent bare ground on the upper slopes due to the variation in land classes in the paddock.
Treatments
The Supporting Site paddock was fenced to divide the steep native pasture from the undulating area suited to pasture establishment.
The arable section was tilled with a chisel plough, limed (3.6 tonne/ha) and sprayed in preparation for sowing. A mix of winter active tall fescue (cv. Origin, 8 kg/ha), summer active cocksfoot (cv. Oxen, 8.5 kg/ha) and sub clover (cv. Riverina, 6.1 kg/ha and Goulburn, 6.5 kg/ha) were sown. [Note, these sowing rates are higher than recommended. Cocksfoot would normally be sown at around 3 kg/ha in a mix, with tall fescue at around 10 kg/ha. Sub clover would normally be sown at around 8 kg/ha total.]
The new pasture and the fenced off native area were included in a rotational grazing system.
A neighboring paddock was left unfenced and was set stocked for the duration of the demonstration.
Measurements
The standard EverGraze Supporting Site Quickchecks protocol was implemented. Measurements were as follows:
- Pasture condition – availability (kg/ha), composition, ground cover, perennial species persistence (basal cover)
- Grazing days (DSE/ha) were recorded using the recorder calculator in the EverGraze Feedbase Planning and Budgeting Tool.
- Soil testing
- Expenses – capital and variable costs
What was found
Soil tests
Soil tests at the beginning of the demonstration revealed that soils were very acid with pH below 4 in CaCl and aluminium levels more than 20% and up to 38% in the Control (Tables 1-3). 3.6 tonne/ha lime was applied prior to sowing the new pasture. This brought the pH up to 4.8 in 2010 and 5.0 by 2012, and reduced aluminium levels to 6.2%. 100kg/ha of super phosphate was applied at sowing and 150 kg/ha was applied as maintenance in the subsequent years. Higher production could be achieved by further increasing phosphorus with capital super applications in the improved pasture.
Table 1. Soil tests from Sown paddock at Tallangatta Valley Supporting Site
| Test | Unit | 12/12/2007 | 10/05/2010 | 10/05/2012 |
| pH (CaCl) | 3.8 | 4.8 | 5 | |
| Organic Carbon | % | 4.8 | 3.26 | 3.1 |
| Phosphorus Buffering Index | 117 | 86.8 | ||
| Olsen Phosphorus | mg/kg | 9.1 | 8 | 8.6 |
| Sulphur (KCL 40) | mg/kg | 13.5 | 7.6 | 8.5 |
| Potassium (Colwell) | mg/kg | 250 | 219 | 235 |
| Cation Exchange Capacity | meq/100g | 8.78 | 6.8 | |
| Calcium | meq/100g | 52.40% | 80.00% | |
| Magnesium | meq/100g | 10.70% | 6.90% | |
| Potassium | meq/100g | 7.40% | 6.30% | |
| Sodium | meq/100g | 6.70% | 0.60% | |
| Aluminium | meq/100g | 22.40% | 6.20% |
Table 2. Soil tests from Hill paddock at Tallangatta Valley Supporting Site
| Test | Unit | 12/12/2007 | 10/05/2010 | 10/05/2012 |
| pH (CaCl) | 4.2 | 4.3 | 4.1 | |
| Organic Carbon | % | 3.8 | 3.52 | 4.1 |
| Phosphorus Buffering Index | 114 | 128.7 | ||
| Olsen Phosphorus | mg/kg | 8.1 | 5.3 | 7.9 |
| Sulphate Sulphur | mg/kg | 9.5 | 3.4 | 7.3 |
| Potassium | mg/kg | 233 | 281 | 316 |
| Cation Exchange Capacity | meq/100g | 7.02 | 6.14 | |
| Calcium | meq/100g | 53.00% | 48.00% | |
| Magnesium | meq/100g | 11.10% | 17.80% | |
| Potassium | meq/100g | 7.50% | 11.20% | |
| Sodium | meq/100g | 3.00% | 0.50% | |
| Aluminium | meq/100g | 25.40% | 22.50% |
Table 3. Soil tests from Control paddock at Tallangatta Valley Supporting Site
| Test | Unit | 12/12/2007 | 10/05/2010 | 10/05/2012 |
| pH (CaCl) | 4 | 3.9 | ||
| Organic Carbon | % | 3.15 | 3.9 | |
| Phosphorus Buffering Index | 121 | |||
| Olsen Phosphorus | mg/kg | 6.9 | 6.8 | |
| Sulphate Sulphur | mg/kg | 4.7 | 8.8 | |
| Potassium | mg/kg | 244 | 242 | |
| Cation Exchange Capacity | meq/100g | 4.2 | ||
| Calcium | meq/100g | 39.50% | ||
| Magnesium | meq/100g | 7.90% | ||
| Potassium | meq/100g | 13.80% | ||
| Sodium | meq/100g | 0.70% | ||
| Aluminium | meq/100g | 38.10% |
Rainfall was above average
Rainfall was above average for the duration of the Supporting Site (Figure 1). Of note were the wet summers of 2009/10, 2010/11 and 2011/12, which created favourable conditions for the summer active cocksfoot and the native Microlaena pasture.

The new pasture more than doubled stocking rate
Grazing days are calculated by recording the number of animals x the number days grazed x the dry sheep equivalent (DSE) rating of the stock class and dividing by the number of hectares in the paddock. This number can be further divided by the number of days in the year to provide an average annual stocking rate (DSE/ha), and this is provided in Table 1.
The new pasture was first grazed 11 months after it was sown. It carried 18.9 DSE/ha for 2009, 40.6 DSE/ha for 2010 and 23.5 DSE/ha for 2011.
The rotationally grazed native pasture on the steeper slope (previously part of the same paddock) was rested for summer/autumn each year and carried on average 2.4 DSE/ha in 2009, 5.2 DSE/ha in 2010 and 12.5 DSE/ha in 2011.
The set stocked native pasture in the paddock next door, which was not fenced to land class, carried 7.5 DSE/ha in 2009, 10.6 DSE/ha in 2010 and 14.6 DSE/ha in 2011.
Table 4. Grazing days and average annual stocking rates of Tallangatta Valley Supporting Site
| Improved pasture Rotationally grazed | Native pasture Rotationally grazed | Native pasture Set-stocked |
||||
| Grazing days (DSE/ha) | Annual average (DSE/ha) | Grazing days (DSE/ha) | Annual average (DSE/ha) | Grazing days (DSE/ha) | Annual average (DSE/ha) | |
| May – December 2008 | 0 | 0 | 1,900 | 7.9 | 2,560 | 10.6 |
| January – December 2009 | 6,900* | 18.9 | 880 | 2.4 | 2,720 | 7.5 |
| January – December 2010 | 14,820 | 40.6 | 1,880 | 5.2 | 3,860 | 10.6 |
| January – December 2011 | 8,590 | 23.5 | 4,560 | 12.5 | 5,330 | 14.6 |
| January – April 2012 | 1,220 | 10.1 | 370 | 3.1 | 2,020 | 16.8 |
| Total | 31,510 | 9,590 | 16,490 | |||
* first grazed May 2009.
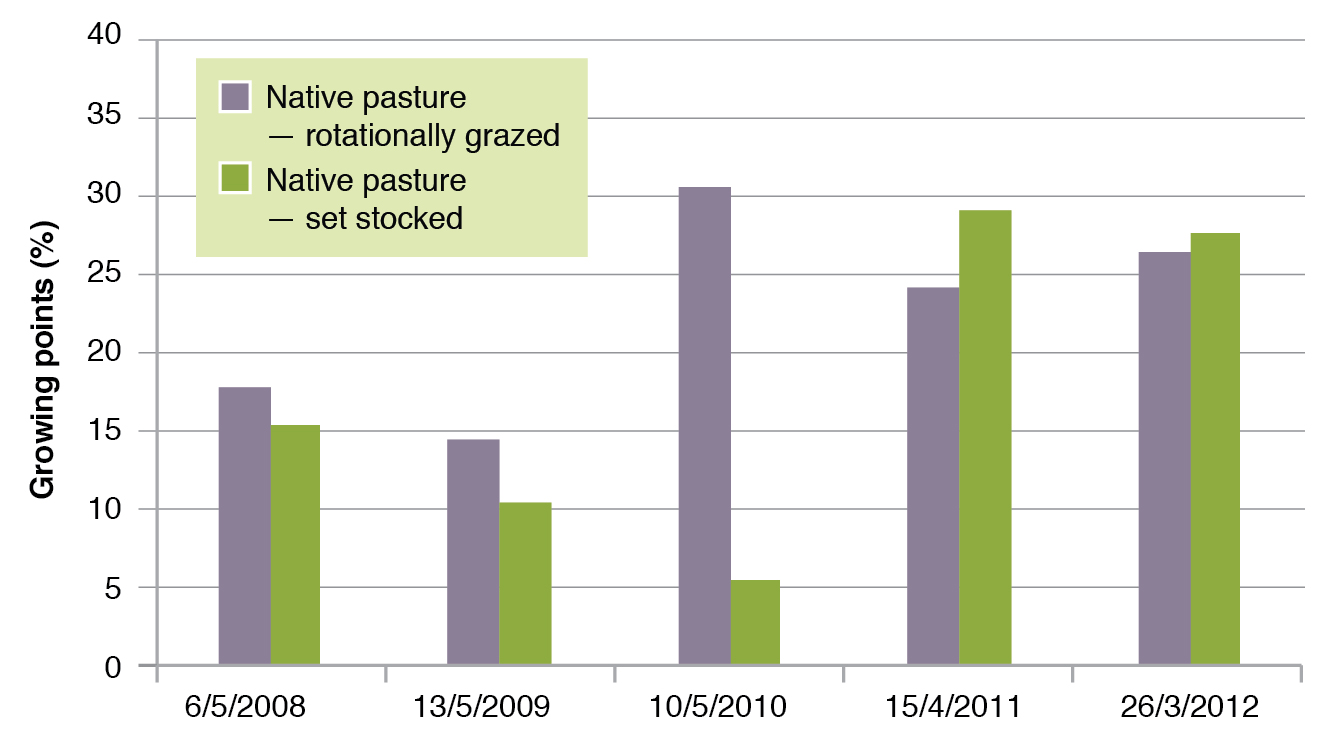
Microlaena persisted under set stocking and rotational grazing
Basal cover of native grasses (predominately Microlaena) was measured at nine fixed grid points in each paddock and is presented in Figure 2. Basal cover is the percentage of 81 grid intersects (at each fixed point) with a tiller base from a perennial plant (see the Supporting Site measurement protocol for details). The results show that with the exception of May 2010, there was no benefit to basal cover from providing a summer/autumn rest to native pastures compared to set stocking. However, the large boost in Microlaena perennial basal cover with high summer rainfall in 2010/11 is consistent with results from Proof Sites at Holbrook, Chiltern and Orange, and Supporting Sites at Warrak and Murmungee. These sites also found that while benchmarks for destocking at 70% ground cover and 800 kg/ha DM were in place, there was no benefit of rotational grazing to the persistence of Microlaena.
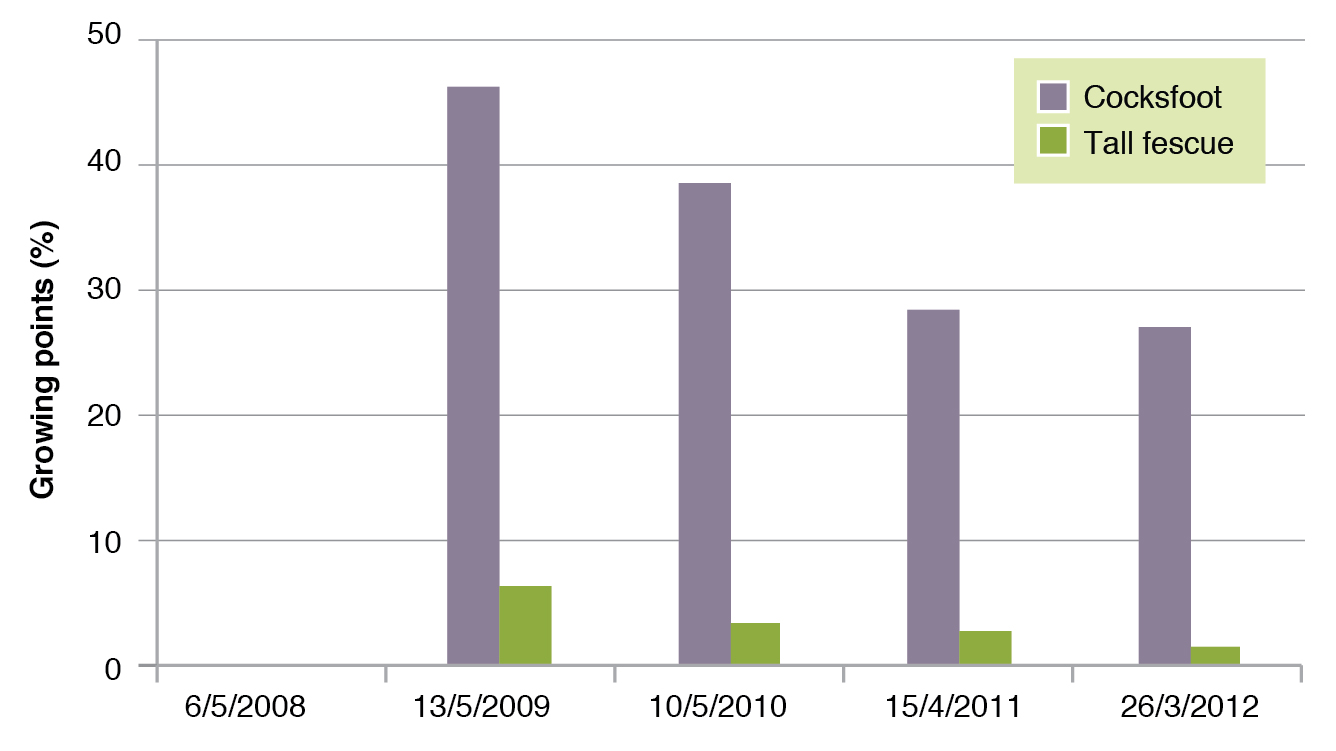
Cocksfoot and tall fescue – not a good mix
Plant frequency is the measure of presence or absence of a tiller base in each of the grid squares and is presented for cocksfoot and tall fescue in Figure 3. The tall fescue and cocksfoot proved difficult to manage together. The tall fescue seeded earlier than the cocksfoot, making it unpalatable from mid-spring. The cocksfoot was selectively grazed at that time of year, leaving the fescue to grow tall and rank. The wet spring/summers also meant that the cocksfoot grew ahead of the dormant tall fescue, and dominated the pasture (Figure 3). It is likely that the dominance of cocksfoot was also due to the very high seeding rate used. The fescue grew faster than the cocksfoot during autumn/winter and this was the time of most limiting feed.
 |
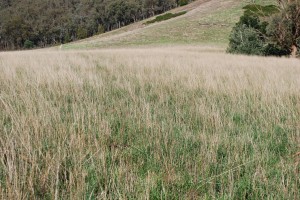 |
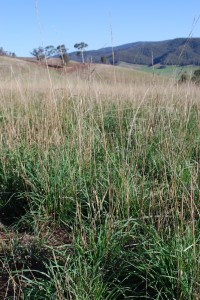
| Tall fescue pastures went rank earlier in the spring leaving cocksfoot pastures to be selectively grazed. | |
In future, the Morant’s plan to try a winter active tall fescue as the only grass in the seed mix, and focus on grazing it harder in early spring, while its palatability and digestibility is still high. The sub clover content of the sown pasture has remained stable and adequate (17-18 %). Among the locals, this ‘very ordinary’ paddock typifies what many of them have up the back of their farms. They were very impressed with how well the new pasture had established, which gave them the confidence to have a go at their own ‘ordinary’ paddocks to see what they can do with them.
In sowing down new pastures, especially on new or tough areas, it is quite common to sow a range of species to capture the strengths and weaknesses of the soil types. Many retailers sell seed mixes with a range of species in the mix. In 2005, a survey of 61 paddocks was carried out (Virgona, unpublished). The survey looked at the pasture species sown in the Murrumbidgee and Murray catchments in NSW, in areas where annual rainfall was greater than 550 mm. For each paddock, details of sowing rates and consequent management were collected and a soil test taken. Each paddock was then assessed for composition, feed availability and the frequency of the sown species. Using this information, the scientists looked at the persistence of sown species and the advantages of sowing multiple species. On average most farmers sowed five species in each paddock, but on assessing the pastures later, only two species on average (including clovers) contributed most of the dry matter. In no pasture did they find that the five sown species persisted at any appreciable level. This study highlights that, rather than using ‘shot-gun mixes’ it is best to sow a single grass species (with appropriate legumes) suited to the right part of the landscape, and to tailor management to the persistence and production of that species.
Investing in water
The Morant’s found that the rotational grazing system significantly improved utilisation of their pastures, but a key issue was getting water to the paddocks. A gravitational tank was therefore installed at the top of the paddock to gravitate water into troughs. A mono pump was used to push the water up a 200m head for over a kilometer to the gravitational tank.
“Investing in the water system was the first step in the renovation program. — if you haven’t got the water you can’t run your stock and utilise your pastures effectively. I guess it has taken a lot of water and wire, but the difference it makes to the pastures and the livestock is substantial. Paddocks of 160 hectares or so were good land areas to manage 20 years ago, but since then things have gotten tighter and we need to be increasing our efficiency through smaller paddocks and rotational grazing.”
Crunching the numbers
The EverGraze Supporting Site at Tallangatta Valley clearly showed that improved perennial pastures can be successfully established on the more challenging soil types. But successful establishment comes at a high cost, in this case $902/ha (including fencing). This included $145/ha to develop (fence and water) the 21 hectare site, $470/ha to cultivate, lime and spray eight hectares of the site and $287/ha for sowing, seed and fertiliser for pasture establishment. The sown paddock was top-dressed with 150 kg/ha single super (at a cost of $51/ha/year) each subsequent year.
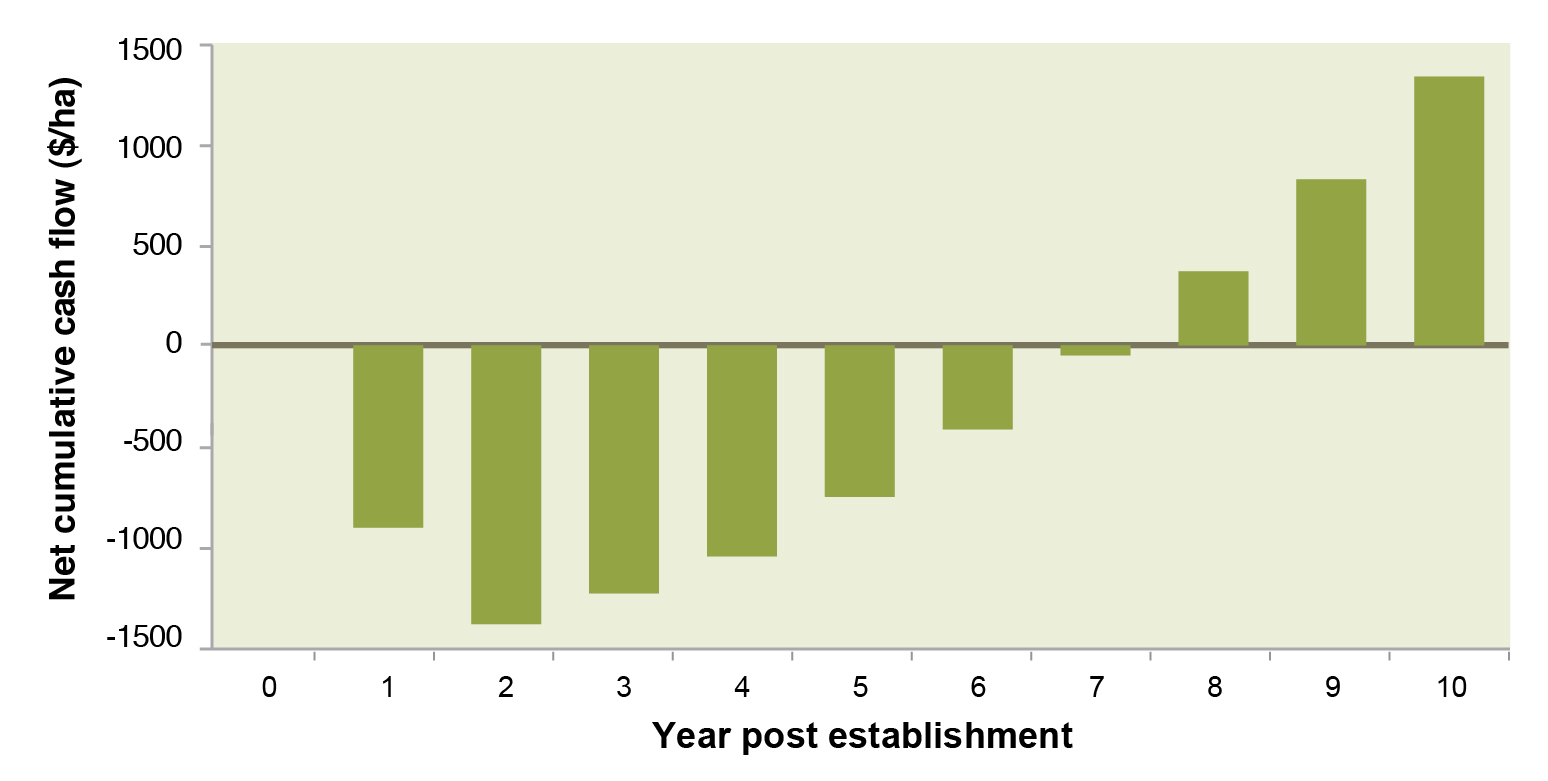
Full details of the economic analysis (including all assumptions used) are provided in the case study Improving pasture productivity in hill country, Stuart and Janet Morant. Cumulative cash flow for the investment is presented in Figure 4.
In this scenario, it is assumed that stocking rate before and after the investment is 8 DSE/ha and 21 DSE/ha respectively. Gross margin is $30/DSE both before and after the improvement. The results show that improving the investment will result in peak debt occurring in the second year after establishment, due to the purchase of extra stock. It will take over eight years for the investment to pay for itself.
The internal rate of return is shown in Table 5. In this analysis, it is assumed the investment is for 10 years, there is a 75% salvage value of extra stock, pasture improvement and fencing, and a discount rate of 10%. The IRR is 23%.
Table 5. Gross Margins, and Return on capital (as Internal Rate of Return) estimated for the improved pasture at Tallangatta, compared to business as usual (the native pastures).
| Business as usual | Improved pasture | |
| Stocking rate when potential (DSE/ha) | 8 | 21 |
| GM/ha at potential ($/ha) | 240 | 630 |
| Value of investment (compared to business as usual | ||
| Return on capital (IRR) | 23% | |
For a simple cost-benefit analysis of pasture improvements, use the EverGraze Pasture Improvement Calculator.
Acknowledgements
Thanks to Janet and Stuart Morant for hosting the site. This site was supported by Meat and Livestock Australia, Caring for Our Country, Agriculture Victoria and Future Farm Industries CRC through the National EverGraze Project.
 |
 |
| |
Further Information
- Improving pasture productivity in hill country
- EverGraze Action – Identifying native pastures in Victoria
- EverGraze Action – Growing and using winter active tall fescue
- Primefact – Cocksfoot
- EverGraze Exchange – Nuts and Bolts of Grazing Management
- EverGraze Action – Managing native pastures in Victoria
- Holbrook EverGraze Proof Site – Integrating native pastures
- EverGraze Action – Dividing up the farm for grazing management
- EverGraze Action – Identifying native pastures
- Broadford Grazing Experiment
- Chiltern EverGraze Proof Site key message: Composition and production from native pastures in response to fertiliser and rotational grazing
- Chiltern EverGraze Proof Site – Ecology of Microlaena
- Orange EverGraze Proof Site – Landscape variability can be identified, mapped and managed
- Costs and Returns used for Victorian Case Studies
