South Coast Sandplain WA – Climate
Rainfall
Geographical distribution
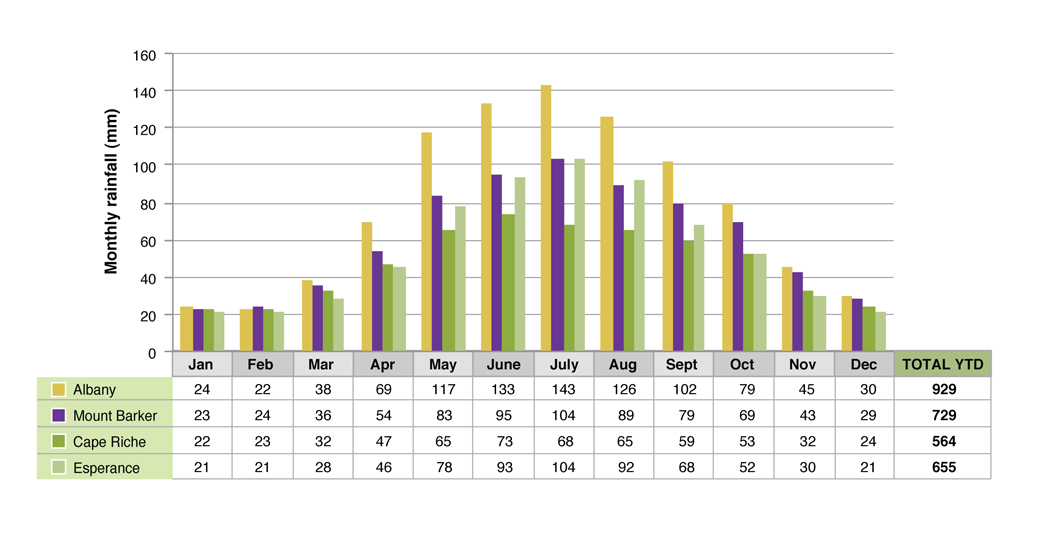
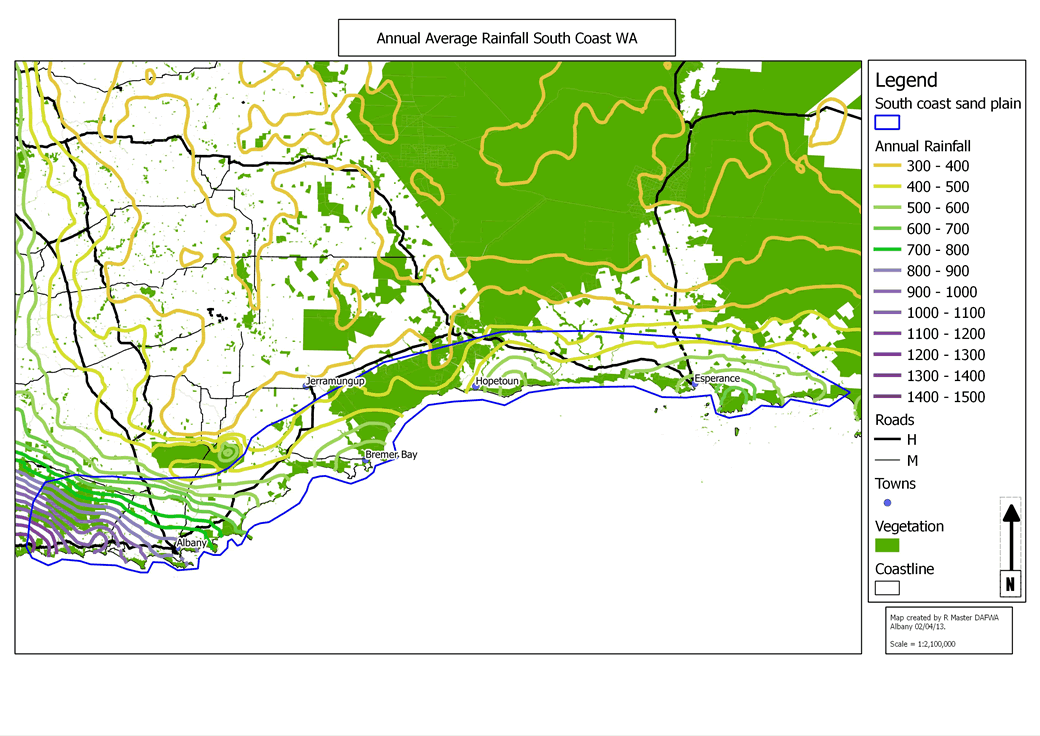
Figures 1 and 2 show the seasonal and geographical distribution of rainfall in for the South Coast Sandplain of WA. The climate in the west and east of the region is Mediterranean with cool wet winters and dryer hot summers. There is however a reasonable amount of summer rainfall, increasing near the coast.
The Eastern Sandplain also has occasional monsoonal influences linked to degraded low pressure systems that originated in cyclones that have crossed the north-western coast and have passed overland to Esperance.
In the western part of the zone the rainfall is between 900mm to 450mm near Albany. In the eastern part of the zone near Esperance rainfall varies between 650mm and 400mm. Rainfall in both areas declines sharply as you move away from the coast. The highest rainfall areas lie west of Albany with annual rainfall reaching over 1250mm, a good proportion of which falls outside of the growing season.
Seasonal variability
A series of graphs is available which shows the seasonal variation of rainfall for the towns of Albany, Cape Riche, Esperance and Mount Barker in South Coast WA.
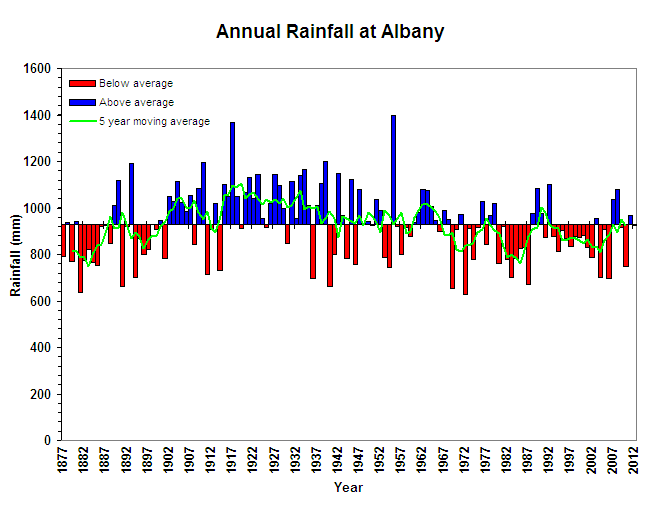
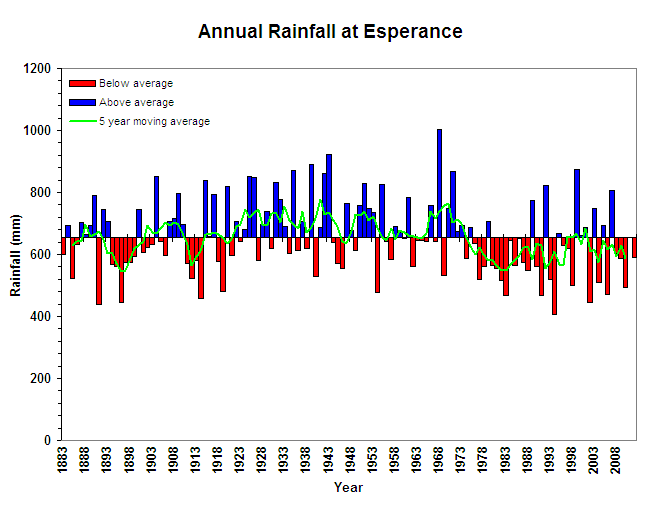
The south coast of Western Australia is prone to significant seasonal variability. However there are some trends that have become evident across the region. In both Albany and Esperance a clear trend can be seen in the five year moving average. As can be seen in Figure 3 there is a clear drop in the five year moving average from about the mid to late 60’s which seems to have stabilised at a lower level.
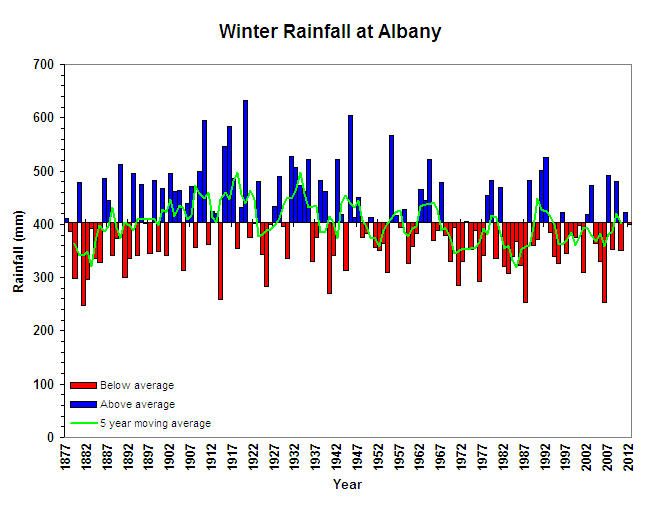
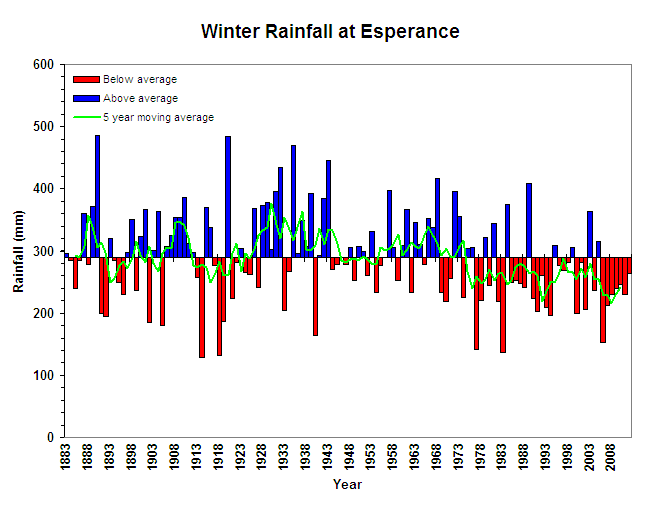
It is evident that most of this change has occurred in the autumn and winter rainfall (Figure 4). There appears to be no real trends in spring and summer rainfall for Albany, although Esperance appears to have had an increase in summer rainfall since the mid 90’s with no significant change in spring rainfall, which is driven by increased monsoonal activity and is highly variable.
The increase in summer rainfall has tempered the drop in average annual rainfall in Esperance, which would have been far worse if not for the increase in summer rainfall. For Albany the drop in autumn and winter rainfall has been more modest, however it has not coincided with an increase in out of season rainfall and has therefore resulted in a drop in the average annual rainfall.
The increase in summer rainfall in Esperance could potentially cause issues for harvesting of crops and pastures, however it will increase the potential out of season production possible in perennial pastures. In Albany a decrease in winter rainfall may increase the viability of cropping, which has been creeping south. Perennial farming systems will have a significant role with a high proportion of the rainfall occurring out of season, especially in areas closer to the coast.
Temperature
Graphs of seasonal temperature trends for Albany and Esperance are available. Seasonal temperature changes in both average maximum and minimum have been observed in the South Coast region with both Albany and Esperance having seen rises. The strongest shifts in Albany and Esperance have been in the average annual minimum temperature. This shift has occurred in the early to mid 70’s and seems to have stabilised at a higher level (Figure 5).
A shift is also evident in the average maximum temperature. In Esperance, there appears to have been a significant shift in the early 70s. A trend is also evident in Albany however this appears to have been delayed until the mid 90’s.
These upward trends in temperature have both a positive and negative impact. Increases in minimum and maximum temperatures could result in higher pasture growth rates, less frosts and better winter pasture growth rates. The down side however, is that in areas receiving lower rainfall, less of this may be effective due to increased evaporation rates. This is of course dependent on rainfall distribution and the spatial variability of temperature trends, though this upward trend has been observed in various centers across the region.

