North East Victoria, South West Slopes NSW, South West Victoria (Upper) – Climate
Geographical distribution
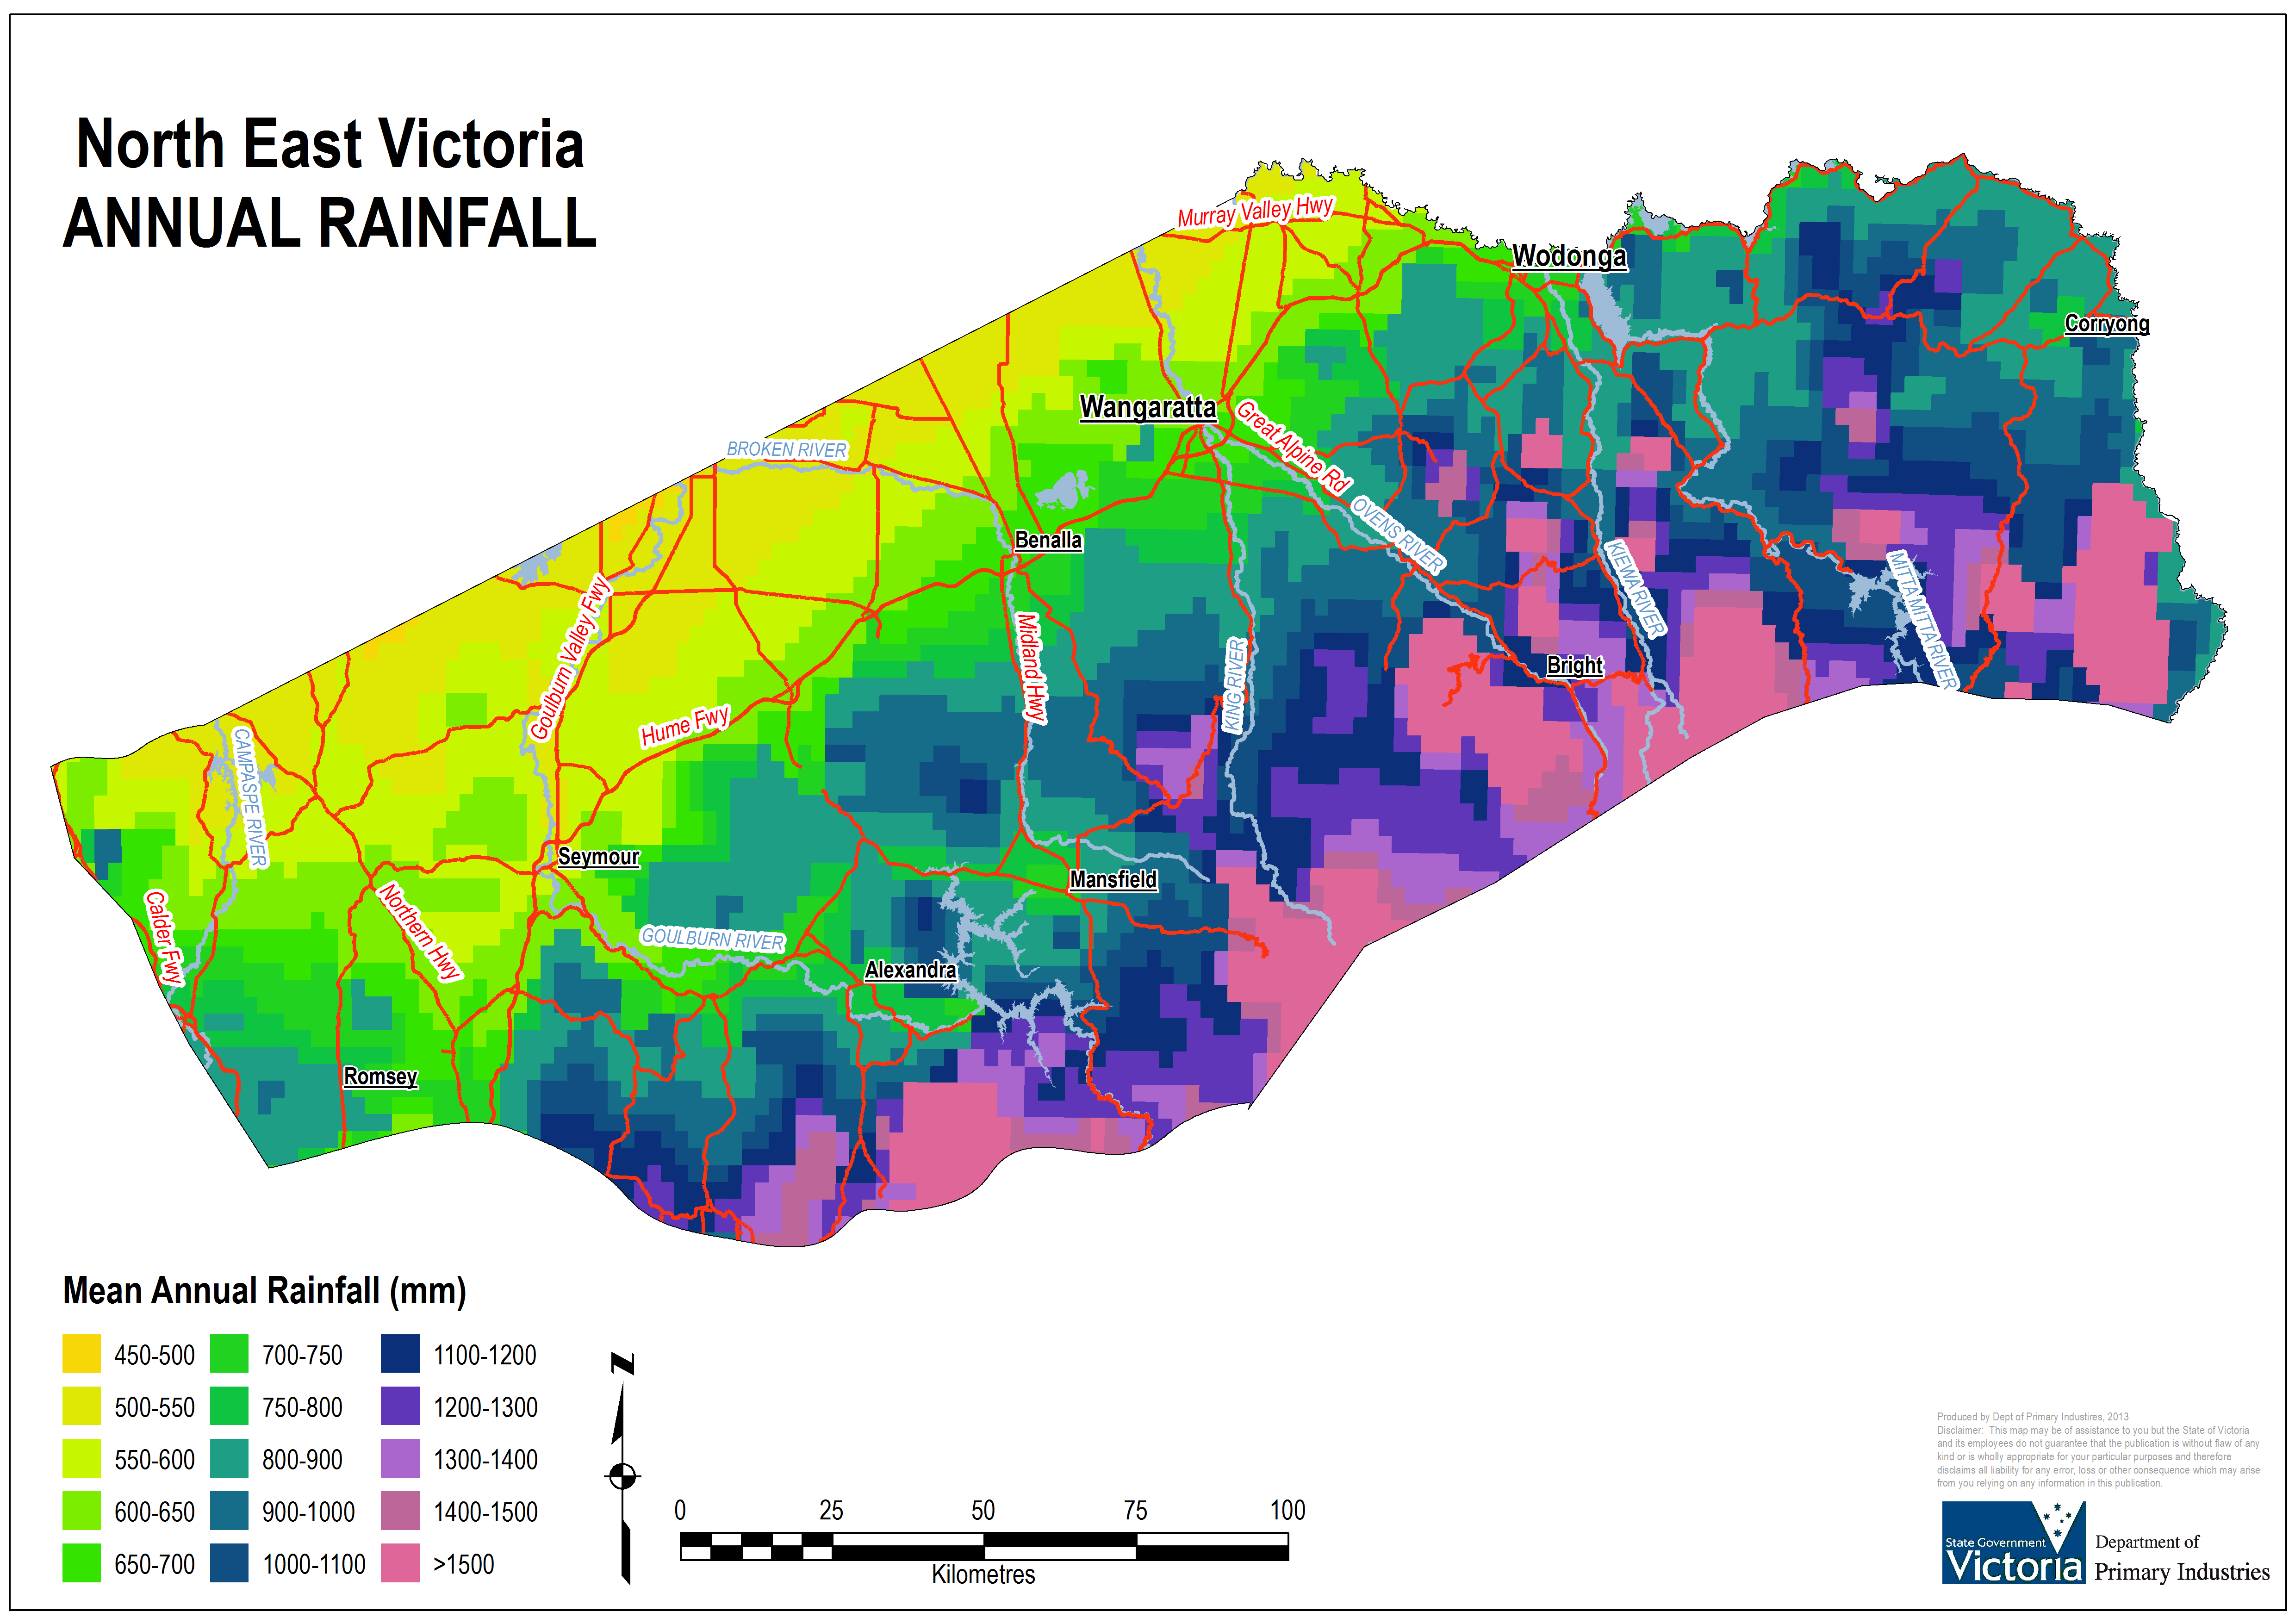
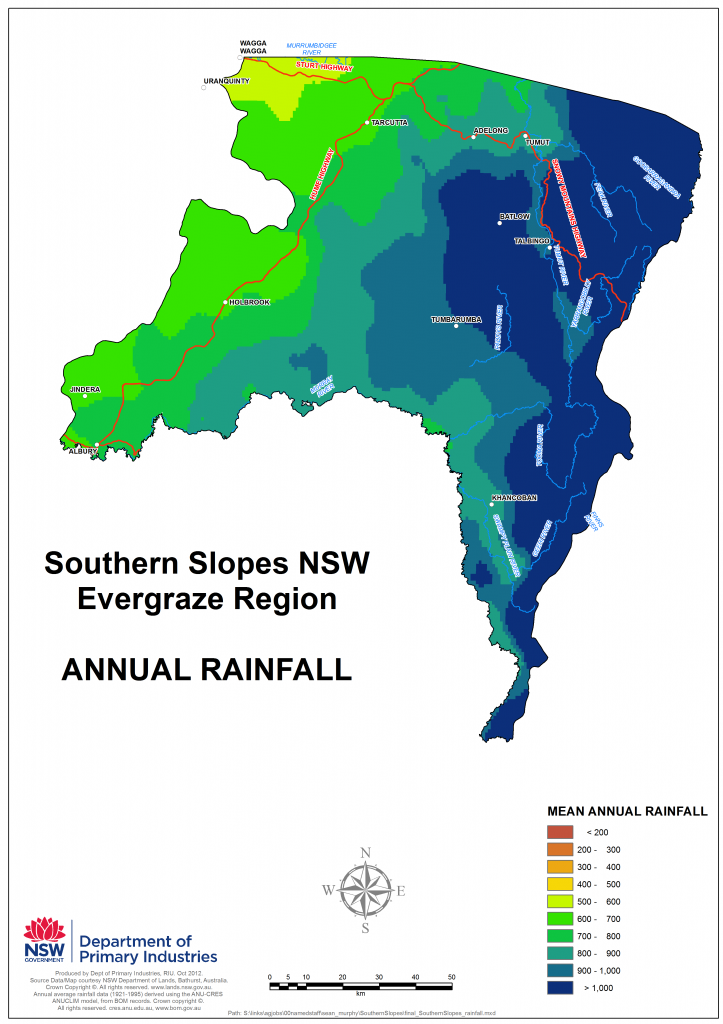
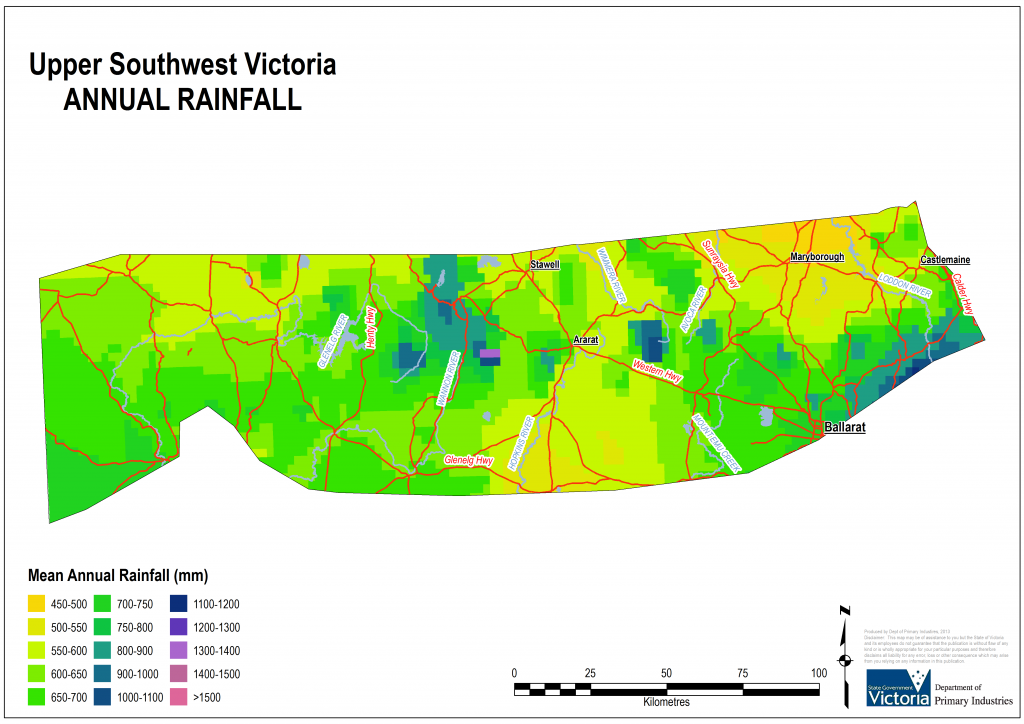
This region follows the Great Dividing Range through southern NSW and into Central Victoria and takes in the slopes that drop down towards the interior of the continent. In an Australian context, it represents part of the ‘High Rainfall Zone’. However, some of the area experiences annual rainfall that is marginal for the persistence of many perennial pasture species (below 550mm), particularly in Upper South West Victoria (Figure 3). The major towns where long term climate data is available are often located in the lower slopes and have annual rainfall between 600mm and 700mm but significant portions of the region are at higher altitudes and have annual rainfall well in excess of this. In the high country of North East Victoria average annual rainfall is often more than 1000mm (Figure 1).
|
|
|
|
|
|
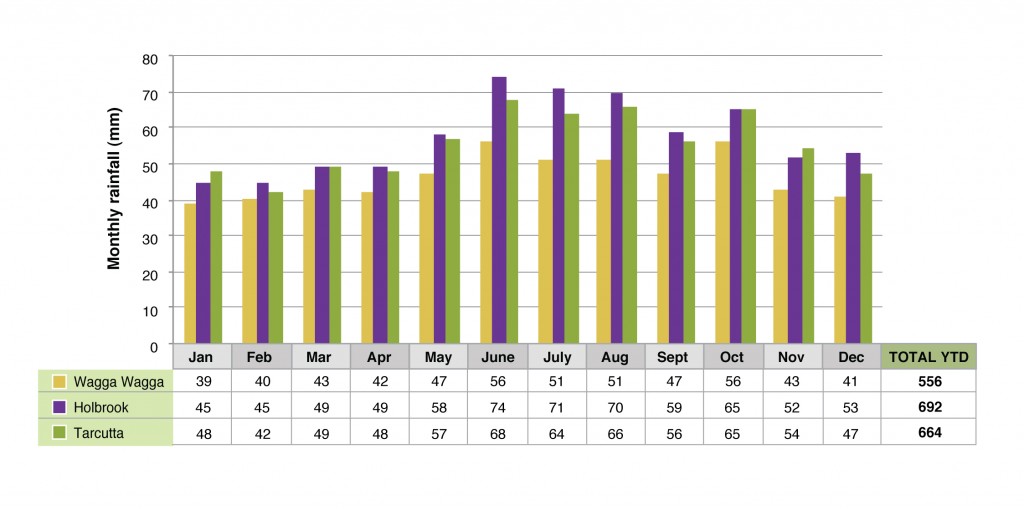
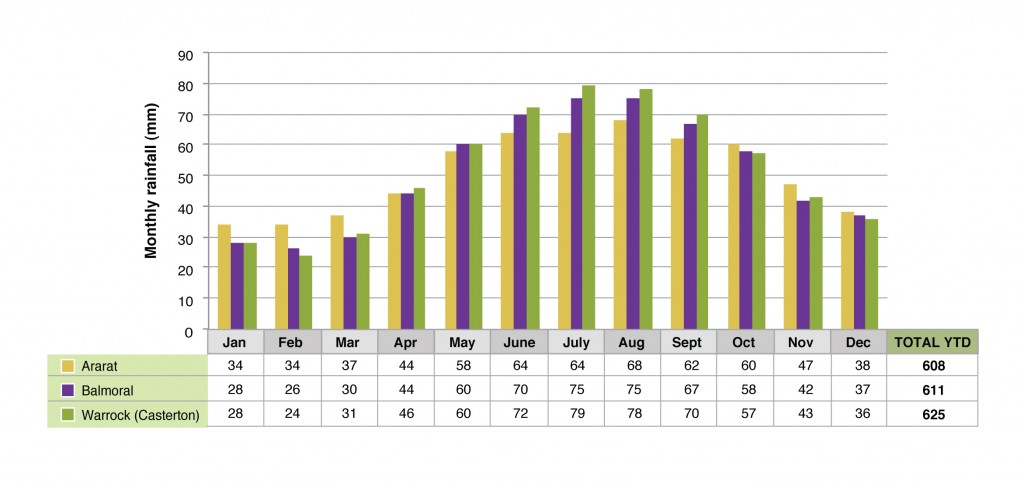
Rainfall pattern
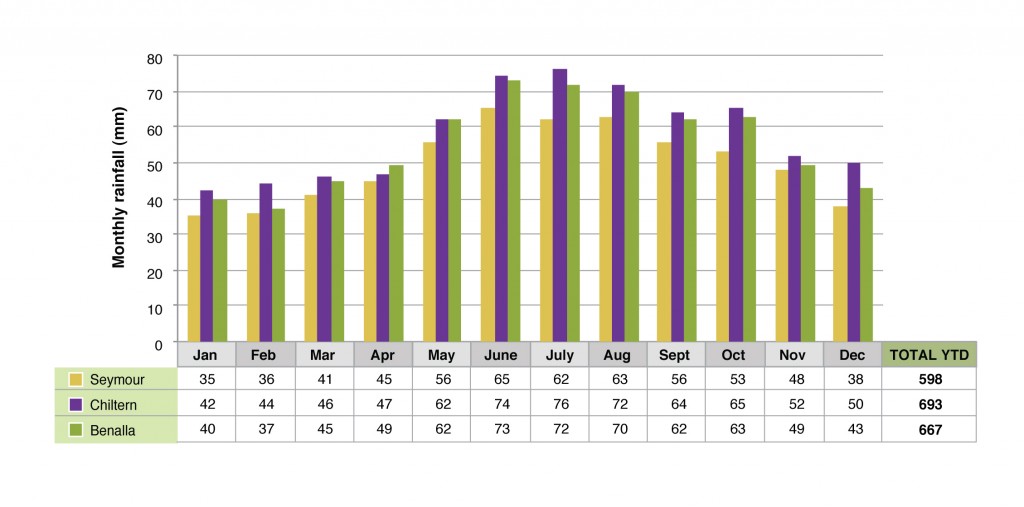
Rainfall patterns across the region are typical of winter dominant rainfall zone with a stronger winter trend as you move south. The Victorian Upper South West experiences dryer summers on average than the NSW South West Slopes and North East Victoria. Plant dormancy, or an ability to extract moisture from depth, will be important traits for perennial plant survival in this part of the region and needs to be considered when establishing new pastures.
A full set of seasonal rainfall figures for selected locations in North East Victoria, Southern NSW and Upper South West Victoria are available.
|
|
|
|
|
|
Seasonal variability
Average rainfall figures are useful in explaining general limits on pasture production and livestock enterprise limitations but there is considerable variation from the average both between and within years. Rainfall is the biggest driver of pasture and crop production and therefore represents the most important climatic risk which producers need to understand and manage for. Pasture systems established and the accompanying management strategies need to reflect this potential variation as do the animal systems applied to them. While rainfall patterns in a district will follow a long term trend there is usually little relationship between rainfall received in one year and the next or even between autumn and spring. Variation in the amount of rainfall is only one aspect to consider. When it falls is also crucial. The timing of the autumn break potentially has a bigger impact in grazing systems, where it has a huge impact on feed availability in winter, compared to crops which have greater flexibility of sowing dates but may be more affected by spring conditions. Tools such as Rainman™ can help producers explore seasonal variation and when autumn breaks occur using localised weather data and may be useful for farm planning decisions. One of the predictions from climate change models for this region is a change in autumn rainfall patterns. For long term planning, producers and advisers would be wise seek out appropriate information and training on the predicted outcomes of climate change to make informed decisions.
A full set of seasonal rainfall figures for selected locations in North East Victoria, Southern NSW and Upper South West Victoria are available. Figure 7 shows 1883-2012 trends for Benalla.
 |
 |
 |
 |
| Figure 7 Annual, autumn, spring and summer rainfall variation at Benalla (1883 – 2010) | |
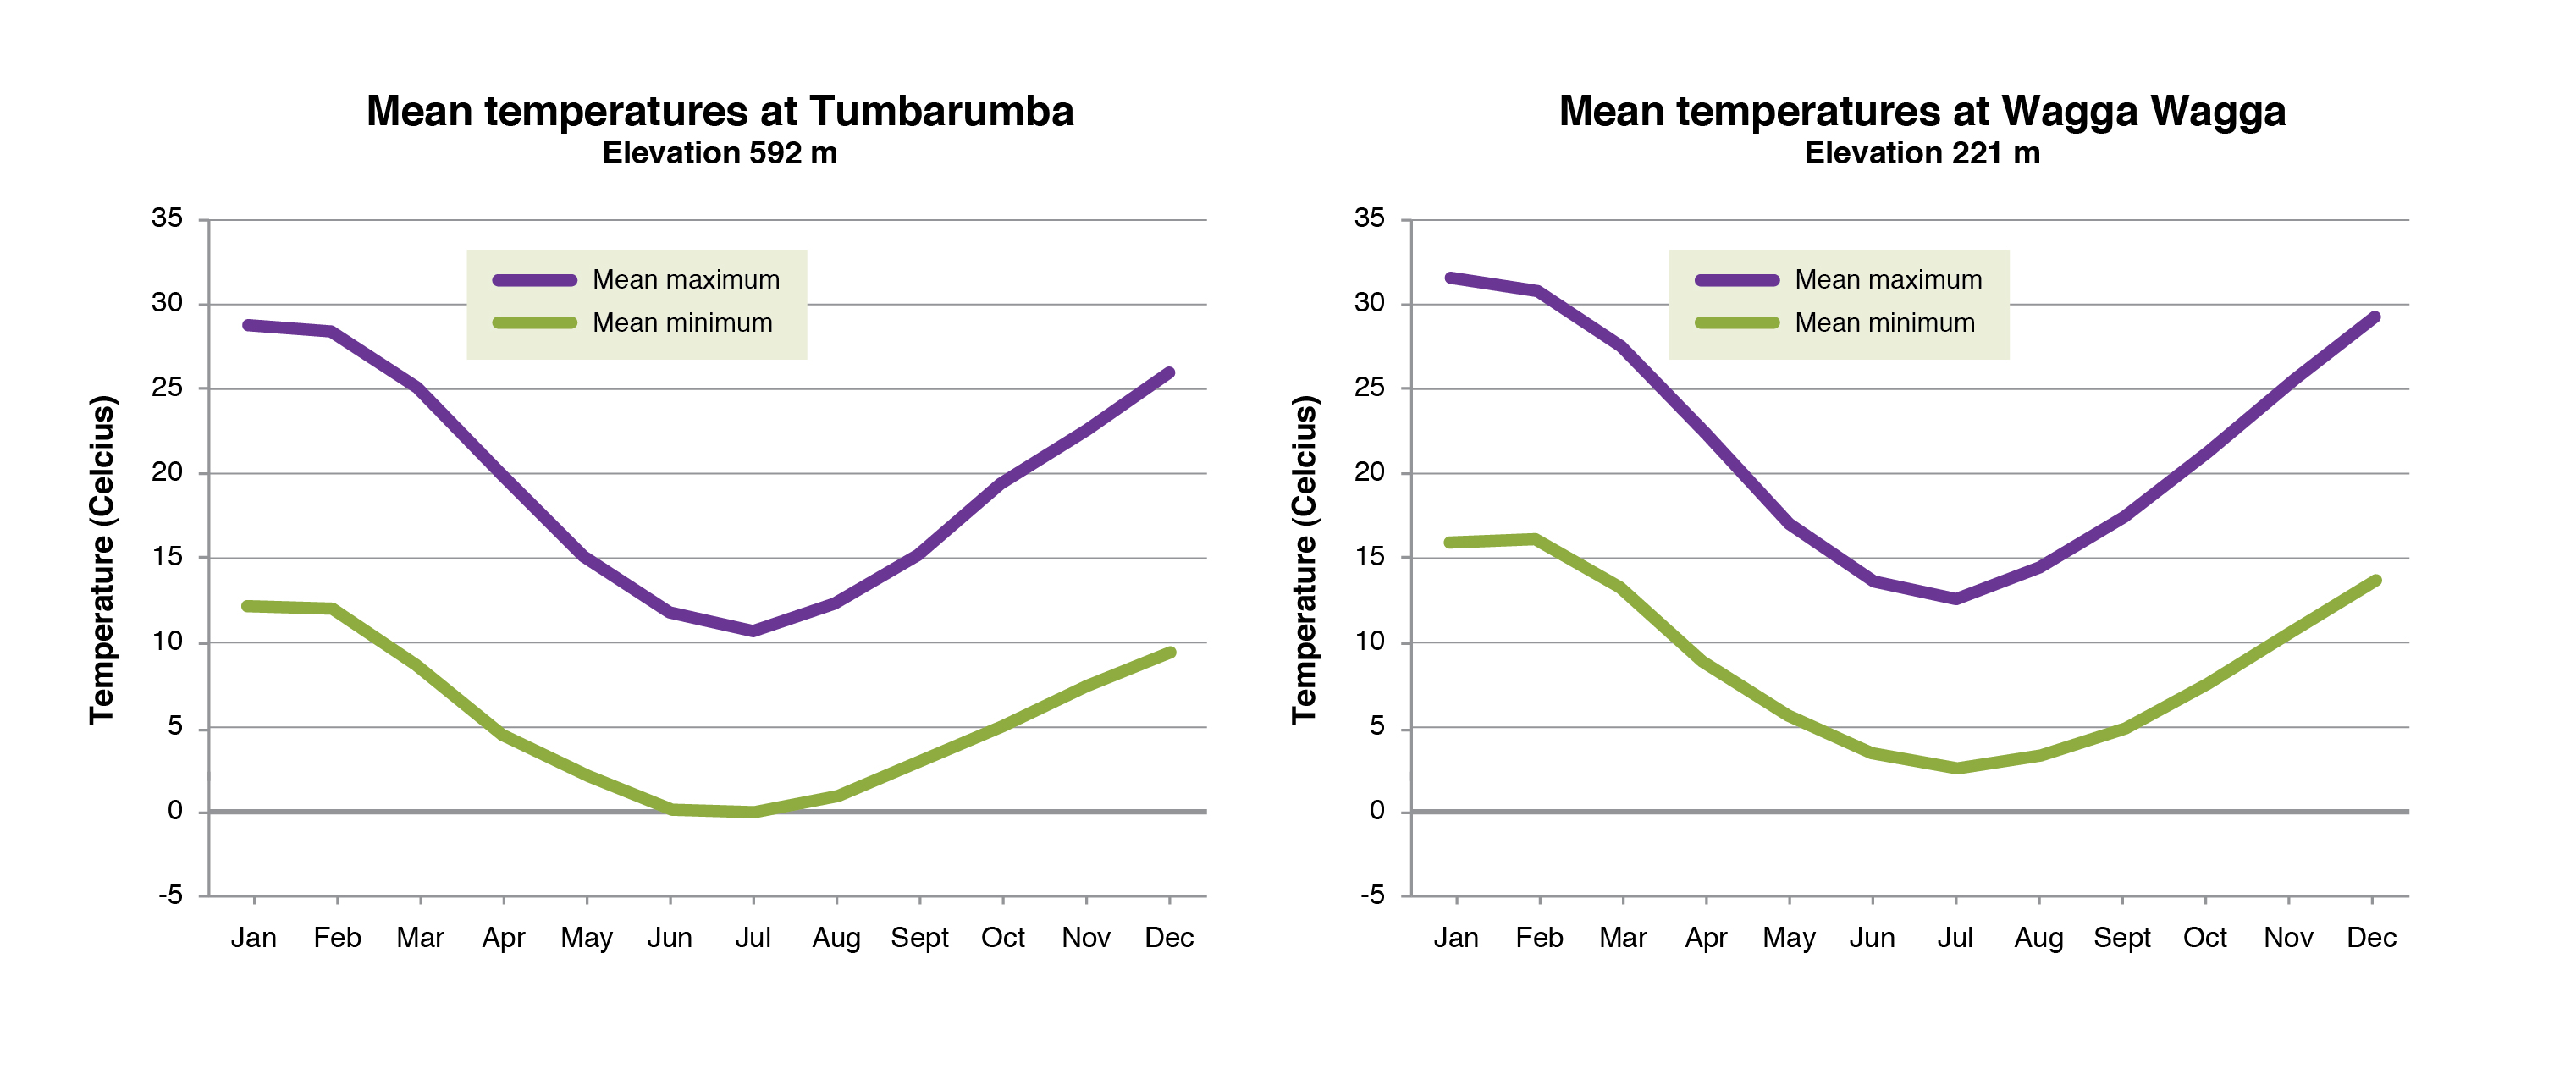
Temperature
Temperature is a key driver of plant growth and development and small changes in temperature can translate to significant growth and water use differences. Extremes of temperature will not only impact on plants but can also affect livestock. There is a strong association between altitude and temperature. Figure 8 shows the differences in maximum and minimum temperatures for Tumbarumba and Wagga Wagga. These towns are only 110km apart and the difference in elevation is just 371m, yet there are significant temperature differences over the entire season. The higher rainfall associated with increased altitude at Tumbarumba does not translate to greater pasture growth in winter due to the lower temperatures but it does extend pasture growth in late spring and summer compared to Wagga Wagga. Conversely, the higher temperatures experienced at Wagga in late spring and summer limit plant growth compared to Tumbarumba, effectively shortening the growing season, but resulting in better winter pasture growth. Similar trends are evident in North East Victoria between the plains (eg. Benalla, Seymour, Rutherglen) and the higher altitude slopes (eg. Tallangatta, Mansfield, Alexandra).
|
|
Sites that have reliable long term temperature data are surprisingly scarce in this region which presents a few challenges when trying to understand climate interactions and impact. Two good data sets are from Rutherglen (Agriculture Victoria Rutherglen) and Wagga Wagga, which span 100 years. This data can be used to highlight the potential variation in maximum and minimum temperatures that are experienced in the region. Like rainfall, temperatures also vary from season to season. While the spread of results is not as big as that experienced with rainfall, it should be noted that a small variation in temperature has a big impact of water use and plant growth. The higher temperatures experienced during the recent drought are interesting and explain much of the impact on pastures during this period. It also highlights some potential issues if we experience warmer conditions in the future. However, this data with its limited range of years, can in no way be used to demonstrate any shift in climatic conditions.
 |
 |
| Figure 9. Average maximum and minimum annual temperature at Rutherglen (Graph courtesy of Agriculture Victoria) | |
 |
 |
| Figure 10. Average maximum and minimum annual temperature at Wagga Wagga (Graph courtesy of Agriculture Victoria) | |
Authors
Nigel Phillips, Department of Primary Industries, NSW
Dale Grey, Agriculture Victoria
Kate Sargeant, formerly Agriculture Victoria Benalla
