North East Victoria – Rainfall Trends

The following series of graphs show the average monthly rainfall (Figure 1) and seasonal variation (Figures 2-16) for the towns of Benalla, Chiltern and Seymour in North East Victoria.  Seasonal trends for the region are discussed in North East Victoria, Southern NSW, South West Victoria (Upper) climate regional context.
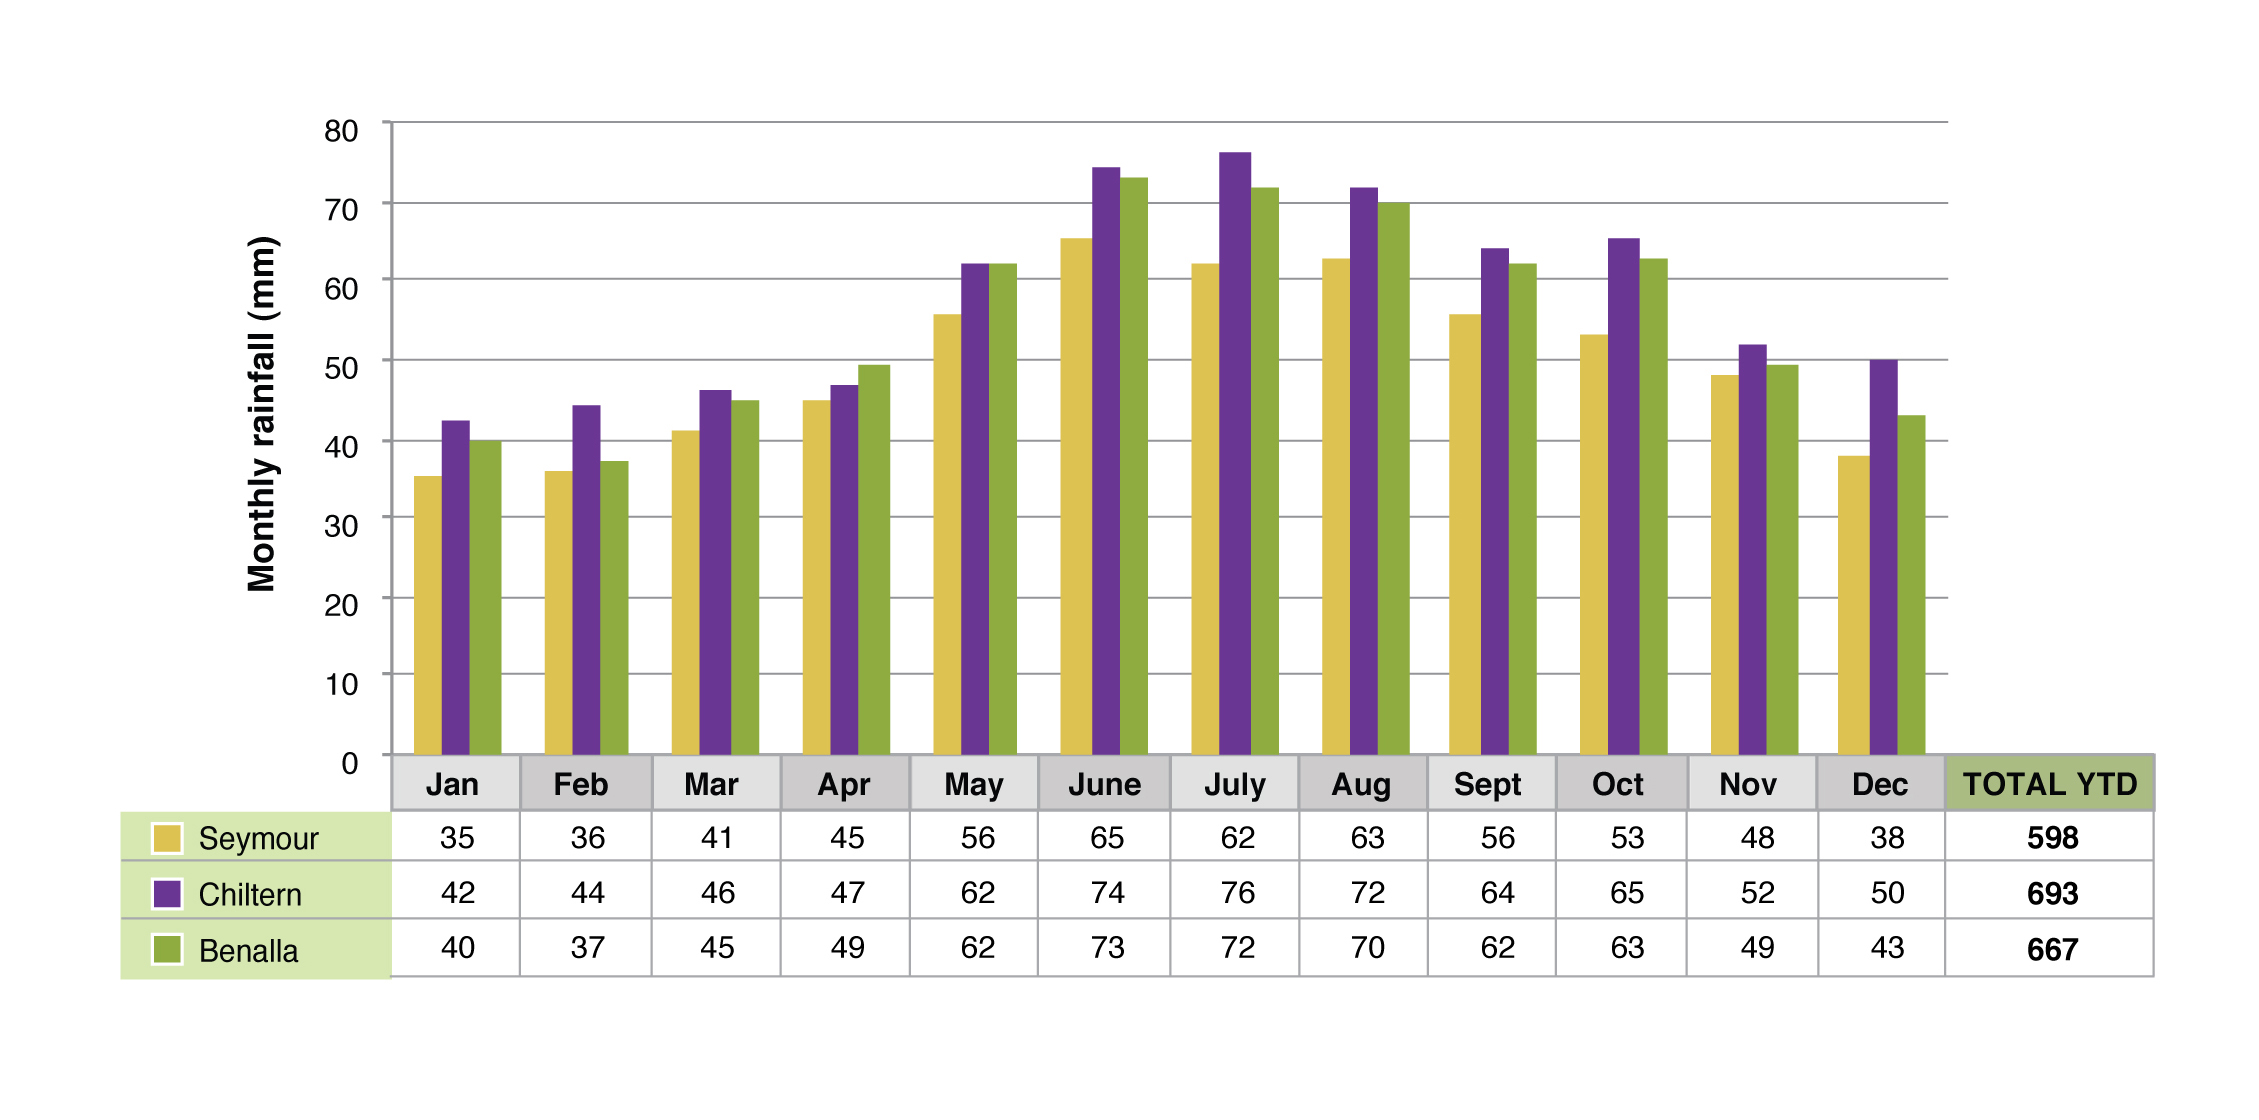
Figure 1. Monthly rainfall for the towns of Seymour, Chiltern and Benalla (Graph courtesy of DPI Victoria)

Click on the region below to see the rainfall trends for your area.

Benalla

Figure 2. Annual Rainfall at Benalla (Graph courtesy of DPI Victoria)
Figure 3. Autumn Rainfall at Benalla (Graph courtesy of DPI Victoria)
Figure 4. Spring Rainfall at Benalla (Graph courtesy of DPI Victoria)
Figure 5. Summer Rainfall at Benalla (Graph courtesy of DPI Victoria)
Figure 6. Winter Rainfall at Benalla (Graph courtesy of DPI Victoria)

Chiltern

Figure 7. Annual Rainfall at Chiltern (Graph courtesy of DPI Victoria)
Figure 8. Autumn Rainfall at Chiltern (Graph courtesy of DPI Victoria)
Figure 9. Spring Rainfall at Chiltern (Graph courtesy of DPI Victoria)
Figure 10. Summer Rainfall at Chiltern (Graph courtesy of DPI Victoria)
Figure 11. Winter Rainfall at Chiltern (Graph courtesy of DPI Victoria)

Seymour

Figure 12. Annual Rainfall at Seymour (Graph courtesy of DPI Victoria)
Figure 13. Autumn Rainfall at Seymour (Graph courtesy of DPI Victoria)
Figure 14. Spring Rainfall at Seymour (Graph courtesy of DPI Victoria)
Figure 15. Summer Rainfall at Seymour (Graph courtesy of DPI Victoria)
Figure 16. Winter Rainfall at Seymour (Graph courtesy of DPI Victoria)
loader

Generating PDF - please wait

NOTE: Depending on the size of the page this may take a while (Click on "Cancel" to stop PDF generation)

Cancel