Lamb production from native pastures at Chiltern EverGraze Proof Site
Native pastures can form the basis of a successful store lamb production system with good weaning weights and acceptable reproductive performance. Higher stocking rates achieved through the use of higher fertiliser applications will enable greater per hectare production. However the extra costs associated with these higher fertiliser applications are not offset in the first two years of capital application and are only justified under an extended period of higher production and maintenance fertiliser rates. At low stocking rates and when herbage mass is not limiting, there is no production benefit associated with rotational grazing.
Main findings
High weaning percentages on native pastures when ewes were managed to Lifetimewool condition scores
- When managed to Lifetimewool condition score recommendations (average 2.7 at lambing and with a 0.5 condition score loss post lambing), weaning percentages of dual purpose Merino (CentrePlus) ewes joined to terminal (Dorset) sires grazing native pastures were high (117%-126%).
Native pastures suited store lamb production
- At Chiltern EverGraze Proof Site, on native pastures comprising Microlaena stipoides, low quality annual grasses and very low clover, average lamb growth rates to weaning (November) ranged from 206 g/hd/day – 320 g/hd/day (depending on season), equating to average weaning weights of 29-32 kg respectively.
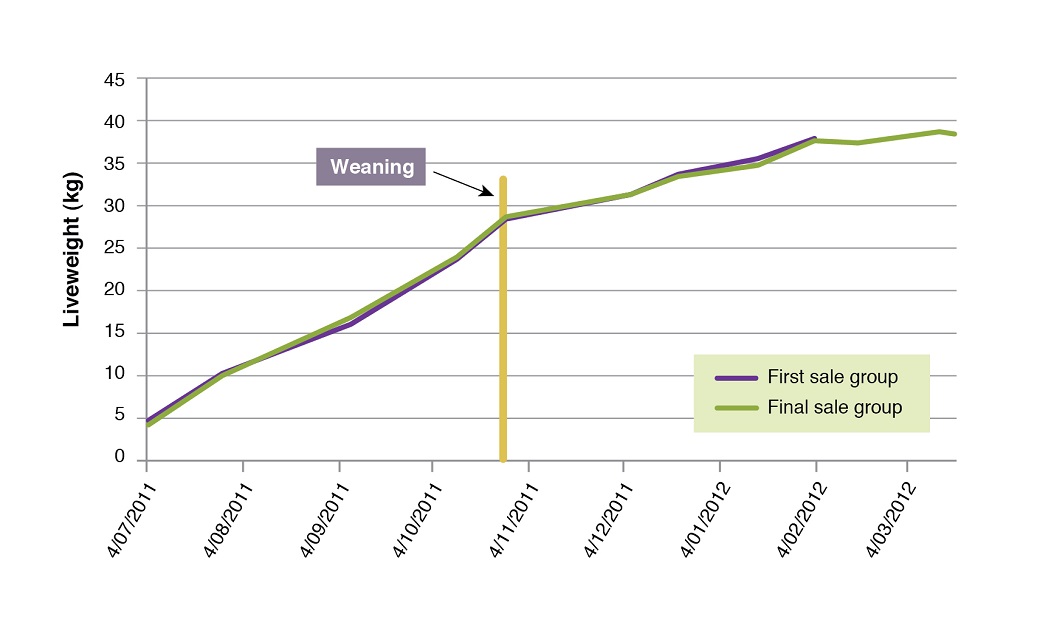
- In one good year when lambs were taken beyond weaning, post weaning growth rates declined to a point where productivity was compromised – the first sale group averaged only 96 g/hd/day from weaning through to sale (start of February), while the group that was retained longer (mid-March) only averaged 67 g/hd/day.
Response to capital fertiliser rates insufficient to justify the cost until dropped to maintenance levels
- There was no difference in herbage mass between high fertiliser input (21 kg P/ha every year) and low fertiliser input (11 kg P/ha every second year). This indicates that the pasture production response to the higher fertiliser rates was equivalent to the consumption of the additional ewes carried on the high fertiliser treatment (5 ewes/ha compared to 3 ewes/ha).
- The higher stocking rate system had greater per hectare lamb production (78 kg/ha – 165 kg/ha) than lower stocked treatment (49 kg/ha -101 kg/ha) despite the fact that per head production at higher stocking rates tended towards lower weaning weights (average 32 kg vs 36kg).
- Whilst it might be expected that there would be a difference in ewe condition score and liveweight between stocking rate and rotational grazing treatments, this was not the case indicating that even at the high stocking rate, pasture availability was not limiting performance.
- The higher stocking rate (5 ewes/ha vs 3 ewes/ha) in the high fertiliser treatment resulted in an increase in per hectare lamb production (average 39 kg/ha equating to $96/ha additional income) and wool income ($52/ha). However this was insufficient to offset the additional fertiliser, feeding and other additional operating expenses during the experiment.
- In a modelled scenario, when the high fertiliser rate was dropped back to maintenance and high stocking rates were still maintained, the gross margin of the high stocking scenario was $98/ha compared to $86/ha for the low input set stocked system.
Lower per head production from rotational grazing
- At the higher stocked rates, the set stocked treatment had 13.2-31.1kg/ha greater lamb production at weaning than the rotationally grazed treatment. This is in line with the trend towards greater per head performance that was observed in the set stocked treatments, and has also been observed in other experiments (eg. Orange Proof Site). To capitalise on implementation of rotational grazing, higher stocking rates to achieve greater utilisation would be required (see Broadford Grazing Experiment and Orange Proof Site).
Read more about this research
The opportunity
[expand title=” ” swaptitle=” ” tag=”h4″ elwraptag=”div” elwrapclass=”expend-collapse-wrapper”]
There are three ways in which profit can be improved on native pastures: grow more, utilise a higher proportion and/or graze with higher value livestock. Fertilising native pastures may improve productivity (Graham, 2006, Garden et al., 2003) but it is important to note that much of the response to fertiliser comes from the naturalised introduced species rather than the native grasses. This presents a difficulty when competition from fertilised annuals threatens the perennial native pasture. The benefits of using fertiliser must be captured by utilising the extra growth, which means increasing stocking rate.
The pasture base
Native pastures, ie. those pastures where the main perennial species is a native grass are often referred to as an ‘unimproved’ component of a farm system. This may be appropriate, as in many cases these pastures are typically run down, suffer from a decline in native species, and in some cases natives have nearly disappeared altogether, while some introduced species (particularly low value annual species) have successfully increased.
The animal component
Typically these ‘unimproved’ native farm areas have been run in isolation to the rest of the farm, and as such have often sustained their own animal enterprise – typically a lower value enterprise such as Merino wethers.
Research at Chiltern was based on a higher value livestock enterprise ie. ewes and lambs as opposed to dry sheep such as Merino wethers. In addition work at Holbrook investigated the opportunities to integrate the native pasture component of a farm with the introduced pasture component. This page focusses on the livestock production results from fertiliser and grazing treatments on the low quality native pasture at Chiltern, grazed with a high value ewe and lamb enterprise. The impacts of pasture management (grazing method and fertiliser applications) on pasture composition, production and quality, and a more detailed context of the experiment at Chiltern, can be found here. Results from a similar experiment conducted on higher quality native pastures on a variable landscape at Orange can be found here.
[/expand]
What was done?
Chiltern grazing and fertiliser treatments
[expand title=” ” swaptitle=” ” tag=”h4″ elwraptag=”div” elwrapclass=”expend-collapse-wrapper”]
The three Chiltern treatments are detailed in Table 1. At the commencement of the research (2008), the 3 ha plots were stocked with three-year-old Merino ewes of a known dual purpose bloodline (CentrePlus breeding). Ewes were run on native pastures and joined to terminal (Dorset) rams in February for a winter lambing. Ewes were pregnancy scanned 40 days post joining and then allocated to experimental treatments. Ewes were allocated to the experimental plots post scanning to ensure equal numbers of twins and single lambs within each experimental treatment.
Table 1. Treatments implemented at the Chiltern EverGraze site
| Treatment | Fertiliser | Stocking rate | Grazing management |
| Low fertility set stock | 125 kg/ha single super-phosphate (11 kg/P/ha) applied every second year | Low | Set stocked |
| High fertility set stock | 250 kg/ha (21 kg P/ha) single super-phosphate annually | High | Set stocked |
| *High fertility simple rotation | 250 kg/ha (21 kg P/ha) single super-phosphate annually | High | Simple four paddock rotation (two weeks grazing followed by six weeks rest). |
*A fourth treatment which was exactly the same as the high fertility simple rotation, with the exception of set stocking used for lambing, was also included but did not present any significantly different results, and has therefore been excluded here.
Pastures
[expand title=” ” swaptitle=” ” tag=”h4″ elwraptag=”div” elwrapclass=”expend-collapse-wrapper”]
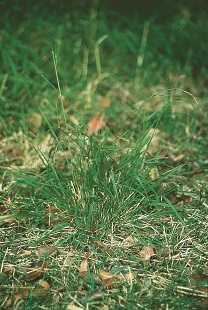
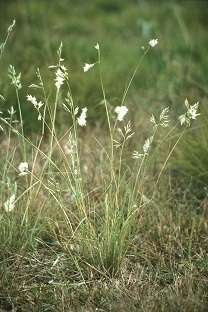
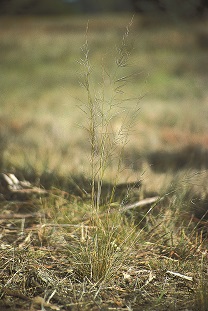
The major species found at the site (representing >5% of the herbage mass) were weeping grass (Microlaena stipoides), sweet vernal grass (Anthoxanthum odoratum), wallaby grass (Rytidosperma spp., previously Austrodanthonia spp.), spear grass (Austrostipa spp.), pigeon grass (Setaria pumila), silver grass (Vulpia myuros), onion grass (Romulea rosea) and Yorkshire fog grass (Holcus lanatus). Legumes made up 0-1.5% of pasture composition throughout the experiment. Soil fertility was maintained at Olsen P 6 mg/kg in the Low Fertiliser treatment and was lifted to 12 mg/kg in the High Fertiliser treatment. There was no composition change in response to the increased soil fertility due to lack of fertiliser-responsive species. See the pasture composition key message for further detail.
Sheep management
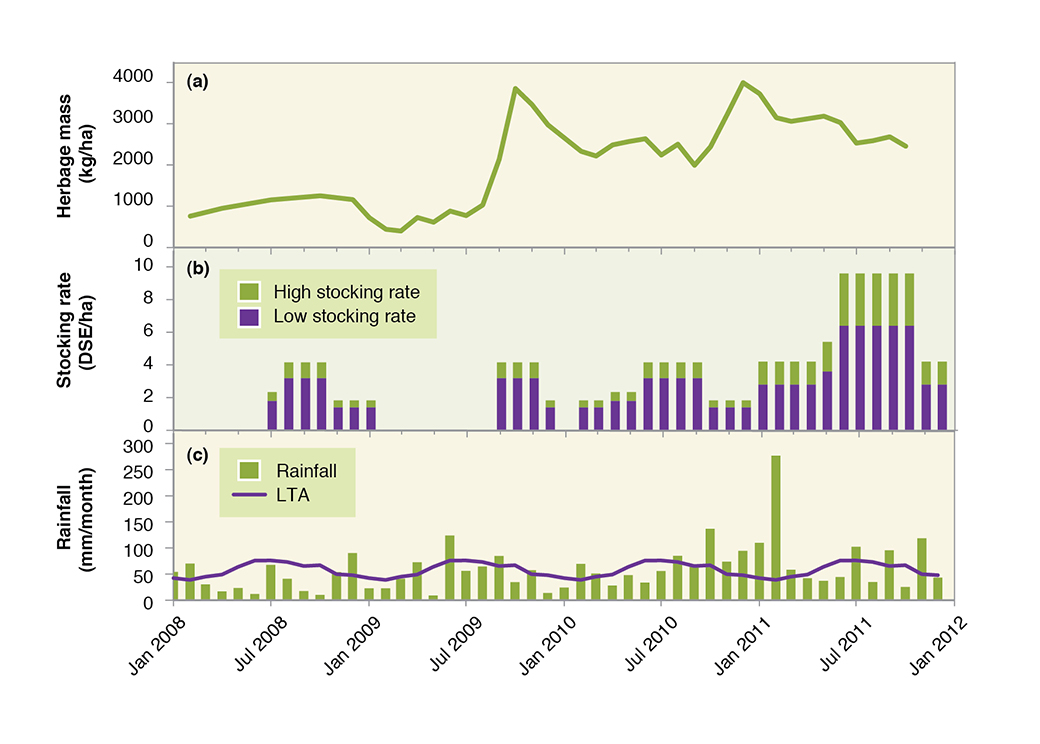
Sheep were taken off the plots if pasture mass and/or ground cover fell below the critical limits (800 kg DM/ha and/or 70% groundcover respectively). Stocking rates were reassessed each winter and varied between years depending on available herbage mass at that time.
Due to the continued dry conditions in 2009 ewes and lambs were only intermittently grazed on experimental plots. Accordingly no livestock results are presented for this period, as animal performance in this period is predominantly due to grazing areas outside of the treatment plots, and not due to the treatments themselves.
In all but the final year lambs were sold at weaning. In the final year, lambs were retained beyond weaning so that post weaning growth rates could be assessed on native pastures. Weaning occurred between 12 and 17 weeks post the average lambing date, depending on seasonal conditions.
Ewes were joined to terminal sires (Dorset) selected for low birth weight Australian Sheep Breeding Values.
[/expand]
What was found?
Rainfall, herbage mass and stocking rates
[expand title=” ” swaptitle=” ” tag=”h4″ elwraptag=”div” elwrapclass=”expend-collapse-wrapper”]
The rainfall was variable over the experimental period (Figure 1c). Rainfall for 2008, 2009 and the start of 2010 were below median (682 mm), whereas rainfall for 2011 was above average, with 276 mm received in February 2011. Herbage mass and stocking rates followed seasonal trends (Figures 1a,b). Stock were removed for extended periods during the dry years of 2008 and 2009, while in 2010-2012, plots were under-utilised due to exceptionally good seasonal conditions. There was no significant soil fertility/stocking rate or grazing treatment difference in herbage mass throughout the experiment. Despite a greater level of pasture consumption associated with the higher stocking rates, there was actually no difference in herbage mass between the two. This indicates that pasture production was greater within the high fertiliser/high stocking rate treatment.
Reproduction and ewe condition
[expand title=” ” swaptitle=” ” tag=”h4″ elwraptag=”div” elwrapclass=”expend-collapse-wrapper”]
Whilst there was no treatment effect on ewe reproductive rates (given that ewes were joined out of experimental plots and then allocated to plots based on pregnancy scan data) the average reproduction rates highlight that high reproduction rates can be achieved from running ewes on a native pasture system when Lifetimewool regional guidelines for condition management are followed. Weaning rates from 2008, 2010 and 2011 averaged 117%, 117% and 120% respectively. This compares to district average marking percentages for Merinos joined to terminal sires of 72% in 2009/10 and 79% in 2010/11. The top 20% for wool sheep was 83% in 2010/11.
Ewe condition within the treatments were managed in line with Lifetimewool regional guidelines for managing Merino ewes with a late winter/spring lambing on the Southern Slopes of NSW, targeting condition score (CS) 2.75 at joining and with a 0.5 CS drop through pregnancy. Condition was monitored and when required supplementary feeding introduced to ensure a return to 2.75 score by lambing. Condition declined (by an average of ½ a score) through to weaning, with ewes regaining condition prior to the next joining. While on an individual basis there was considerable variation in ewe condition within each of the treatment groups, there were no significant differences in ewe live weight or condition profiles between any of the treatment groups.
When supplementary feeding was required, lucerne hay was fed in conjunction with either lamb finishing pellets or oats.
[/expand]
Lamb growth rates
[expand title=” ” swaptitle=” ” tag=”h4″ elwraptag=”div” elwrapclass=”expend-collapse-wrapper”]
Lamb growth rates/live weights through to weaning were well matched to the production of store lambs (Table 2). Across all treatments, average lamb growth rates to weaning (November) ranged from 206 g/hd/day – 320 g/hd/day (depending on season), equating to average weaning weights of 29-32 kg respectively. While seasonally dependent, it is realistic that only small percentages of lambs are likely to fit market specifications for domestic slaughter lambs at weaning on this system. This is supported by previous research (Michalk et al., 2003) which showed that lambs produced on native pasture systems (both fertilised and unfertilised, and tactically and continuously grazed) were unable to reach a target carcass weight of 18-22kg on native pastures alone. In this research lambs were transferred to a chicory pasture for finishing to market specifications. However, lamb growth rates on native pastures can be higher if high quality annual species such as annual ryegrass and sub clover make up significant proportions of the composition. Where this was the case at Orange Proof Site, lambs reached store weights by the end of November when born in September.
Table 2. Average lamb birth, marking and weaning weights (kg) for all treatments, within a weight grade and year, numbers with different subscripts are significantly different.
| 2008 | 2009 | 2010 | 2011 | |
| Birth weights – mid July | ||||
| Low fertility, low stocking rate set stock | 5.4 | * | 5.9 | 4.6 |
| High fertility, high stocking rate set stock | 5.4 | * | 5.3 | 5.0 |
| High fertility, high stocking rate simple rotation | 6.1 | * | 5.1 | 4.8 |
| LSD | 0.8 | 0.8 | 0.6 | |
| Marking weights – mid August | ||||
| Low fertility, low stocking rate set stock | 12.8 | * | 20.9 | 11.0 |
| High fertility, high stocking rate set stock | 13.9 | * | 18.6 | 10.9 |
| High fertility, high stocking rate simple rotation | 13.8 | * | 16.7 | 10.2 |
| LSD | 3.6 | 4.3 | 1.4 | |
| Weaning weights – typically late October | ||||
| Low fertility, low stocking rate set stock | 32.2 | * | 42.2 | 32.3 |
| High fertility, high stocking rate, set stock | 34.0 | * | 37.1 | 30.8 |
| High fertility, high stocking rate, simple rotation | 32.4 | * | 36.0 | 28.0 |
| *LSD | 9.4 | 6.5 | 3.4 | |
*The Least Significant Difference (LSD is the minimum amount between values of each treatment for the difference to be defined as significant.
In all years there were no differences in lamb weights at birth or marking for any of the treatments. There were also no consistently significant differences in lamb weaning weights between grazing or stocking rate/fertiliser treatments.
In 2010 and 2011 lambs from the low stocking rate, set stocked treatment tended to be heavier at weaning than those from the high stocking rate, rotational grazing treatment but this was not significant, in 2008 there was no such trend.
Herbage mass did not fall below 2000 kg/ha in either treatment in 2010 or 2011 (Figure 1), and sheep were fed through lactation to meet condition targets in the dry year of 2008. These factors are likely to have limited differences between stocking rate treatments. In addition, the higher fertiliser inputs had no effect on species composition and so in turn would not have positively influenced lamb growth rates.
There were also no clear differences in weaning weights within the high stocking rate treatments, although there was a trend in each year where the lambs from the set stocked treatment had heavier per head performance than those from the rotationally grazed treatments. This is consistent with findings at Orange EverGraze Proof Site which showed that lambs in a 1-Paddock system were heavier than those in 4-Paddock and 20-Paddock systems. The higher weaning weights in the 1-Paddock system can be attributed to a higher quality diet due to selective grazing of species such as annual ryegrass found in particular parts of the landscape. These differences were also observed in ewes at Orange, with condition score in the 1-Paddock system on average 0.7 higher than in a 20-Paddock system. At Chiltern, perhaps the trend is less pronounced as there were few species of particularly high quality and a fairly consistent landscape, so the selective grazing effect is likely to have been lower. Low utilisation across all treatments in 2010 and 2011 would have also limited treatment differences.
Due to seasonal variations and differing ages when lambs were marked and weaned it is not possible to make comparisons between individual years.
[/expand]
Per head and per hectare performance
[expand title=” ” swaptitle=” ” tag=”h4″ elwraptag=”div” elwrapclass=”expend-collapse-wrapper”]
The greater weaning weights achieved in the low stocking treatment in 2010 and the same trend in 2011 raise an interesting discussion about per head versus per hectare productivity.
The low stocked treatments were run at 2 ewes/ha, while the high stocked treatments ran 5 ewes/ha (having been increased from 3 ewes/ha at the end of 2009). Given the greater number of animals on the higher stocked treatments the gross lamb production on a per ha basis (despite a trend towards lower individual weights) was in all cases greater for the high stocked treatments (Table 3).
Table 3. Lamb production kg per hectare. Numbers with different subscripts are significantly different.
| Weaning weights |
2008 |
2009 |
2010 |
2011 |
| Low fertility set stock |
96.3a |
* |
49.3a |
101.3a |
| High fertility set stock |
136.8b |
* |
91.1b |
165.4c |
| High fertility simple rotation |
106.7a |
* |
77.9b |
147.1b |
| LSD |
18.7 |
14.7 |
18.1 |
Comparing the set stocked treatments, the higher stocking rates resulted in higher per hectare productivity in all years. However the high stocking rate treatments only had greater levels of per ha productivity than the low stocking rate, set stocked treatment in two of the three years (2010 and 2011).
At the higher stocked rates, in 2008 and 2011 the set stocked treatment had significantly greater per ha lamb production at weaning than the rotationally grazed treatment. The same trend existed in 2010, and is in line with the trend towards greater per head performance that was observed in the set stocked treatments.
At other sites (eg. Hamilton on perennial ryegrass, Broadford on phalaris, Orange Proof Site on native pastures and Balmoral on phalaris), stocking rates were adjusted based on herbage mass. In general, although per head production was lower, higher utilisation in rotationally grazed treatments resulted in a 10-20% increase in stocking rate and in turn a 5-20% increase in per hectare production. It is likely this was not observed at Chiltern due to the very dry first two years of the experiment followed by two very wet years when stocking rates were not sufficiently increased to show the benefits of higher utilisation in the rotationally grazed treatment. The relatively uniform landscape (compared to hill country) also reduces the benefits of higher pasture utilisation.
[/expand]
Lamb growth beyond weaning
[expand title=” ” swaptitle=” ” tag=”h4″ elwraptag=”div” elwrapclass=”expend-collapse-wrapper”]
In the final year (2011) that was characterised by high summer rain and greater than average feed on offer, lambs were retained beyond weaning. In this case all lambs were run as a single group and were rotationally grazed through all available plots, but were not subjected to a specific grazing treatment. Lambs were sold in two drafts.
Across the treatments to weaning, growth rates averaged 206 g/hd/day. However, growth rates beyond weaning, at the start of November, declined to a point where productivity was compromised – the first sale group averaged only 96 g/hd/day from weaning through to sale (start of February), while the group that was retained longer (mid-March) only averaged 67 g/hd/day. It was apparent that despite high levels of available DM, beyond this point lambs were unable to source sufficient energy or protein from the native pastures to achieve growth rates required for a ‘finishing phase’.
From a lamb nutrition point of view, 30kg lambs require 17 megajoules metabolisable energy (MJ ME), 15% Crude Protein (CP) to achieve growth rates in the order of 200 g/hd/day. Feed test results for native dominant pastures in early summer returned averages of 8 MJ ME/kg dry matter (DM) and 11% CP, despite higher than average summer rainfall. With a potential feed intake of 1.2 kg DM (4% of body weight) at a pasture average of 8 MJ ME/kg DM, indicates that energy requirements are not being met, hence the sub 200 g/hd/day growth rates. Additionally at dietary protein levels of 11% CP, available protein is well short of requirements and has certainly restricted lamb growth rates.
To achieve growth rates of 200 g/hd/day would require supplementation with a higher quality feed such as grain, pellets or a high quality hay/silage. If the lambs had consumed 1.2 kg of DM per day, they are receiving 9.6 MJ ME/day – a deficit of 7.4 MJ ME per day. Assuming grain had an energy content of 11.5 MJ ME/kg DM, to make up this deficit would require supplementation with 0.64 kg DM grain per day. As part of supplementing the growing lambs diet the overall ration would need to be balanced for the amount of protein in the diet. In this particular case where the available native pastures were low in CP, selected supplements should be higher to lift the overall level of protein in the diet.
Further information and calculations on supplementing growing lambs with grain can be found here. You can also use the ration development calculator in the EverGraze Feedbase Planning and Budgeting Tools to determine potential growth rates from pasture and supplement.
[/expand]
Crunching the numbers
[expand title=” ” swaptitle=” ” tag=”h4″ elwraptag=”div” elwrapclass=”expend-collapse-wrapper”]
A financial analysis of the different treatments has been undertaken with GrassGro – a computer package that models different farm scenarios over time.
The modeled outcomes are in line with the research findings where sale income (driven by weaning weights) are greater in the treatments with higher stocking rates than in the low stocked treatment. Furthermore, the sale income tended to be greater – along with greater gross lamb production, in set stocked treatments than in the rotationally grazed ones (Table 4).
Despite the greater total income, there was no net economic gain associated with higher stocking rates under this scenario – while potential per hectare productivity was higher in the higher stocked treatments, this was followed by increased costs associated with supplementary feeding in periods of low pasture growth as well as higher annual fertiliser costs – listed within pasture costs in Tables 4 and 5.
Table 4. GrassGro economic analysis of three baseline farming systems used at Chiltern EverGraze Proof Site.
| Farm Systems | Low fertility set stock – 3 ewes/ha, | High fertility set stock – 5 ewes/ha | High fertility simple rotation – 5 ewes/ha | |
| Net wool income – main flock | $/ha | 82 | 135 | 134 |
| Net wool income – young stock | $/ha | 0 | 0 | 0 |
| Sale income – sold at foot | $/ha | 0 | 0 | 0 |
| Sale income – young stock | $/ha | 170 | 275 | 253 |
| Sale income – cast-for-age | $/ha | 37 | 61 | 59 |
| TOTAL INCOME | $/ha | 289 | 471 | 446 |
| Animal husbandry | $/ha | 13 | 22 | 22 |
| Shearing costs | $/ha | 18 | 30 | 30 |
| Replacements purchased | $/ha | 95 | 159 | 159 |
| Rams purchased | $/ha | 7 | 11 | 11 |
| Sale costs | $/ha | 27 | 45 | 44 |
| Maintenance supplement | $/ha | 11 | 26 | 34 |
| Production supplement | $/ha | 0 | 0 | 0 |
| Pasture costs | $/ha | 31 | 125 | 125 |
| TOTAL EXPENSES | $/ha | 202 | 418 | 425 |
| GROSS MARGIN | $/ha | 86 | 54 | 22 |
Despite the increased per hectare production, there was insufficient levels of productivity to offset the higher costs associated with the higher fertiliser applications – hence the reduction in gross margins.
To this point, a financial analysis was undertaken that modelled a ‘modified’ high stocking rate scenario over ten years. In this case high fertiliser inputs were maintained for two years, with stocking rates retained at high levels for the remainder of the ten year period. System fertility was gradually reduced over the ten year period to reflect a more maintenance based fertiliser application rate. Under this scenario at high stocking rates the set stocked treatment is again more profitable than the rotationally grazed treatment, but the set stocked, with a modified high stocking rate treatment tends towards greater profitability that the low stocked option (Table 5).
Table 5. GrassGro economic analysis of a hypothetical ‘strategic high input system’ whereby high stocking rates are maintained for a ten year analysis, with high fertiliser inputs for two years, followed by maintenance applications for the remaining eight years.
| Farm Systems | Low fertility set stock – 3 ewes/ha | High fertility, set stock, strategic high inputs, 5 ewes/ha, decreasing fert costs | High fertility, simple rotation, 5 ewes/ha, decreasing fert costs | |
| Net wool income – main flock | $/ha | 82 | 134 | 133 |
| Net wool income – young stock | $/ha | 0 | 0 | 0 |
| Sale income – sold at foot | $/ha | 0 | 0 | 0 |
| Sale income – young stock | $/ha | 170 | 255 | 242 |
| Sale income – cast-for-age | $/ha | 37 | 59 | 57 |
| TOTAL INCOME | $/ha | 289 | 448 | 432 |
| Animal husbandry | $/ha | 13 | 22 | 21 |
| Shearing costs | $/ha | 18 | 30 | 30 |
| Replacements purchased | $/ha | 95 | 158 | 159 |
| Rams purchased | $/ha | 7 | 11 | 11 |
| Sale costs | $/ha | 27 | 44 | 43 |
| Maintenance supplement | $/ha | 11 | 35 | 41 |
| Production supplement | $/ha | 0 | 0 | 0 |
| Pasture costs | $/ha | 31 | 50 | 51 |
| TOTAL EXPENSES | $/ha | 202 | 351 | 356 |
| GROSS MARGIN | $/ha | 86 | 98 | 77 |
What it all means and putting it into practice
Running ewes and lambs on native pastures
[expand title=” ” swaptitle=” ” tag=”h4″ elwraptag=”div” elwrapclass=”expend-collapse-wrapper”]
Conception rates of ewes grazing native pastures can be acceptable for a profitable lamb production system. However, ewe condition score will need to be monitored and, dependent on seasonal conditions, may require supplementation at key times of the year. At these key times, such as pre-joining, joining, lambing and weaning it is advisable to monitor the condition of ewes and supplementary feed to achieve target ewe condition.
Managing ewes to the Lifetimewool guidelines is the most appropriate way to ensure reproductive targets are met.
The growth rates of lambs through to weaning, from ewes grazing native dominant pastures, can be acceptable for the production of store lambs. However, it is unlikely that sufficient numbers of lambs would reach domestic slaughter specifications (such as 18 -20 kg carcass weight, fat score 2-3). As such, lambs from a native pasture system will require a separate finishing system. It is possible to achieve higher lamb growth rates when there is a high proportion of quality annual species (eg. annual ryegrass and clover) in the native pasture. This makes it possible to lamb later and run higher stocking rates such as at Orange EverGraze Proof Site.
[/expand]
Growing lambs beyond weaning
[expand title=” ” swaptitle=” ” tag=”h4″ elwraptag=”div” elwrapclass=”expend-collapse-wrapper”]
Where lambs are retained on native-dominant pastures beyond weaning it is likely that even in the most favourable season, growth rates will decline as pasture quality decreases beyond early spring. Lambs that are retained on native pastures will require significant supplementary feeding, addressing both energy and protein limitations, to reach a domestic slaughter specification.
[/expand]
Running higher stocking rates on native dominant pastures
[expand title=” ” swaptitle=” ” tag=”h4″ elwraptag=”div” elwrapclass=”expend-collapse-wrapper”]
In lower production systems, lifting stocking rates needs to be done with an awareness of the overall system potential. Higher fertiliser inputs need to be balanced to the potential gains in productivity – there needs to be sufficient gains in production to warrant extra costs. In native pastures with minimal legume or fertiliser responsive annual grasses (such as those at Chiltern), returns from capital investments in fertiliser are marginal.
[/expand]
Rotationally grazing native pastures
[expand title=” ” swaptitle=” ” tag=”h4″ elwraptag=”div” elwrapclass=”expend-collapse-wrapper”]
The results at Chiltern did not show a benefit to pasture composition or production as a result of rotational grazing.
The lack of effect on native pasture composition is consistent with other sites and may have been affected by seasonal conditions.
Lower per head production under rotational grazing means that increases in per hectare production need to result from higher pasture utilisation and stocking rates, which has been observed at other sites. At Chiltern, the lack of benefit to pasture utilisation and production is also likely an effect of season and low variability in the landscape. There will be lower benefit from rotational grazing in native pastures stocked at low density and in a uniform landscape.
[/expand]
Acknowledgements
EverGraze is a Future Farm Industries CRC research and delivery partnership. The Chiltern EverGraze Proof Site was led by Dr Meredith Mitchell, supported by a team of scientists and technical officers at the Agriculture Victoria, Rutherglen. An enthusiastic Regional Advisory Group consisting of farmers, consultants, extension officers and Catchment Management Authority staff provided significant input in the direction, management and interpretation of the experiments to make them relevant to farmers.
Authors and contributors
Nick Linden, Agriculture Victoria, Rutherglen
Kate Sargeant, formerly Agriculture Victoria, Benalla
Meredith Mitchell, Agriculture Victoria, Rutherglen
Sorn Norng, Agriculture Victoria
Ashley Paech, Agriculture Victoria, Rutherglen
Laura Garland, Agriculture Victoria, Rutherglen
Further Information
- EverGraze Exchange – The nuts and bolts of grazing strategies
- EverGraze Action – Dividing up the farm for grazing management
- Poster – Identifying native grasses
- AWI FOO Library
- EverGraze Action – Managing native pastures in Victoria
- Chiltern EverGraze research message – Composition and production from native pastures in response to fertiliser and rotational grazing
- Orange EverGraze research message – The effect of grazing intensity on production and profit from native pastures at Orange EverGraze Proof Site
- Holbrook EverGraze research message – Integrating management of native and improved pastures by grazing with a single reproductive flock is more profitable than running ewes and wethers separately
- The Broadford Grazing Experiment
- Briske DD, Derner JD, Brown JR, Fuhlendorf SD, Teague WR, Havstad KM, Gillen RL, Ash AJ and Willms WD (2008) Rotational grazing on rangelands: Reconciliation of perception and experimental evidence. Rangeland Ecology & Management 61, 3-17.
- Garden DL, Ellis NJS, Rab MA, Langford CM, Johnston WH, Shields C, Murphy T, Holmberg M, Dassanayake KB and Harden S (2003) Fertiliser and grazing effects on production and botanical composition of native grasslands in south-eat Australia. Australian Journal of Experimental Agriculture 43, 843-859.
- Graham RP (2006) Bookham grazing demonstration results – conducted at Bruce Hazel’s, Kia Ora, Bookham beginning November 1993. NSW DPI sheep Conference Orange Agricultural Institute, NSW DPI:211-216.
- Michalk DL, Dowling PM, Kemp DR, King W McG, Packer IJ, Holst PJ, Jones RE, Priest SM, Millar GD, Brisbane S and Stanley DF (2003) Sustainable grazing systems for the Central Tablelands, New South Wales. Australian Journal of Experimental Agriculture 43, 861-874.

