MLA Feed Demand Calculator
A tool for improving the balance of feed supply and livestock demand
The MLA Feed Demand Calculator (FDC) is a simple tool to investigate changes to grazing systems that can improve the match between the feed requirements of sheep or beef cattle and forage supply. In its latest version, the FDC has been upgraded to allow easier comparisons of different pastures, to include supplementary feeding and streamline reports. Also, some indicators of the effect of different management options on environmental parameters have been included.
The Feed Demand Calculator allows users to;
- Conduct simple comparisons of the effect of changing management of livestock on feed demand;
- Consider the benefit of using alternative pastures to fill feed gaps;
- Look at the impact of good or poor seasons on feed supply and feed on offer.
Using the Feed Demand Calculator
To use the FDC you need to;
- Specify the farm feed-base (i.e. the area allocated to different pastures and forage crops);
- Describe the livestock enterprise run on the farm i.e. the number and type of animals, numbers and weights of stock purchased and sold, and reproductive management;
- Analyse the performance of the system by comparing the Feed Supply curve to the animal Feed Demand through the year;
- Consider if the system is productively and environmentally sustainable (pasture utilisation and ground cover).
To get the most from the FDC, these steps should be repeated looking at different seasonal conditions and combinations of feed sources and livestock to determine the system that best meets your needs.
| Tip – Documentation within the FDC includes 5 pages detailing “How to use the FDC”. If you are a first time user or have not used the program for some time, print off these pages and read carefully prior to running simulations. |
Step 1. Specify the location and feed-base on the farm
Select the most appropriate location and the date you would like to start the simulation. You then select the pastures for the farm. Either put in your own pasture growth rates and pasture quality, or use default values which are included for some pastures at each location.
The FDC will calculate stock details, pasture supply, and feed demand for 12 months from the start date. For sheep, select a Start Date which allows joining, lambing weaning and sale of cull ewes to occur (in that order) after that date. For cattle, its best to select a start date a few months before calving with weaning and sale of cull cows at the end of the 12 month period. A start date in between lambing and weaning makes stock reconciliation difficult.
|
Tip – Get a simple system working with one type of stock first before entering complex whole farm systems. Make sure the pasture growth rates, stocking rates, lambing times etc gives realistic feed on offer values before trying alternative scenarios. |
For the farm, specify the most common soil type and topography. These values are used later to help determine the environmental sustainability of the grazing system.
Wastage of the pasture during grazing needs to be specified for the farm. Pasture growth is measured when pastures are not grazed and stock waste pasture by trampling and fouling during grazing. For short green pasture during the growing season, wastage of 15-20% of what grows each month is common.
In late spring, summer and autumn when feed on offer is high (2.0 – 5.0 t/ha), wastage is greater due to insect damage, increased fouling and trampling, wind damage and shattering of dry feed and decay. Wastage is greatest on clover dominant pastures (30-40% per month), compared to sown perennial grass-clover pastures 20-30% per month) and lowest on native perennial pastures (10-20% per month). The higher the quality of herbage in the paddock (high legume content, high metabolisable energy (ME) content), the higher the wastage should be selected.
Fodder crops and stubbles can also be included. For these indicate the months and the areas when these will be available. If you expect to have 3000 kg/ha available in December, the easiest way is to indicate growth of 100 kg/ha/day for December (to give 3000 kg/ha by the end of December) and then indicate any additional growth over the following months. For stubbles, a similar approach can be used to generate the expected amount of herbage available for grazing in a particular month. Consider if you wish to include just the green material in the base of the stubble (1-2 t/ha of 11 ME) or all of the straw (2-7 t/ha 5 ME).
Step 2. Specify the type of stock to graze the pasture
On the Pasture Page, you need to select Sheep Only, Cattle Only, or Cattle and Sheep as the grazing animals.
Go to the appropriate Livestock Page (Figure 1) and specify the type of stock for the farm.
Sheep: Specify the genotype, size, mating details, weaning percentage etc for the baseline system. It’s much easier to select a Start Date (on the Pasture Page) that allows mating, lambing and weaning to occur in that order.
Cattle: Specify the genotype, size, mating details, weaning percentage etc for the baseline system. For cattle, take care to ensure that the stock inventory is appropriate as they are commonly maintained on the property for 15-24 months. If calves are weaned but not sold by the end of the 12 month period, then they need to be included as stock on hand at the start of the period.
Selling cast for age cows can cause difficulty. It’s best to have a Start date at a time of year so that all cows and heifers present calves that year and cull cows are sold at the end of the 12 month period.
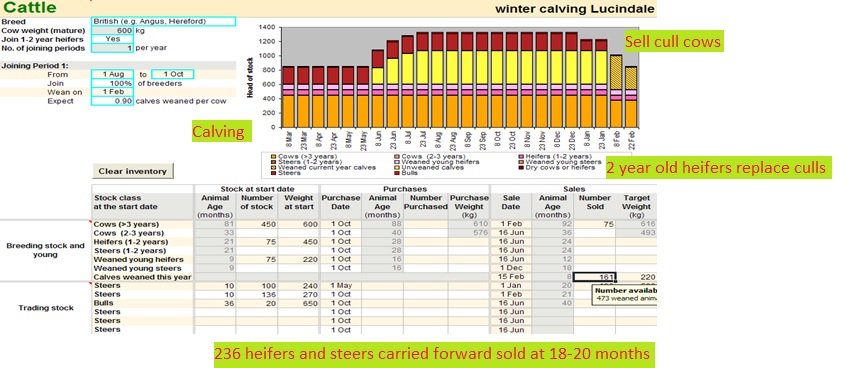
| TIP – Make sure the Number of Stock in the bar graph is correct; it’s easy to double up. |
Step 3: Compare Feed Supply and Feed Demand
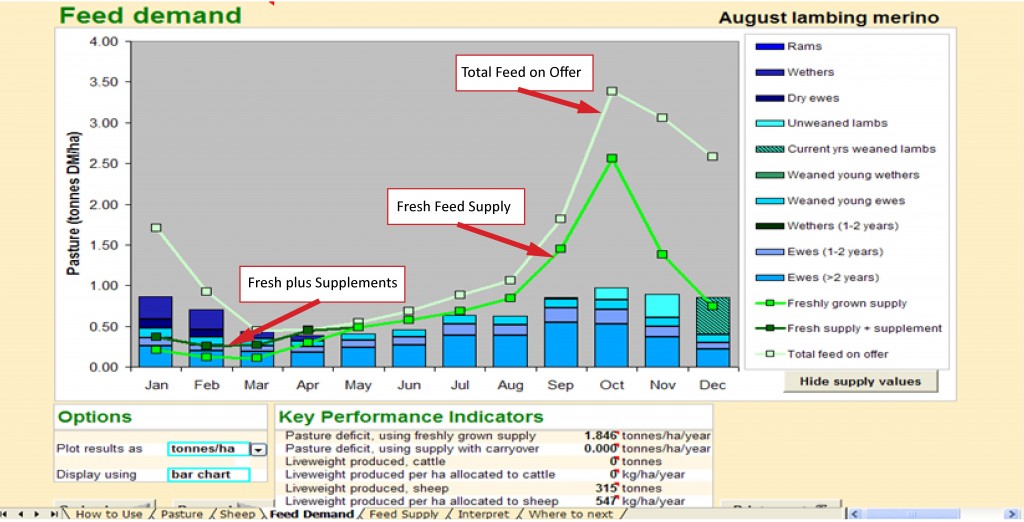
Once you have the pastures and animals specified, have a look at the Feed Supply and Feed Demand graphs. The Feed Demand graph shows the intake of the different classes of livestock compared to the Feed Supply. Feed Supply is shown as both Freshly Grown (in that month) and the Total Feed on Offer (Freshly Grown plus carryover pasture from the previous months).
Feed Demand Graph: Look at whether the overall Feed Demand line matches the fresh Feed Supply. In most scenarios, there will be some months when carryover feed will be required to meet livestock needs. An example of a Feed Supply and Demand is shown in Figure 2. Look at the times when Total Supply and Demand are not in balance. What management actions could be taken in those months to fill the gaps (eg. use of nitrogen or gibberelic acid to boost winter feed).
If the Feed Demand is always less than Feed Supply, it suggests there is potential to increase Feed Demand, either by running more stock, keeping stock longer before sale, or using some land for other enterprises.
If Feed Demand is usually higher than Feed Supply, this suggests the system is not profitable or sustainable, livestock will be performing below their potential and paddocks will be over grazed leading to soil loss.
Feed Supply graph: The Feed Supply graph (Figure 3) shows the same data but with the Feed Demand as one line and Feed Supply split into the different pasture components. The graph indicates when particular pasture species are doing well or performing poorly. Consider what alternative species could be used to overcome feed gaps. Alternatively, if there is a particular season when Feed Demand exceeds Feed Supply, could sale of stock or a change of management (calving time?) overcome this deficiency?
It is a good idea to go back to the pasture page and run the scenario with a scaling setting of 0.7 to simulate a poor year. How much does this change the Feed Demand:Supply curve?
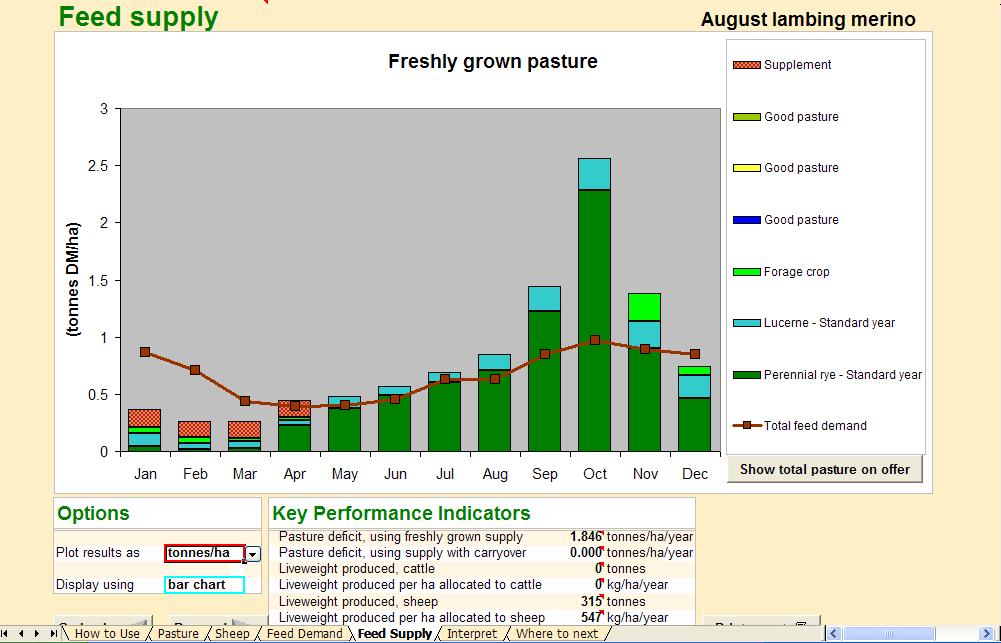
Click on the Show total pasture on offer button to indicate the total pasture available. Fresh supply is a good indicator of high quality herbage for growing or lactating stock while total feed on offer is more relevant to store stock.
Supplementary feeding: The FDC allows the user to include supplementary feeding in the scenarios. To include supplements, go to the Pasture page where provision is made to include the Amount (kg/hectare/day) and Quality (MJ ME/kg) of supplements. An example of how to work out an appropriate value is shown in the box below. Supplements need to be specified as kg per hectare per day to allow the values to be included on the Feed Supply graph in a similar way to fresh pasture growth.
| A farm of 50 ha is running 450 July lambing ewes plus 300 carryover lambs that are sold in April – May. The ewes are supplemented with barley at 0.3 kg/hd/day from January until the autumn rains while lambs graze on stubble and lucerne. Ewes are run at 15 ewes/ha in summer while lambs graze lucerne.Therefore supplement per hectare per day is: 450 ewes * 0.3 kg/d = 135 kg/day, divided by the total area of the farm (50ha) = 2.7 kg/ha/day. |
The Supplement Quality can be determined from feed quality tests or standard values used; barley is commonly about 12 MJ ME/kg.
Key Performance Indicators: The table at the bottom of the Feed Demand and Feed Supply graphs outlines the total production, production/ha and utilisation of pasture. These values can be used to compare the performance of different scenarios and with regional farm benchmarks.
Step 4: Consider the environmental implications of the scenario
The Performance Indicators include Utilisation of the pasture that can also be used as an indicator of environmental sustainability. Rule of thumb maximum pasture utilisation rates for different situations are shown in Table 1. Utilisation must be lower on steeper country and with sandy soils to ensure sufficient ground cover is maintained to avoid soil loss.
Table 1. Maximum utilisation rates that balance productivity and environmental sustainability
| Flat | Undulating | Steep | |
| Clay | 70 | 65 | 50 |
| Clay loam | 65 | 60 | 50 |
| Sandy loam | 60 | 55 | 45 |
| Sand | 50 | 45 | 40 |
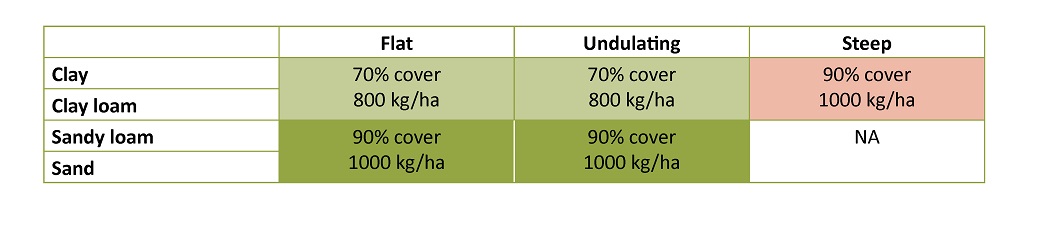
Another measure of sustainability is the minimum Total feed on offer (FOO). Rule of thumb minimum levels shown in Table 2. If pastures are grazed below these minimum FOO targets for several months especially at times when heavy rainfall or strong winds are likely, soil erosion is likely to occur. Also, extended periods of grazing below these minimum levels will lead to loss of perennial pasture species.
Table 2. Recommended minimum feed on offer (FOO) and ground cover for different soils and topography
If the minimum FOO or maximum Utilisation values are exceeded, a flag will appear at the bottom of the Key Performance Indicator table suggesting that the feed supply or demand needs to be reconsidered.
Common comparisons with the FDC
Changing lambing or calving time
Lambing time has a large influence on the Feed Supply, Feed Demand balance as well as sale weight, sale prices and weaning rates. Steps to compare autumn with winter lambing are shown below and can be adapted to a cow/calf operation or other lambing times are shown below.
- Select the appropriate location and customize the pasture growth and quality for the farm.
- Setup the baseline autumn lambing system, ewe stocking rate, weaning time and rate and sale time. Specify the current supplementary feeding on the pasture page
- Run the system and print off the Feed Demand and Feed Supply graphs
- Using the same pasture growth data, change the lambing time from say April to June. Note that conception rates and lamb growth rates should be higher for later lambing and will need to be included in the animal specifications.
- Compare the Feed Demand and Supply with the baseline simulation. Questions to consider are as follows:
- Can supplementary feeding be reduced with later lambing?
- Can stocking rates be increased with later lambing?
- Will the benefits of additional lambs and lower supplementary feeding be greater than any reduction in price per lamb?
- Will later lambing avoid environmental limitations by maintaining higher ground cover?
Comparing different animal genotypes
The FDC allows a quick comparison of the effect of changing to a different type of sheep or cattle (larger frame size, higher reproductive performance) on feed demand. Steps for running this comparison are provided below.
- Select the appropriate location and customise the pasture growth and quality for the farm.
- Setup the current animal genotype, stocking rate, weaning percentage, weaning weights etc.
- Run the system and print off the Feed Demand and Supply graphs.
- Change the animal characteristics to reflect the new genotype. Remember that a different animal genotype may mean changing the weight of the breeding animal, weaning percentage and weaning weights. Compare the Feed Demand and Feed Supply with the baseline simulation. Questions to consider are as follows:
- Do I need to change stocking rates to accommodate the change in genotype?
- What is the tradeoff between production/ha in the different scenarios?
Using alternative species to overcome feed-gaps
Fresh feed supply may be low in summer, autumn or winter and limit stocking rates or the type of enterprises that can be run. The FDC can consider alternative species to fill gaps in supply. Steps for running this comparison are provided below.
- Select the appropriate location and customize the pasture growth and quality for the current situation.,
- Setup the baseline animal system, stocking rate, weaning percentage, weaning weights etc,
- Run the system and print off the Feed Demand and Supply Graphs. Look for where the greatest difference occurs between Supply and Demand especially periods when stock are lactating or required to grow rapidly. Consider what other species could fill these gaps, ie lucerne late spring and summer, summer forage crops in summer and autumn, cereal crops in winter.
- Seek local information about the likely growth rates of alternative species and crops from local state agencies experts, private consultants or agronomists,
- Modify the feed supply by including a proportion of the farm with a different pasture and enter the appropriate growth and quality values.
- Compare the balance between Feed Supply:Feed Demand with the alternative species to the baseline comparisons. Questions to consider are as follows:
- Does the new species improve the overall Feed Supply:Feed Demand balance?
- Do I need to modify livestock management to make best use of the alternative species? ie can I run a higher stocking rate, turnoff stock at a different time, sell stock at heavier weights?
- Can I reduce supplementary feeding by using other species?
- Does the use of an alternative species overcome previous environmental limitations?
Planning for adverse seasons
The FDC has a simple function that allows users to dial up higher or lower pasture growth. This is particularly useful to budget for a tough autumn or overall poor year. To test these options;
- Select the appropriate location and customize the pasture growth and quality for the baseline situation. Make sure that the Scaling factor on the pasture page is set to 1.0 for the baseline situation.
- Setup the current animal system, stocking rate, weaning percentage, weaning weights etc. Run the system and print off the Feed Demand and Feed Supply Graphs.
- Alter the Scaling Factor for pasture growth to 0.7 (30% lower growth). This will reduce the pasture growth in all months for that pasture species by 30%.
- Run the simulation and compare Feed Supply and Feed Demand with the baseline situation. Consider;
- How much additional supplementary feeding will be required?
- If I bring forward sale of trading stock, could I overcome the Feed Supply gap?
- How many of my breeding stock would need to be sold to balance Supply and Demand?
- What is the impact of the lower Feed Supply on environmental values?
As you become more familiar with the FDC, you will be able to build up combinations of pasture and livestock options in varying seasons.
Disclaimer; While every attempt has been made to ensure the accuracy of the data and predictions in the FDC and this publication, MLA, CSIRO, DMJ Livestock Consultants and PSA Services cannot accept responsibility for the accuracy or completeness of the information or opinions expressed herein. You should make enquiries with local qualified agronomists or advisors before implementing changes tested in the FDC on your property.
The Feed Demand Calculator was developed by CSIRO and MLA.
