South West Victoria (Lower) – Climate
Rainfall
Geographical distribution
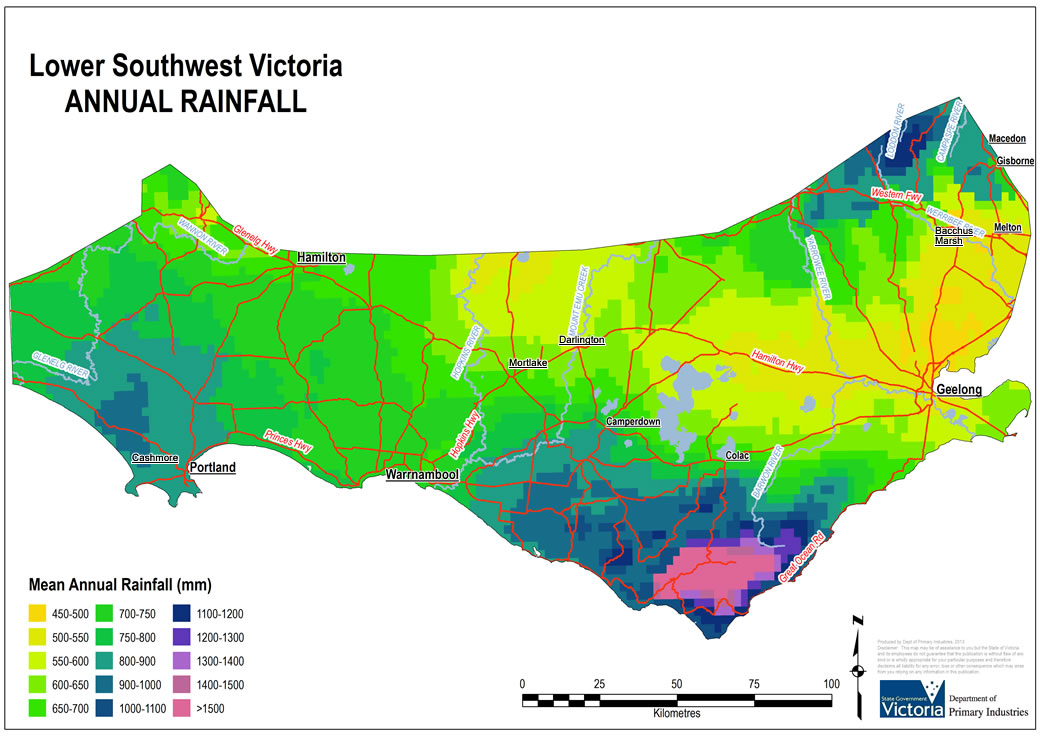
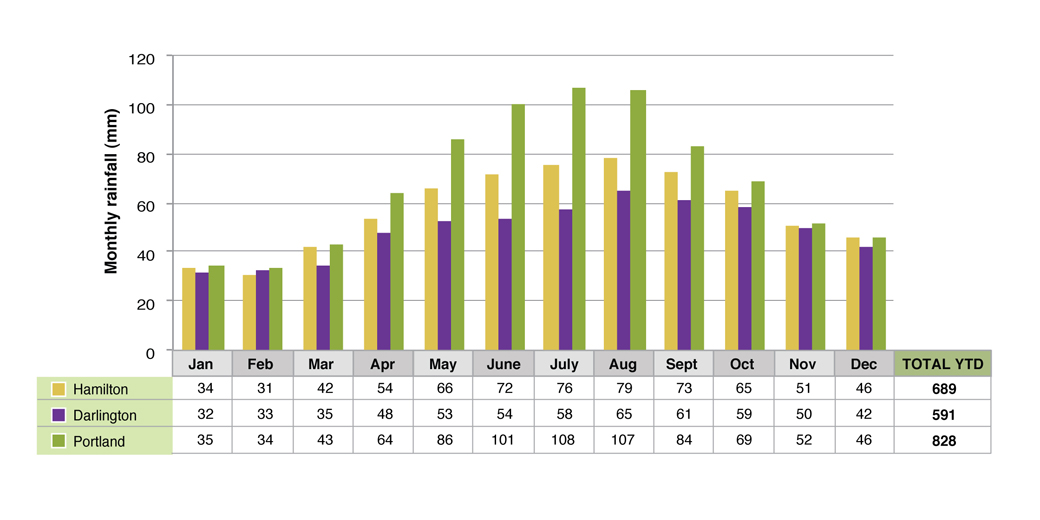
Compared to most other parts of Australia, South West Victoria has a reliable climate. Figures 1 and 2 provide a geographical representation of average annual rainfall and seasonal distribution. Average annual rainfall in Hamilton is 689 mm, is winter dominant, and the growing season is eight to nine months. Rainfall in the region increases towards the coast, with Portland averaging 828mm. The longer and more reliable growing season in this area makes it suitable for dairy production. Along the Hamilton Highway from Mortlake and Darlington to Geelong and north to Bacchus Marsh receives less rainfall, especially through the winter months, with average annual rainfall for Darlington at 591mm. This is due to rain shadow effects from the north, west and south directions of the Grampians, Otway, Great Divide and Strzelecki Ranges. Pasture varieties and livestock systems for these parts of the region are more aligned to the Upper South West.
Seasonal variability
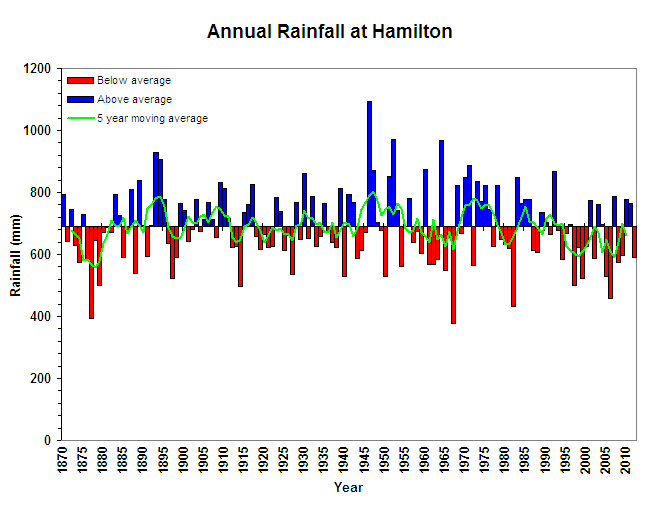
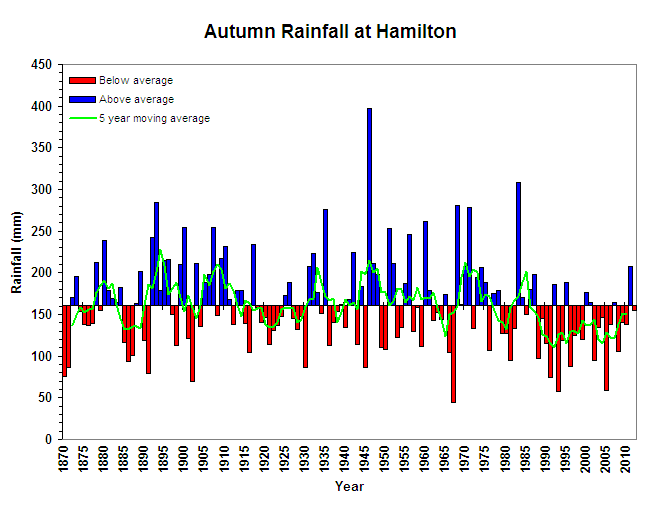
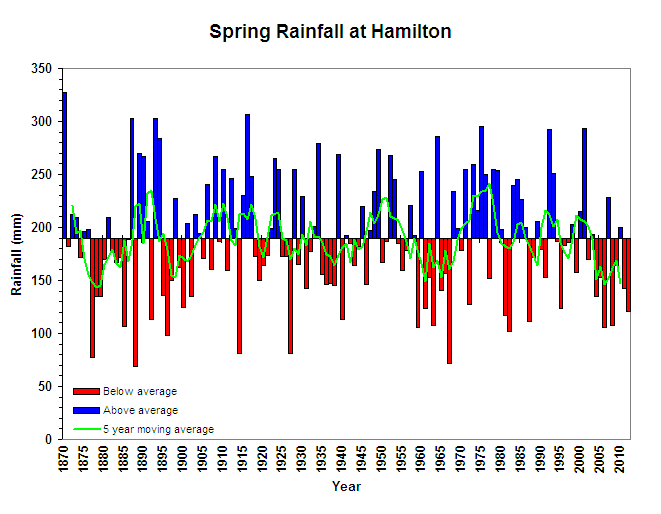
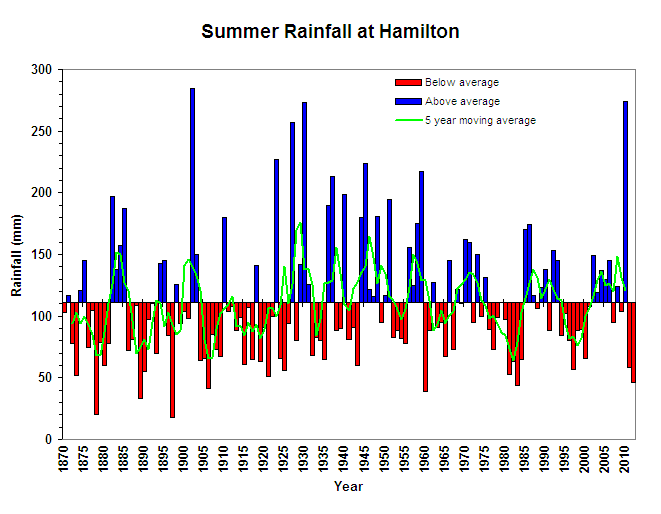
Although the annual rainfall for Hamilton is quite stable (owing to fairly reliable winter rains), variation within the seasons is common (Figure 3). The region has received many years of below average autumn rainfall in the past 10-20 years. This has often combined with years of poorer springs as well. This trend combined with several spikes in summer rainfall has made conditions ideal for taking advantage of summer-responsive perennials. Reasons for this drying are complex and an active research area for scientists. The Autumn drying is partly due to the more positive Southern Annular Mode over this period, dragging some frontal rainfall triggers further south. Both autumn and spring rainfall declines are also being affected by the higher air pressure as a result of the strengthening of the Sub Tropical Ridge. This is blocking some frontal and low pressure rainfall triggers. Research shows there is a high likelihood for some permanence to these changes.
A full set of seasonal rainfall variability graphs is provided for Hamilton, Darlington and Portland here.
Figure 3. Annual, autumn, spring and summer rainfall variation at Hamilton (1870-2010). Click on the image to enlarge in a new window/tab. Close the window/tab to return to this page.
Temperature
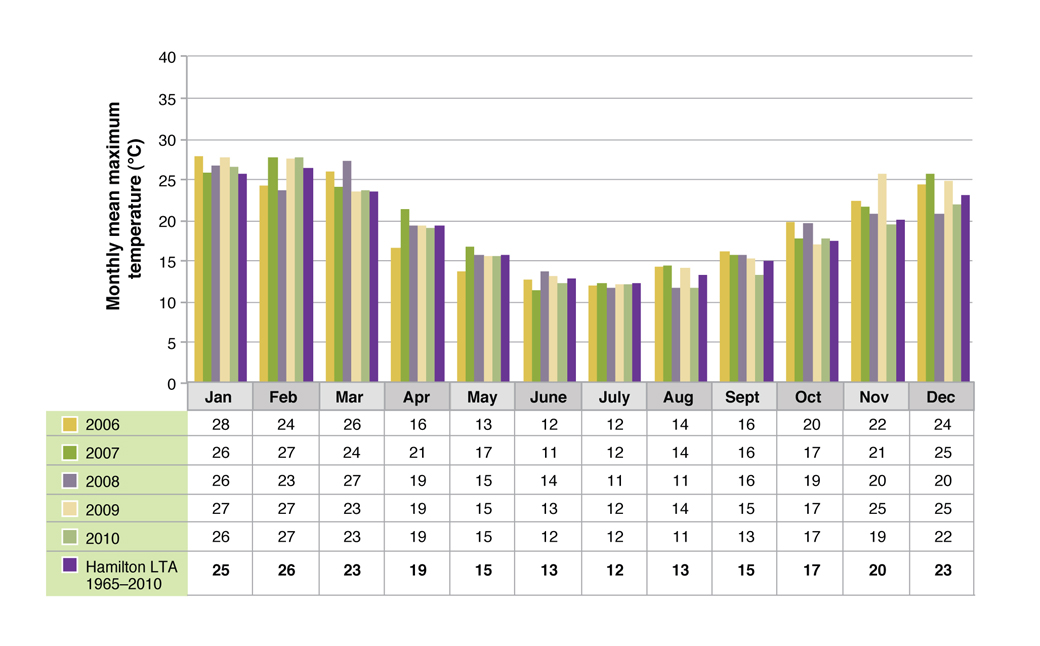
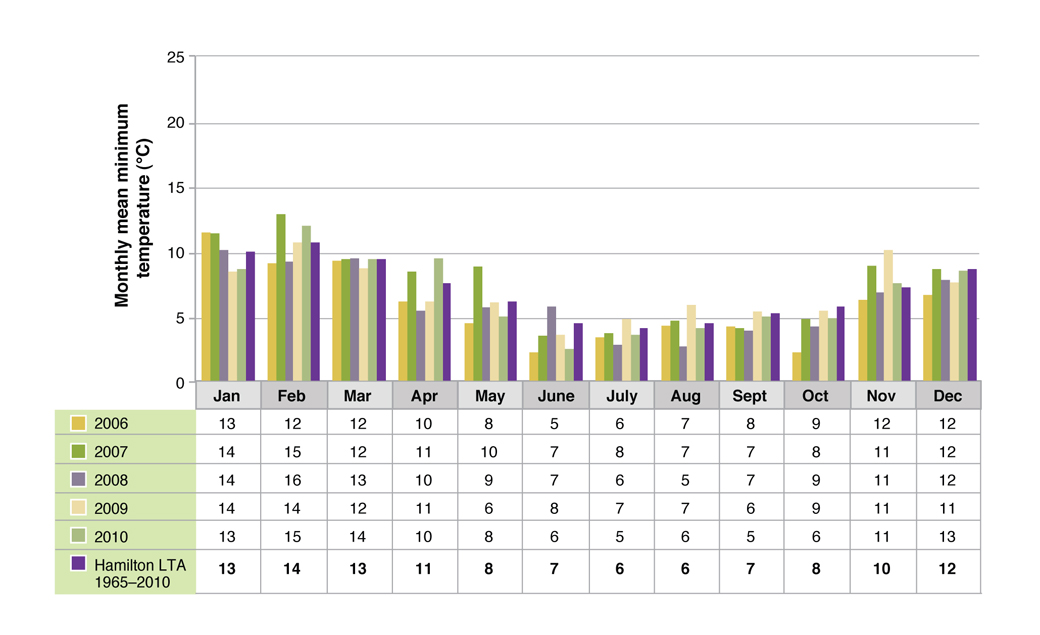
Monthly average temperatures for the Hamilton EverGraze Proof Site, together with the long term (1965-2010) average for Hamilton are presented in Figure 4. In general, summer temperatures in the Lower South West are relatively mild compared to areas further north in Victoria and NSW. This makes the region suitable for perennial ryegrass, even though rainfall is similar or less than areas where this species will not persist such as in North East Victoria and the Upper South West region which experience hotter summers (average January temperatures of 31oC at Rutherglen compared to 25oC at Hamilton but with similar annual average annual rainfall). Minimum temperatures are similar to or slightly warmer than areas further north, but cold south west outbreaks and stronger winds combined with rain make lamb mortality a high risk throughout winter and early spring period.
Figure 4. Average monthly minimum and maximum temperatures at Hamilton EverGraze Proof Site. Click on the image to enlarge in a new window/tab. Close the window/tab to return to this page.
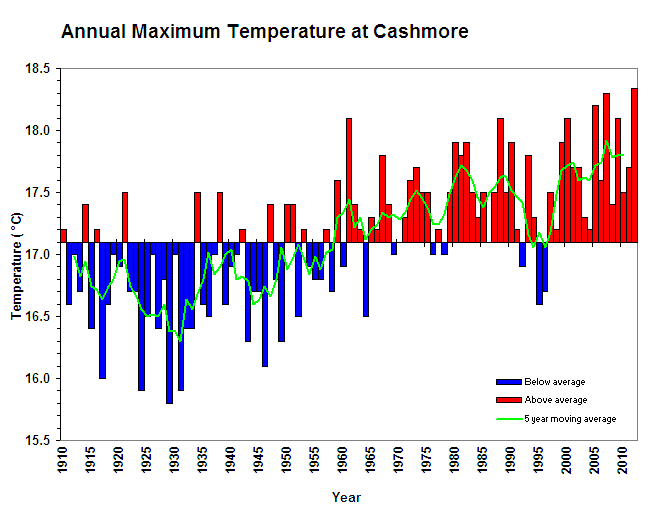
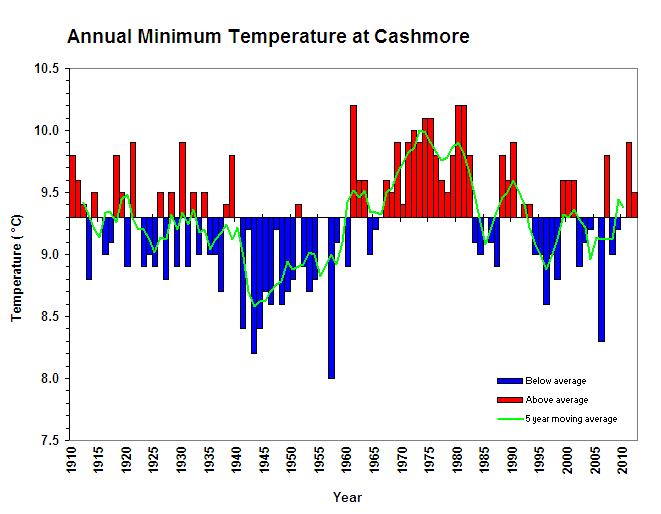
The variability in annual maximum and minimum temperatures for Cashmore (near Portland) are presented in Figure 5. In general, average maximum temperatures have been above average since 1970. For reasons not understood and unlike all other Victorian sites, Cashmore shows no recent upward trend in the average minimum temperatures.
Figure 5. Annual maximum and minimum temperatures for Cashmore (1910-2010). Click on the image to enlarge in a new window/tab. Close the window/tab to return to this page.

