The Hamilton Long Term Phosphate Experiment
Phosphorus fertiliser applications increased sheep production and Gross Margins
Summary
Application of phosphorus fertiliser to responsive soils and pastures led to;
- Higher pasture growth and a greater proportion of more desirable species.
- Higher nutritive values of the forage available to stock.
- Improved persistence of sown legumes and perennials.
This improved feedbase led to;
- Increased stocking rates while maintaining or improving stock condition.
- Higher reproductive performance.
- Improved growth rates in growing stock.
- Reduced mortality in breeding animals and lambs.
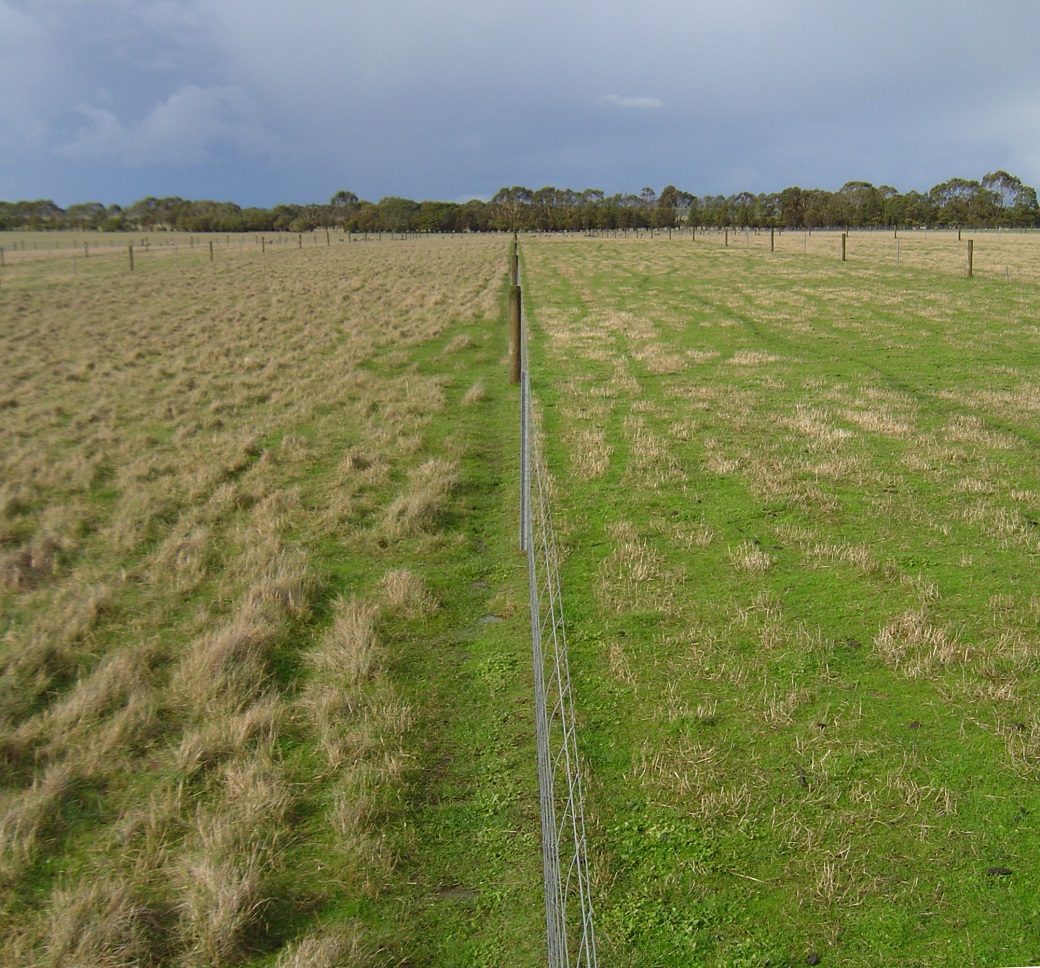
At the Hamilton Long Term Phosphate Experiment, species composition, pasture production and quality peaked at a phosphorus input rate of around 15 kg/ha (170 kg/ha single superphosphate), Olsen phosphorus level of 11 mg/kg and stocking rate 18-20 ewes/ha. The combined effects of the improved feedbase and higher stocking rates allowed significant increases in gross margins per head and per hectare. The comparative gross margins between low and high fertiliser input treatments were not affected by higher commodity prices, higher phosphorus fertiliser prices or higher reproductive performance rates.
Read more about this research
Background
Phosphorus (P) fertiliser is commonly applied across Australia to overcome chronic P deficiencies in many agricultural soils. Cutting experiments were commonly used from the 1940’s to determine the increase in pasture production in response to different phosphorus (P) fertiliser rates. However, in the last 20 years, it has become apparent that P fertiliser changes many other aspects of pastures other than growth and these can change animal performance. A particular challenge with P fertiliser responses is that changes to pasture composition may not become apparent in short-term cutting experiments.
What was done – the Long Term Phosphate Experiment
Since 1977, an experiment at the Agriculture Victoria research farm near Hamilton in south west Victoria has compared the effect of different P fertiliser input rates on pasture and animal production. The paddock started with low soil fertility (Olsen P of 4 mg/kg) and was sown to perennial ryegrass, phalaris and sub clover. Soil in South West Victoria is basalt clay-loam, typically acidic and with an average rainfall of 700 mm is commonly waterlogged in winter. A virtual tour of the Long Term Phosphate Experiment is provided at the Victorian Resources Online.
Fertiliser rates
Average amounts of fertiliser applied per year over the 35 year period have been 1, 4, 8, 15, 23, and 33 kg P/ha corresponding to 11, 45, 90, 170, 260 and 375 kg/ha single superphosphate annually. The 1kg P/ha paddocks have only had fertiliser applied twice in the last 20 years. Superphosphate has always been used so sulphur and calcium have also been applied.
Pastures
In 1988, all paddocks were sod seeded with Trikala and Larisa subterranean clovers. Potassium, molybdenum and copper have been applied across all paddocks on several occasions. Apart from spraying to control cockchafer grubs in some paddocks in some years and controlling thistles in some paddocks, no attempt has been made to manipulate pasture composition with herbicides or grazing. All paddocks were continuously stocked.
Stocking rates and animal management
For each fertiliser level, three different stocking rates were compared – Low, Medium and High. The actual stocking rate (ewes/ha) varied with P rate (1 kg P/ha: 5.5, 7.7, 10; 33 kg P/ha: 12.3, 17.3, 22.3 ewes/ha) as it is clearly not possible to carry the same number of ewes/ha at all P rates.
The results discussed on this page relate to a six year period when the experiment was grazed by spring lambing Merino ewes. Ewes lambed in September, lambs were weaned and removed from the paddocks in December. Worm control consisted of two effective summer drenches and monitoring faecal egg levels in autumn to determine further drench requirements. Ewes were supplemented with hay or grain if their average condition score fell below 2.3.
What was found
Higher pasture production
As expected, higher rates of P fertiliser lead to increased pasture production as shown in Table 1. Pasture production peaked at 12 t/ha/year at Olsen P 11 mg/kg and fertiliser input of 15 kg/ha. Regardless of P rate, winter production was about 25% of total production.
Table 1. The effect of P fertiliser on soil fertility and pasture production
| Soil tests and pasture production | ||||||
| Fertiliser treatment – kg P/ha | 1 | 4 | 8 | 15 | 23 | 33 |
| Colwell P – mg/kg | 6 | 8 | 14 | 26 | 45 | 129 |
| Olsen P – (mg/kg) | 6 | 6 | 7 | 11 | 19 | 30 |
| Winter pasture production (t/ha) | 1.6 | 1.5 | 2.1 | 2.8 | 3.0 | 3.1 |
| Annual pasture production (t/ha) | 6.0 | 6.7 | 9.2 | 12.4 | 12.7 | 12.6 |
Improved pasture composition
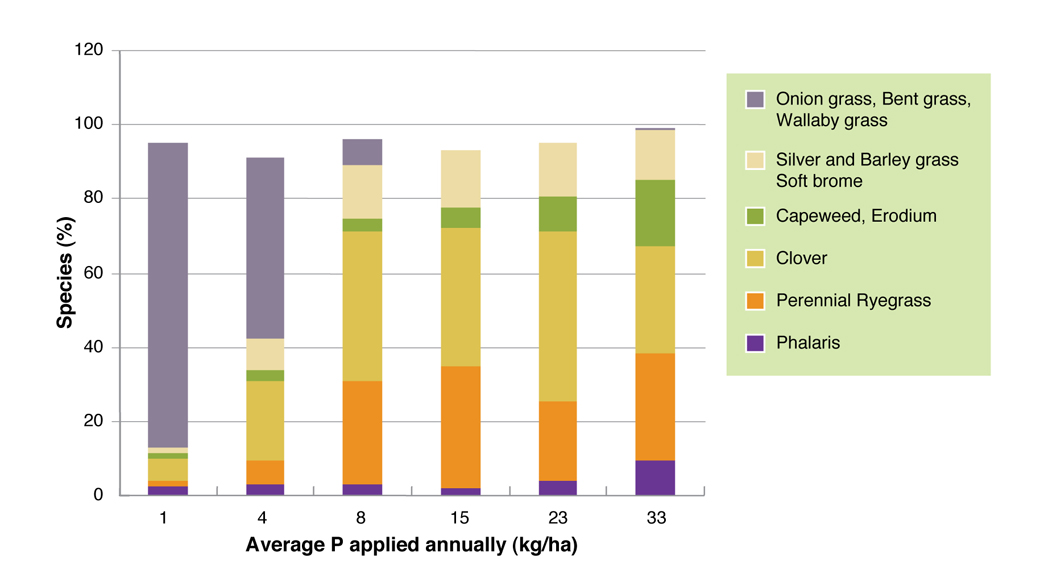
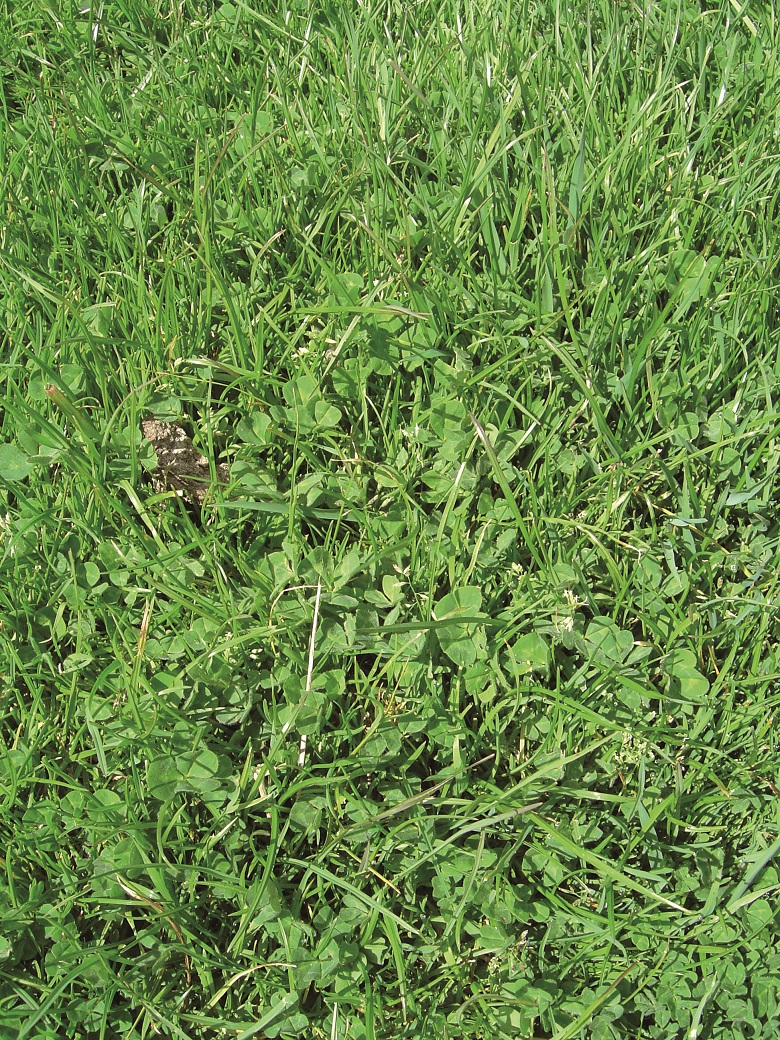
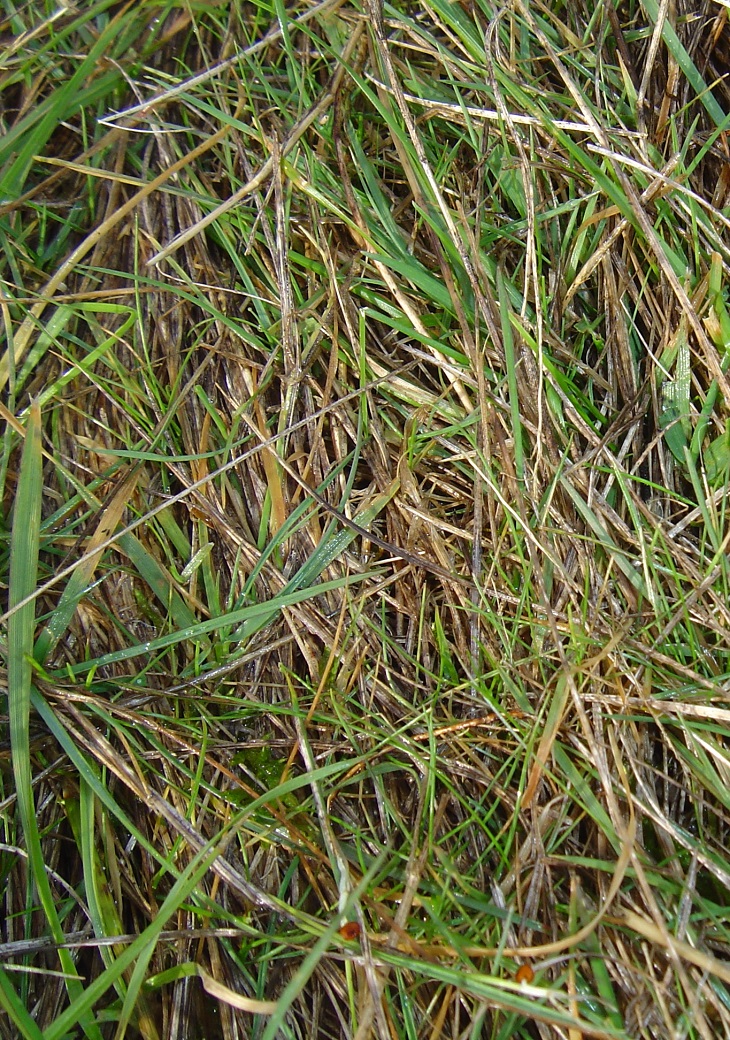
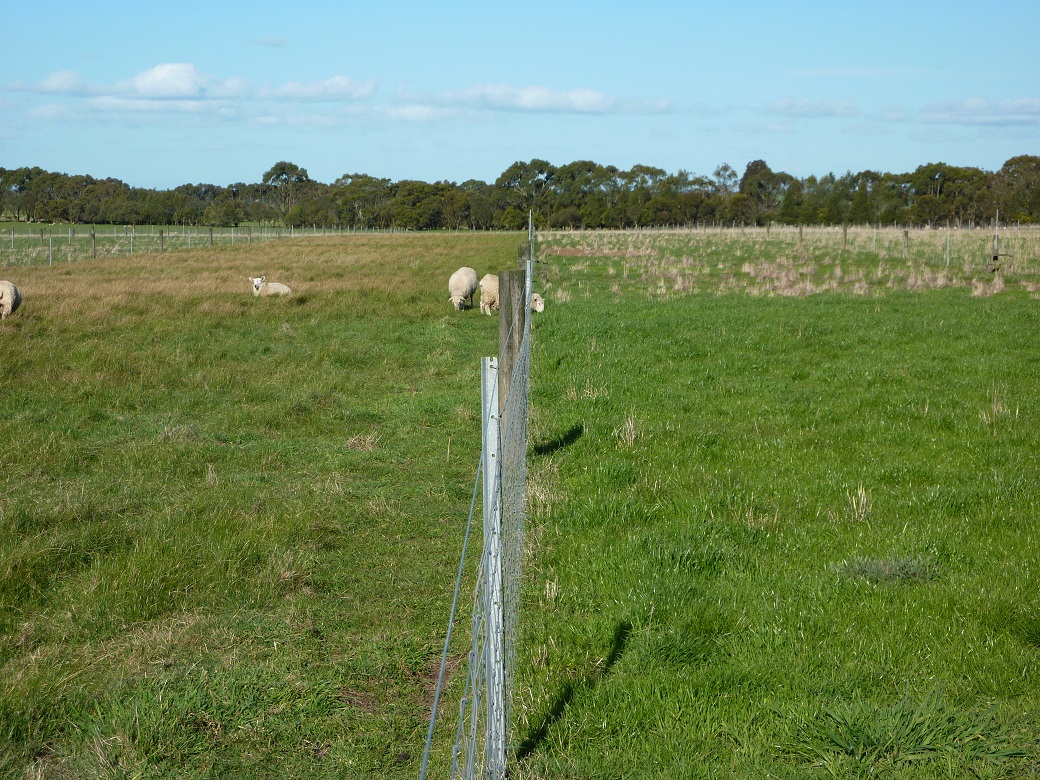
Higher fertiliser rates dramatically changed pasture composition as shown in Figure 1. Where little or no fertiliser was applied, sown species made up less than 30% of the forage in spring. Where more than 8 kg/ha P was applied, sown species made up about 70% of the forage with increased amounts of broadleaf weeds at the highest P rates.
Higher nutritive value
The other important change in the pastures was higher nutritive value of individual species. For this comparison, herbage was cut from each treatment in spring, hand sorted into green and dead herbage for each species and then analysed for protein and digestibility. Nutritive values for some key species are shown in Table 2. Highest nutritive value occurred when about 15 kg P/ha was applied.
Table 2. The effect of P fertiliser on the nutritive value of pasture species
| Herbage nutritive value | ||||||
| Fertiliser treatment – kg P/ha | 1 | 4 | 8 | 15 | 23 | 33 |
| Subterranean clover protein (%) | 18 | 20 | 21 | 24 | 25 | 26 |
| Subterranean clover digestibility (%) | 63 | 69 | 71 | 72 | 72 | 72 |
| Perennial ryegrass digestibility (%) | 76 | 80 | 81 | 80 | 80 | 80 |
| Barley grass digestibility (%) | 70 | 71 | 73 | 74 | 75 | 76 |
Improved animal production
The effects of the different P rates and different stocking rates are shown in Table 3. Important points include:
- Wool cut/head increased with higher P rates despite doubling stocking rates.
- Ewes at higher P rates gained more weight through the year despite running at much higher rates.
- More supplementary feeding was required at low P rates.
- Lamb weaning weights were higher at higher P rates.
These results show the combined effect of improved pasture production, composition, nutritive value and persistence on animal production. Based solely on increased pasture production, doubling sheep production would be expected (6 t/ha vs 12.5 t/ha). In practice, sheep productivity increased 3-4 fold (6 ewes/ha to 18 ewes/ha) with ewes grazing at higher stocking rates in higher P treatments maintaining or increasing production per head.
Table 3. Effects of P rate and stocking rate on sheep production
| P Fertiliser Rate (kg P/Ha/Yr) | 1 | 4 | 8 | 15 | 23 | 33 |
| Low Stocking Rate (ewes/ha) | 5.5 | 6.6 | 8.8 | 10 | 11.3 | 12.3 |
| Wool Cut (kg/hd) | 4.0 | 4.5 | 4.7 | 4.7 | 4.7 | 4.9 |
| Micron | 19.9 | 21.2 | 21.2 | 21 | 21.3 | 21.4 |
| Lamb weaning weight (kg LW/hd) | 18.6 | 20.3 | 21.5 | 22.6 | 21.8 | 21.6 |
| Supplements fed (MJ ME/ewe) | 81 | 45 | 0 | 0 | 0 | 0 |
| Ewe weight change over 12 mths (kg/hd) | 1.7 | 3.3 | 4.4 | 6.2 | 4.7 | 4.9 |
| Medium Stocking Rate (ewes/ha) | 7.7 | 9.2 | 12.3 | 14 | 15.8 | 17.3 |
| Wool Cut (kg/hd) | 3.7 | 4.3 | 4.6 | 4.6 | 4.5 | 4.7 |
| Micron | 19.1 | 20.2 | 21.1 | 21.1 | 20.7 | 21.3 |
| Lamb weaning weight (kg LW/hd) | 16.2 | 19.9 | 20.7 | 20.6 | 20.8 | 21.1 |
| Supplements fed (MJ ME/ewe) | 267 | 43 | 28 | 44 | 38 | 75 |
| Ewe weight change over 12 mths (kg/hd) | 0.4 | 1.8 | 3.4 | 2.7 | 3.5 | 5.6 |
| High Stocking Rate (ewes/ha) | 9.8 | 11.8 | 15.8 | 18 | 20.3 | 22.2 |
| Wool Cut (kg/hd) | 3.8 | 3.7 | 4.2 | 4.2 | 4.3 | 4.4 |
| Micron | 20.1 | 20.5 | 20.3 | 20.3 | 20.5 | 20.3 |
| Lamb weaning weight (kg LW/hd) | 16.4 | 17.4 | 18.4 | 20.7 | 21.7 | 20.8 |
| Supplements fed (MJ ME/ewe) | 333 | 232 | 189 | 119 | 114 | 315 |
| Ewe weight change over 12 mths (kg/hd) | -0.1 | -0.8 | -1.7 | 1.5 | 2.8 | 1.0 |
Crunching the numbers
Baseline comparisons
There is no point applying more fertiliser unless it is profitable. A detailed analysis was recently undertaken (Table 5) using the ewe production data (Table 3) and price and cost assumptions shown below (Table 4). As the experimental flocks were too small to provide accurate data on reproduction and mortality, these impacts were calculated from other studies. Important assumptions were as follows:
Table 4. Assumptions of price and cost applied to analysis
| Assumption | |
| Fertiliser costs | Single superphosphate; $410/t spread |
| Wool | 20 micron wool; $9.31/kg greasy, based on 5 year average prices 2007-12 |
| Ewe prices | Ewe cast for age value; $50/head, + $1/kg for ewes that gained or lost weight compared to median values. |
| Lamb prices | $50 for 21-22 kg liveweight lambs, -$1/kg for lighter lambs |
| Supplementary feed | 2.3 c/MJ ME (Approx $275/tonne grain) |
| Interest on capital investment in additional ewes | 5% |
| *Animal health | $5.24/ewe |
| *Contract labour | $9.11/ewe |
| *Livestock and wool selling costs | 5.5% |
| *Other enterprise costs | $1.37/ewe |
| *Other pasture costs | $1.20/ewe |
| Weaning rate | Base level 85% for ewes that gained 3-4 kg/head/year. Weaning rate decreased from this base rate if ewes gained less than 3-4 kg and for high stocking rate treatments. |
| Ewe mortality | 1% if ewes gained >3 kg/year and 2% if ewes gained <3 kg/year |
*Cost figures taken from Livestock Farm Monitor Project 2012
Based on these assumptions, weaning rate varied from 85-90% for low and medium stocking rate/high P rate treatments down to 67-72% for high stocking rate/low P treatments. Lamb price varied from $50/head with low and medium stocking rate/high P rate treatments to $45/head for medium and high stocking rate/low P rate treatments.
Table 5. Effect of different fertiliser and stocking rates on Gross Margins with baseline assumptions
| Gross Margin $/ewe | ||||||
| Fertiliser rate (kg P/ha/year) | 1 | 4 | 8 | 15 | 23 | 33 |
| Low Stocking Rate | $42 | $47 | $51 | $51 | $45 | $44 |
| Medium Stocking Rate | $33 | $43 | $43 | $39 | $40 | $39 |
| High Stocking Rate | $25 | $23 | $29 | $36 | $37 | $30 |
| Gross Margin $/ha | ||||||
| Low Stocking Rate | $229 | $312 | $445 | $513 | $508 | $537 |
| Medium Stocking Rate | $251 | $394 | $525 | $546 | $633 | $667 |
| High Stocking Rate | $243 | $277 | $453 | $650 | $744 | $655 |
The most profitable stocking rate/fertiliser rate combination was 18-20 ewes/ha where 15-23 kg P/ha was applied. Despite much higher fertiliser costs, ewes on the higher P treatments had higher gross margin per head compared to those on the low P treatments.
It is important to match stocking rate and fertiliser use. There is limited value applying more P unless additional stock are grazed to utilise the increased quantity of higher quality pasture.
Higher fertiliser costs
What if fertiliser prices double? Results in Table 6 show the same production data (Table 3) but with fertiliser valued at $820/t. The most profitable treatments were similar to that when fertiliser was $410/t ie. P applications of 15-23 kg P/ha and 16-20 ewes/ha. However, the penalty for applying high P rates and running low stocking rates was greater than when current prices were used. Despite doubling fertiliser prices, the Gross Margin for treatments with 8-15 kg P/ha was twice that achieved when no fertiliser was applied.
Table 6. Effect of higher fertiliser price ($820/t) on Gross Margins of Merino ewe systems
| Gross Margin $/ewe | ||||||
| Fertiliser rate (kg P/ha/year) | 1 | 4 | 8 | 15 | 23 | 33 |
| Low Stocking Rate | $41 | $44 | $45 | $43 | $33 | $28 |
| Medium Stocking Rate | $32 | $40 | $39 | $33 | $31 | $28 |
| High Stocking Rate | $24 | $22 | $26 | $31 | $30 | $21 |
| Gross Margin $/ha | ||||||
| Low Stocking Rate | $223 | $289 | $398 | $426 | $375 | $345 |
| Medium Stocking Rate | $245 | $371 | $479 | $459 | $499 | $476 |
| High Stocking Rate | $237 | $254 | $407 | $563 | $611 | $463 |
Higher prices for wool and meat
The effects of a 50% increase in the price for wool, lamb and cast for age ewes is shown in Table 7. As part of this scenario, the cost of additional ewes was also 50% greater than in the baseline comparisons.
Table 7. Effect of higher commodity prices on Gross Margins at different P and stocking rates
| Gross Margin $/ewe | ||||||
| Fertiliser rate (kg P/ha/year) | 1 | 4 | 8 | 15 | 23 | 33 |
| Low Stocking Rate | $75 | $82 | $86 | $88 | $81 | $80 |
| Medium Stocking Rate | $66 | $76 | $74 | $70 | $73 | $71 |
| High Stocking Rate | $54 | $50 | $58 | $67 | $68 | $61 |
| Gross Margin $/ha | ||||||
| Low Stocking Rate | $410 | $542 | $761 | $883 | $912 | $986 |
| Medium Stocking Rate | $507 | $697 | $913 | $980 | $1,147 | $1,224 |
| High Stocking Rate | $529 | $594 | $910 | $1,203 | $1,375 | $1,346 |
When commodity prices are high, there is a greater benefit from applying more fertiliser and operating at a higher stocking rate. In this scenario, the highest gross margins occurred when 23 kg P/ha was applied and stocking rates were 20 ewes/ha.
If prices for wool and meat were assumed to be 25% below average values, the optimum treatments were 15-23 kg P/ha with stocking rates of 18-20 ewes/ha, similar to the optimum for the baseline comparisons.
Higher reproductive performance
Table 8 shows the impact of increasing the baseline reproductive rate from 85% to 95% weaning. Under this scenario, the range in weaning rate was 77% (low P, high stocking rate) to 98% (high P, medium stocking rate). Gross margins were about $100/ha higher than in the baseline comparisons but peaked with about 18 kg P/ha and 18-20 ewes/ha.
Table 8. Effect of higher reproductive rates on Gross Margins at different P and stocking rates.
| Gross Margin $/ewe | ||||||
| Fertiliser rate (kg P/ha/year) | 1 | 4 | 8 | 15 | 23 | 33 |
| Low Stocking Rate | $46 | $52 | $55 | $56 | $50 | $48 |
| Medium Stocking Rate | $36 | $47 | $47 | $44 | $45 | $43 |
| High Stocking Rate | $29 | $27 | $33 | $41 | $41 | $34 |
| Gross Margin $/ha | ||||||
| Low Stocking Rate | $252 | $343 | $486 | $562 | $562 | $595 |
| Medium Stocking Rate | $279 | $435 | $583 | $611 | $707 | $749 |
| High Stocking Rate | $280 | $324 | $520 | $734 | $840 | $759 |
Putting the research into practice – deciding on phosphorus input requirements
Fertiliser input requirements are dependent on a range of factors. The Meat and Livestock Australia Five Easy Steps Phosphorus Guide and Tool provide a process and calculator for determining appropriate phosphorus fertiliser inputs. A summary of the most important considerations are listed below.
| Factor | Description |
| Current and desirable soil test reading | The first step is to take a soil test. The soil test will indicate the current available phosphorus levels as well as phosphorus buffering index and soil type, which are needed to determine appropriate fertiliser input levels (see below). If current levels are adequate, only maintenance rates will be needed. If available phosphorus is less than adequate, capital rates will be required in addition to maintenance. |
| Current and potential/desired stocking rate | Higher stocking rates require higher phosphorus fertiliser rates to replace what is removed from product and nutrient transfer from camping behaviour. Stocking rates can be used as a multiplying factor for determining maintenance fertiliser requirements. For example, a set-stocked, clay-loam soil on easy hills with rainfall 600 mm/year rainfall requires 1kg P/DSE/ha/year for maintenance. Capital rates of fertiliser need to be combined with increases in stocking rate to justify the investment. |
| Soil type and phosphorus buffering index | Heavier soils (clays) have a higher surface area than lighter soils (sand/loam) which gives them a higher phosphorus buffering index (capacity for the soil to hold onto phosphorus). These soils require higher phosphorus inputs to maintain and increase available phosphorus. Soils which are high in iron or aluminum will also tie up more phosphorus, making it unavailable to plants. |
| Rainfall | As rainfall increases, pasture production and nutrient turnover increases, increasing the need for higher nutrient levels. |
| Landscape and pasture species mix | Hill pastures are more likely to lose soil (and therefore phosphorus) than flatter landscapes, increasing the need for maintenance phosphorus. However, where hills are combined with lower water holding capacity, lower pasture production and less fertiliser-responsive species, they may use less phosphorus, making maintenance requirements lower. See the Orange EverGraze Proof Site Managing to production zone page for further details. |
| Grazing management | Set stocking or continuous grazing can result in a high degree of camping behaviour and resulting nutrient transfer. Pastures which are rotationally grazed require around 0.2 kg/DSE/ha less maintenance fertiliser than pastures which are set stocked. See the Broadford Grazing Experiment results for further detail. |
What it all means
The Hamilton Long-Term Phosphate Experiment provides an insight into the effects of changing fertiliser rates and stocking rates. Higher P rates lead to greater pasture production, improved pasture composition, higher nutritive value and enhanced persistence of sown species. These changes to the pasture base lead to much higher animal production than could be predicted from merely measuring changes to pasture production.
The profitability of the different treatments were calculated using current (2007-12) prices and returns and then at a range of different prices and production levels. In all of these scenarios, the optimum P rate and stocking rate was remarkably constant around 15 kg/ha P and 18-20 ewes/ha.
Financial analyses of stocking rate experiments shows that the variability of gross margins increases with higher stocking rates due to higher costs and lower returns incurred in drought years. Variability cannot be calculated from the data available in this analysis but it is likely that the optimum stocking rate is around 15-18 ewes/ha (22-27 DSE/ha) when about 15 kg P/ha is applied, or slightly less than where peak profit occurs.
Many producers question the viability of higher fertiliser applications with increasing fertiliser prices. However this analysis shows that even if fertiliser prices double, it is much more profitable to apply at least 15 kg P/ha and run 18 ewes/ha than opt for lower or zero fertiliser applications.
Gross Margin per ewe peaked at 8-15 kg P/ha and was $5-10/ewe higher than was achieved with low or zero P applications. At low P rates, poor lambing performance and higher supplementary feeding costs outweighed the lower cost of fertiliser.
While these financial assessments include reproductive performance as well as wool and lamb values, some benefits are still not included. These include:
- Lower animal health costs; Ewes in higher condition score on high fertility pastures require less drenching that those run at lower stocking rates on low fertility pastures.
- Salvage value of the pasture; It costs $300-500/ha to establish a perennial pasture. Sown species persist better on well fertilised soils whereas in low fertility situations, they are often invaded by weeds, resulting in a need to resow the pasture at more frequent intervals.
The higher soil P is effectively $$ in the soil and combined with improved pasture composition should result in a higher value of the land or the potential to use the P bank as a buffer against years of high fertiliser prices or low animal returns.
Farmers need to consider their own soil test results, rainfall, landscape, grazing management, current stocking rates and production potential when deciding on appropriate fertiliser input levels.
Acknowledgements
The Long Term Phosphate Experiment has been conducted by Agriculture Victoria since 1977. There have been many scientists and technical staff involved in the experiment throughout its life. Currently the trial is managed by Dr. Malcolm McCaskill. The EverGraze project funded the development of this page and the recent economic analysis conducted by Geoff Saul and Lee Beattie.
Further Information
- Making informed decisions about phosphorus fertiliser, Agriculture Victoria
- Long Term Phosphate Experiment Landscape visualisation
- Soil fertility Monitoring tool, Agriculture Victoria
- Five Easy Steps guide to phosphorus inputs
- Broadford Grazing Experiment
- Cayley, JWD, Kearney GA, Saul GR, Lescun CL (1999) The long-term influence of superphosphate and stocking rate on the production of spring lambing Merino sheep in the high rainfall zone of southern Australia. Australian Journal of Agricultural Research 50, 1179-90.
- Saul, GR, Kearney G, Flinn, PC, Lescun, CL (1999) Effects of superphosphate fertiliser and stocking rate on the nutritive value of perennial ryegrass and subterranean clover herbage. Australian Journal of Experimental Agriculture 50, 537-45.
- Morley, FHW, White DH, Kenney PA, Davis IF (1978) Predicting ovulation rate from live-weight in ewes. Agricultural Systems 3, 27-45.
- Saul GR (1996) Effects of two pasture systems on faecal nematode egg counts in breeding ewes. Australian Veterinary Journal 74, 154-55.
- Warn L, Webb Ware J, Salmon L, Donnelly J, Alcock D (2006) Analysis of the profitability of sheep wool and meat enterprises in southern Australia. Final Report for project 1.2.6. Available from Sheep CRC.

