Investing in pasture improvement
Improving pastures can increase production significantly and provide other potential spinoffs, but it should be a profitable investment. Calculations of the worth of investing in pastures can be complex and are often estimated differently, depending on who is doing the sums.
In considering whether to improve pastures, the calculations you make will depend on the question you want to answer. Two key questions that you might be interested in are:
- Can I afford it and
- Is it a worthwhile investment?
The second question is of particular use if you are considering other investments to increase production like buying more land or off farm investments for more financial security.
The information on this page has been made available in an EverGraze Exchange – Investing in pasture improvement
Can I afford it?
A simple way to look at the feasibility or affordability of an investment is to look at the impact on partial and whole farm cash flow and hence your ability to manage the extra costs and the implications for debt.
Cumulative net cash flow
Running net cumulative cash flows for the proposed investment can show you how long you may be in a negative cash flow and what the peak debt might be and hence – can you wear it? It can also indicate when that peak debt might occur as it may not be in the year of pasture establishment, due to the need to purchase more stock as the pasture establishes. So whilst in the year of establishment stock may be quite cheap, they may not be when you need to purchase them. Finally, it will provide a guide as to the time it will take to pay off the investment (or debt if finance is borrowed).
A projected cash flow will include the capital and maintenance costs associated with improving the pasture, the net return from the extra stock run (as the income and variable costs associated with the enterprise), purchase of extra stock and interest costs to allow for the borrowing of capital to make the investment. They should be done as far into the future as relevant and in the dollar values that will apply in the future, i.e. in inflated dollars. For pasture improvement programs this is often 5-10 years as indicative of time periods before cash flows may return to positive. Adding the cumulative cash costs and cash income associated with the paddock provides a guide as to the time it may take to recover the initial investment capital.
In doing your own projected cash flows, you will need to consider:
- Your current enterprise – a change of enterprise may be better able to maximise the benefits of better (or changed seasonal production) pastures.
- Stocking rates – improving pastures is seldom cost effective if stock numbers are not increased. The cost of purchasing extra stock is often not included in the analysis. If numbers are increased by breeding, then the loss of income from the sale of surplus stock will affect the farm cash flow and need to be considered also.
- Prices – in calculating long term cash flow, using today’s prices may not be realistic in the future. You can be lucky and have a good season and/or good prices (as in 2010) and so the investment will pay for itself quickly, or alternatively, a poor season and/or prices might push out any debt or loss of income for longer than your cash flow can sustain.
- Current financial situation – if you have to borrow to make the improvement then include what it will cost you. Financing the extra stock (especially in a strong market) is often a cost not considered when making the change.
Example cumulative cash flow analysis
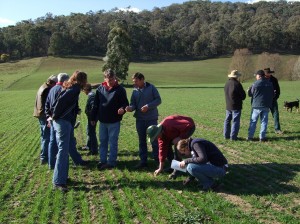
Joe runs a self-replacing Merino flock and is looking to sow a paddock to phalaris. He wants to know if he can afford the investment. Table 1 provides an example of working out a partial cumulative cash flow for this pasture improvement program. The key parameters are explained below.
The cost of establishment
Joe has calculated the cost of establishment to be $450/ha which includes the cost of lime in the first year due to high aluminium levels (Table 1).
Table 1: Example estimate of pasture establishment costs
| Expense | Product and rates | Cost per hectare |
| Seed | 8 kg sub clover ($8/kg), 3.5 kg phalaris ($20/kg) | $134 |
| Fertiliser | 100 kg/ha MAP ($80/tonne) | $80 |
| Lime | 2.5 T/ha + spreading | $115 |
| Knockdown spray | Glyphosate ($10/L) | $12 |
| Direct drill labour | $70 | |
| Post establishment spray (broadleaf weeds and red legged earth mite) | MCPA, Lemat | $17 |
| Post establishment spray labour | $22 | |
| Total | $450 |
Returns
Joe currently runs a stocking rate of 7 DSE/ha. Local trials indicate that a new phalaris pasture could run 14 DSE/ha, reached by the fourth year.
In this example, the enterprise gross margin for the wool flock is $20/DSE. This is used to estimate the returns from the extra stock that can be run on the improved pastures.
Once the full stocking rate has been reached (14 DSE/ha), the net returns from the extra stock run would be $140/ha (7 extra DSE/ha x $20/DSE), less the extra maintenance costs.
Maintenance costs
One of the key additional maintenance costs is fertiliser to replace nutrients removed by running the higher stocking rate. In this example, it is estimated that each additional DSE/ha requires 0.8 DSE/ha of phosphorous (P) fertiliser (See Hamilton Long Term Phosphate Trial). An extra 7DSE/ha therefore requires 5.6kg of P/ha. If Single Super Phosphate is used (8.8% phosphorus) at $240/tonne, phosphorus costs $2.72/kg. Therefore, an additional 5.6kgP/ha will cost $15/ha in fertiliser expenses. Other expenses may be incurred for additional sprays and labour.
Cost to purchase additional stock
Whilst the direct costs to improve the pastures are $450/ha there is also a cost to purchase the extra stock in the 3rd and 4th years. In this example they have been costed at $61/DSE (See Costs and Returns used for Victorian EverGraze Case Studies). The loss of carrying capacity in the establishment years may require extra costs to feed the stock, particularly if large areas are being improved or an opportunity cost due the lost grazing may be included. We have assumed here, that the stock could be carried over the rest of the farm, particularly as they are wool sheep and have lower nutritional requirements than meat producers
Inflation and interest
As the cash flow is being run over a number of years into the future we need to include an adjustment for inflation, and in this case we have used 3% per annum.
If the money is borrowed to fund the investment, the actual costs of borrowings would be included. In this example we have used 8% interest on borrowings (negative cash flow) and on earnings (positive cash flow).
Table 2 shows the workings of a twelve year partial cumulative cash flow for Joe’s phalaris improvement investment on a per hectare basis.
Table 2: Estimated cumulative net cash flow
| Year | ||||||||||||||
| calculation | 1 | 2 | 3 | 4 | 5 | 6 | 7 | 8 | 9 | 10 | 11 | 12 | ||
| Business as usual | ||||||||||||||
| Current stocking rate DSE/ha | A | 7 | 7 | 7 | 7 | 7 | 7 | 7 | 7 | 7 | 7 | 7 | 7 | |
| Enterprise gross margin | B | $20/dse | $20/dse | $20/dse | $20/dse | $20/dse | $20/dse | $20/dse | $20/dse | $20/dse | $20/dse | $20/dse | $20/dse | |
| Annual maintenance costs | C | $15/ha | $15/ha | $15/ha | $15/ha | $15/ha | $15/ha | $15/ha | $15/ha | $15/ha | $15/ha | $15/ha | $15/ha | |
| Pasture improvement | ||||||||||||||
| New stocking rate DSE/ha | D | 3 | 6.1 | 10 | 14 | 14 | 14 | 14 | 14 | 14 | 14 | 14 | 14 | |
| Annual maintenance costs | E | $15/ha | $30/ha | $30/ha | $30/ha | $30/ha | $30/ha | $30/ha | $30/ha | $30/ha | $30/ha | $30/ha | $30/ha | |
| Costs and returns due to the improvement | ||||||||||||||
| Pasture sowing | F | $450 | ||||||||||||
| Stock purchases | G | $183 | $244 | |||||||||||
| Extra maintenance costs | E-C | H | $15 | $15 | $15 | $15 | $15 | $15 | $15 | $15 | $15 | $15 | ||
| Increase in stocking rate | D-A | I | -4 | -1 | 3 | 7 | 7 | 7 | 7 | 7 | 7 | 7 | 7 | 7 |
| Adjustment for inflation at 3% per annum | J | 1.00 | 1.03 | 1.06 | 1.09 | 1.13 | 1.16 | 1.19 | 1.23 | 1.27 | 1.30 | 1.34 | 1.38 | |
| Cash flow $/ha | ||||||||||||||
| Extra return | I x B | K | $60 | $140 | $140 | $140 | $140 | $140 | $140 | $140 | $140 | $140 | ||
| Extra costs | F + G + H | L | $450 | $0 | $198 | $259 | $15 | $15 | $15 | $15 | $15 | $15 | $15 | $15 |
| Net cash flow | K – L | M | -$450 | $0 | -$138 | -$119 | $125 | $125 | $125 | $125 | $125 | $125 | $125 | $125 |
| Adjusted for inflation | M x J | -$450 | $0 | -$146 | -$130 | $141 | $145 | $149 | $154 | $158 | $163 | $168 | $173 | |
| Cumulative net cash flow (including interest) | -$450 | -$486 | -$671 | -$855 | -$783 | -$700 | -$607 | -$502 | -$384 | -$251 | -$104 | $60 | ||
| Interest at 8% | -$36 | -$39 | -$54 | -$68 | -$63 | -$56 | -$49 | -$40 | -$31 | -$20 | -$8 | $5 | ||
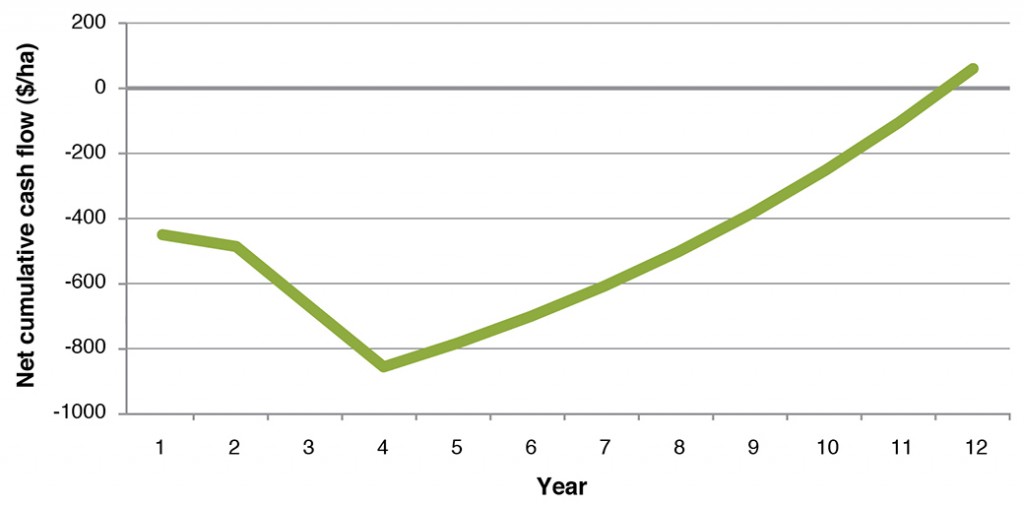
Cumulative cash flow
Figure 1 shows a graphical representation of the net cumulative cash flow, illustrating that in this example, peak debt occurs in the fourth year at -$855/ha and the investment will have paid for itself by the 12th year. Peak debt is in the fourth year and not in the year of establishment because of the purchase of the extra stock in the third and fourth years.
Other considerations
Stocking rate increases may also increase labour or infrastructure costs (e.g. yards, water supplies, fencing) and so these also should be taken into account in doing whole farm budgets.
In this analysis, the extra costs and income of the pasture investment are presented on a per hectare basis.
The whole farm implications of sowing down a portion of the farm need to be estimated and considered. That is, total effects on farm cash flow and implications for total debt.
Considering per head production
In the above example, the result of the pasture improvement was to double stocking rate but not to improve the enterprise returns per head or per DSE through better wool cuts, better lambing percentages, higher or more timely turnoff weights or reduced supplementary feeding (as examples). If you have some good indicators to quantify these benefits, they can be included.
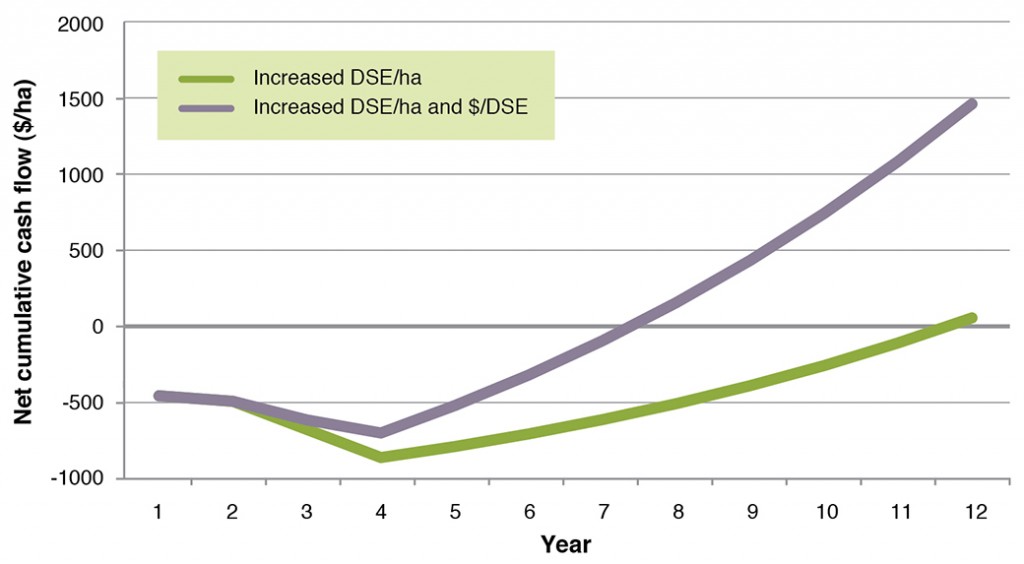
Returns for higher enterprise gross margins
If the improvement results in a doubling of stocking rate, and net returns increase from $20/DSE to $26/DSE (Table 3), the result is a lower peak debt of $694/ha and the investment is paid back by the eighth year . Figure 2 shows the cumulative cash flow for both examples (increase stocking rate and increased returns as $/DSE).
Table 3: Estimated cumulative net cash flow of an example pasture establishment with an improvement in enterprise gross margins and stocking rate.
| Year | ||||||||||||
| calculation | 1 | 2 | 3 | 4 | 5 | 6 | 7 | 8 | 9 | 10 | ||
| Business as usual | ||||||||||||
| Current stocking rate DSE/ha | A | 7 | 7 | 7 | 7 | 7 | 7 | 7 | 7 | 7 | 7 | |
| Enterprise gross margin | B | $20/dse | $20/dse | $20/dse | $20/dse | $20/dse | $20/dse | $20/dse | $20/dse | $20/dse | $20/dse | |
| Annual maintenance costs | C | $30/ha | $30/ha | $30/ha | $30/ha | $30/ha | $30/ha | $30/ha | $30/ha | $30/ha | $30/ha | |
| Pasture improvement | ||||||||||||
| New stocking rate DSE/ha | D | 3 | 6.1 | 10 | 14 | 14 | 14 | 14 | 14 | 14 | 14 | |
| Annual maintenance costs | E | $30/ha | $45/ha | $45/ha | $45/ha | $45/ha | $45/ha | $45/ha | $45/ha | $45/ha | ||
| New gross margin $/dse | B2 | $26 | $26 | $26 | $26 | $26 | $26 | $26 | $26 | |||
| Costs and returns due to the improvement | ||||||||||||
| Pasture sowing | F | $450/ha | ||||||||||
| Stock purchases | G | $183 | $244 | |||||||||
| Extra maintenance costs | E-C | H | $15 | $15 | $15 | $15 | $15 | $15 | $15 | $15 | ||
| Increase in stocking rate | D-A | I | -4 | -1 | 3 | 7 | 7 | 7 | 7 | 7 | 7 | 7 |
| Adjustment for inflation at 3% per annum | J | 1.00 | 1.03 | 1.06 | 1.09 | 1.13 | 1.16 | 1.19 | 1.23 | 1.27 | 1.30 | |
| Cash flow $/ha | ||||||||||||
| Extra return | (DxB2)-(AxB) | K | $120 | $224 | $224 | $224 | $224 | $224 | $224 | $224 | ||
| Extra costs | F+G+H | L | $450 | $198 | $259 | $15 | $15 | $15 | $15 | $15 | $15 | |
| Net cash flow | K-L | M | -$450 | $0 | -$78 | -$35 | $209 | $209 | $209 | $209 | $209 | $209 |
| Adjusted for inflation M x J | M x J | -$450 | $0 | -$83 | -$38 | $235 | $242 | $250 | $257 | $265 | $273 | |
| Cumulative net cash flow (including interest) | -$450 | -$486 | -$608 | -$694 | -$515 | -$314 | -$89 | $161 | $438 | $746 | ||
| Interest at 8% | -$36 | -$39 | -$49 | -$56 | -$41 | -$25 | -$7 | $13 | $35 | $60 | ||
Pasture persistence
In this example, it has been assumed that the improved pasture will remain fully productive into the 12th year. This may not be the case if fertilizer, grazing management and/or seasonal conditions are not ideal. Some species may be less persistent than others. An allowance for a drop off in production could be included which would of course extend the payback period.
Caution in estimating returns
Use caution when estimating enterprise returns as there is a high probability that product values and seasonal conditions will fluctuate. If your budget is tight and price estimates for outputs are high, then you may have insufficient funds to stock your improved pastures, or to maintain them (potentially impacting persistence). Using a longer term average return which takes in annual fluctuations will be better. See Costs and Returns used for Victorian EverGraze Case Studies provides the enterprise returns that have been used in the Victorian EverGraze case study financial analyses. These have been taken from the Livestock Monitor Farm Project (either the 41 year adjusted average for each enterprise or the 7 year regional averages). Benchmarks are also provided in most regional packages.
Is it a good investment?
Cash flows alone do not tell us whether the improvement is a good investment.
Internal rate of return IRR
The common measure that is used to help decide whether an investment is worthwhile is percentage return to the marginal capital invested, called the Internal Rate of Return (IRR). The IRR is a measure of the economic efficiency of the investment over the life of the investment, and can be compared with returns from alternative investments of the same capital, with a similar life and that are similarly risky. If the analysis includes inflation, the IRR is a nominal value that can be compared with market rates of return on investment. If no inflation is in the analysis the IRR is a real return on capital.
The IRR accounts for the cost of all the capital invested, the annual operating costs and the annual income. It also includes a salvage or depreciated value of the capital investments (such as livestock, fencing and pasture improvement) at the end of investment life. A lifespan of ten years is common for pasture improvement programs. Putting a salvage value on a 10 or 15 year old investment in improved pasture is tricky as this value depends on how much of the original investment in capital fertilizer, seed and sowing remains. Typically, salvage value of improved pasture ranges from 30% to 80% of the original investment. The investment in extra livestock can be salvaged at the same value as the initial investment in extra animals. The decision on whether to invest should not be determined on how you estimated the salvage value.
Example
For our example, Table 4 shows the gross margins per hectare and the Real Return on the Marginal Capital (IRR) invested over 10 years for when enterprise gross margin is $20/DSE and $26/DSE, compared to business as usual. Business as usual is the initial stocking rate and return. In this example, the impact of the improvement is to increase stocking rate only and so this shows the effect of having a more profitable enterprise (i.e. $26/DSE) to begin with. With an enterprise gross margin of $26/DSE, the per hectare returns increase to $363 gross margin/ha, pay back is in the 9th year and the return (as IRR) is 18%. Salvage value of the pasture in this case was 75%.
Table 4. Gross Margins and Return to capital (Internal Rate of Return) estimates for a pasture improvement option compared to ‘business as usual’ with a gross margin of $20 and $26/DSE.
| Business as usual | ||
| Stocking rate DSE/ha | 7 DSE/ha | |
| GM/DSE | $20/DSE | $26/DSE |
| GM/ha | $140/ha | $182/ha |
| Improved pasture | ||
| Stocking rate when potential | 14 DSE/ha | |
| GM/DSE at potential | $20/DSE | $26/DSE |
| GM/ha | $280/ha | $363/ha |
| Years to payback investment | 12 years | 9 years |
| IRR | 13% | 18% |
For this example, despite the long payback period as illustrated in the cash flow, the real return on extra capital (IRR) of 13-18% is generally considered a good return relative to comparable real returns on capital investments available elsewhere on the farm or in the economy. This is before tax.
Net Present Value
Another common measure used by businesses to compare or value a capital investment (often used for comparing project investments into the future) is Net Present Value (NPV). NPV is a measure of the ‘value’ or ‘addition to wealth’ of the investment over a set period of time. It includes all the flows of cash out and in, adjusted (discounted) to their equivalent present value. Salvage or depreciated value of the capital investments (such as livestock, fencing and pasture improvement) at the end of the time period are included. The present value of all cash in minus the present value of all cash out, adjusted to present value at the interest rate applicable to the capital used, is the net present value of the investment. The NPV represents addition to wealth by the investment.
Discount Rate
The discount rate is used to adjust future income and costs to their equivalent present value and is the minimum rate of return on capital you require and are willing to accept. It represents the opportunity cost of investing elsewhere. If you were borrowing all the capital at a real interest cost of 5%, or could get a 5% real return on investing the capital in a similarly risky way, then you would use a 5% real discount rate to adjust the future value of the cash flows to their equivalent present value. The NPV represents the sum you would have after the time period, in current dollar values, and above the 5% return that you would have made if invested in the alternative. Hence if the real IRR of the investment over ten years is 5%, and the discount rate was 5% real, then the NPV will be zero, meaning you will have earned 5% real return on the capital, and added no more to your wealth than if you had invested in the alternative way.
Table 5 shows the calculations of NPV, with discount rates of 5%, 10%, 13% and 15%, after ten years, for our pasture improvement example with a gross margin of $20/DSE.
Table 5: Estimates of NPV for 5, 10 and 15% discount rate
| Discount Value | ||||
| 5% | 10% | 13% | 15% | |
| NPV ($/ha) | $460/ha | $148/ha | $0/ha | -$56/ha |
In our original example with a $20/DSE gross margin the IRR was 13%. Hence at a 5% discount rate, the Net Present Value of the Investment (NPV) will give you additional wealth above the 5% real return alternative option of $460/ha. If investing somewhere else would give you 10% real return after ten years then you would be $148/ha better off with this investment. As the actual return (IRR) of the investment is 13% real in this example, then the NPV is approximately zero when the discount rate is 13% and negative (-$56/ha) if the discount rate is higher than the IRR at 15%.
Table 6 summarizes the key economic measures for our example including the NPV when the gross margin of the enterprise is $20/DSE or $26/DSE and the discount rate is 10%.
Table 6. Key economic measures for pasture improvement example
| Improved pasture | ||
| Stocking rate when potential | 14 DSE/ha | |
| GM/DSE at potential | $20/DSE | $26/DSE |
| Years to payback investment | 12 years | 9 years |
| IRR | 13% | 18% |
| NPV (at 10% discount rate) | $148/ha | $363/ha |
The more profitable enterprise ($26/DSE gross margin) is expected to earn a real return on capital (IRR) of 18% and add $363/ha of wealth above investing elsewhere at 10% real. All cash put into the investment is expected to be recouped by year 9 when the cumulative net cash flow becomes positive.
If we do the same sums for the scenario where the improvement leads to a 7DSE/ha increase in stocking rate and a $6/DSE improvement in enterprise returns (as in Table 3), the IRR is 23% and the extra wealth (NPV) is estimated at $600/ha.
Considering labour and infrastructure
Gross margins do not represent a measure of whole farm profitability, as there is no account for owner labour (only contract labour is included), overheads or interest and lease costs. If considering changing enterprise to better utilise the improvement, you may need to consider whether infrastructure or overhead costs will increase (or decrease) and also whether running more, or different, stock will increase labour costs. Increasing stocking rates across the farm may increase your exposure to tough seasons. Therefore any potential extra costs, labour and risk must be considered before making large scale improvements.
Risk of failed establishment
Establishing pastures can be risky and some environments are more challenging than others. There are various methods of accounting for ‘risk’ but generally most farmers will make a decision on whether the benefits of the improvements are worth the perceived risk of failed establishment. This could include wanting a better return on investment to cover the risk. Another option is to include a cost in the first year. So if Joe considered that the risk of a failed establishment is as high as 20%, he could add 20% of the cost of the establishment (in this case this would be $90/ha) to account for the cost of re-sowing the pasture. Alternatively he might only consider going ahead with a more profitable enterprise that has a faster payback time and better return (IRR).
Pasture Improvement Calculator
To do your own sums, you can use the Pasture Improvement Calculator available under the Tools section of this website. It allows you to use a range of finance costs and required rate of return that suit you and uses the value of the extra investment and costs compared to your original stocking rate and gross margin.
EverGraze Case Studies
Economic case studies have been developed for a number of EverGraze Supporting Sites including:
- Creightons Creek (NE Vic) – establishing phalaris compared to improving existing phalaris
- Ararat (SW Vic) – establishing lucerne and phalaris
- Kyneton (NE Vic) – establishing phalaris, perennial ryegrass and chicory
- Seymour (NE Vic) – establishing phalaris compared to annual ryegrass
- Tallangatta Valley (NE Vic) – establishing tall fescue/cocksfoot mix
- Surf Coast (SW Vic) – an example of when establishing new pastures had poor returns
- Woogenellup (WA) – establishing lucerne and fescue mix
- Kojonup (WA) – comparing kikuyu to annual pastures
- Manjimup (WA) – comparing tall fescue to annual ryegrass/sub clover pastures
- Oyster Harbour (WA) – comparing tall fescue with annual pasture
- Esperance (WA) – comparing kikuyu to annual pasture
