Holbrook / Chiltern EverGraze Proof Site Climate
The climate of North East Victoria and Southern NSW is characterised by hot, dry summers, followed by cool nights and warm days in autumn, then crisp sunny days in winter. Average annual rainfall in Chiltern and Holbrook are 680 mm and 684mm respectively. Rainfall is winter dominant with a growing season of 7-8 months. Details of climate and variability throughout north east Victoria can be found in the Regional Context.
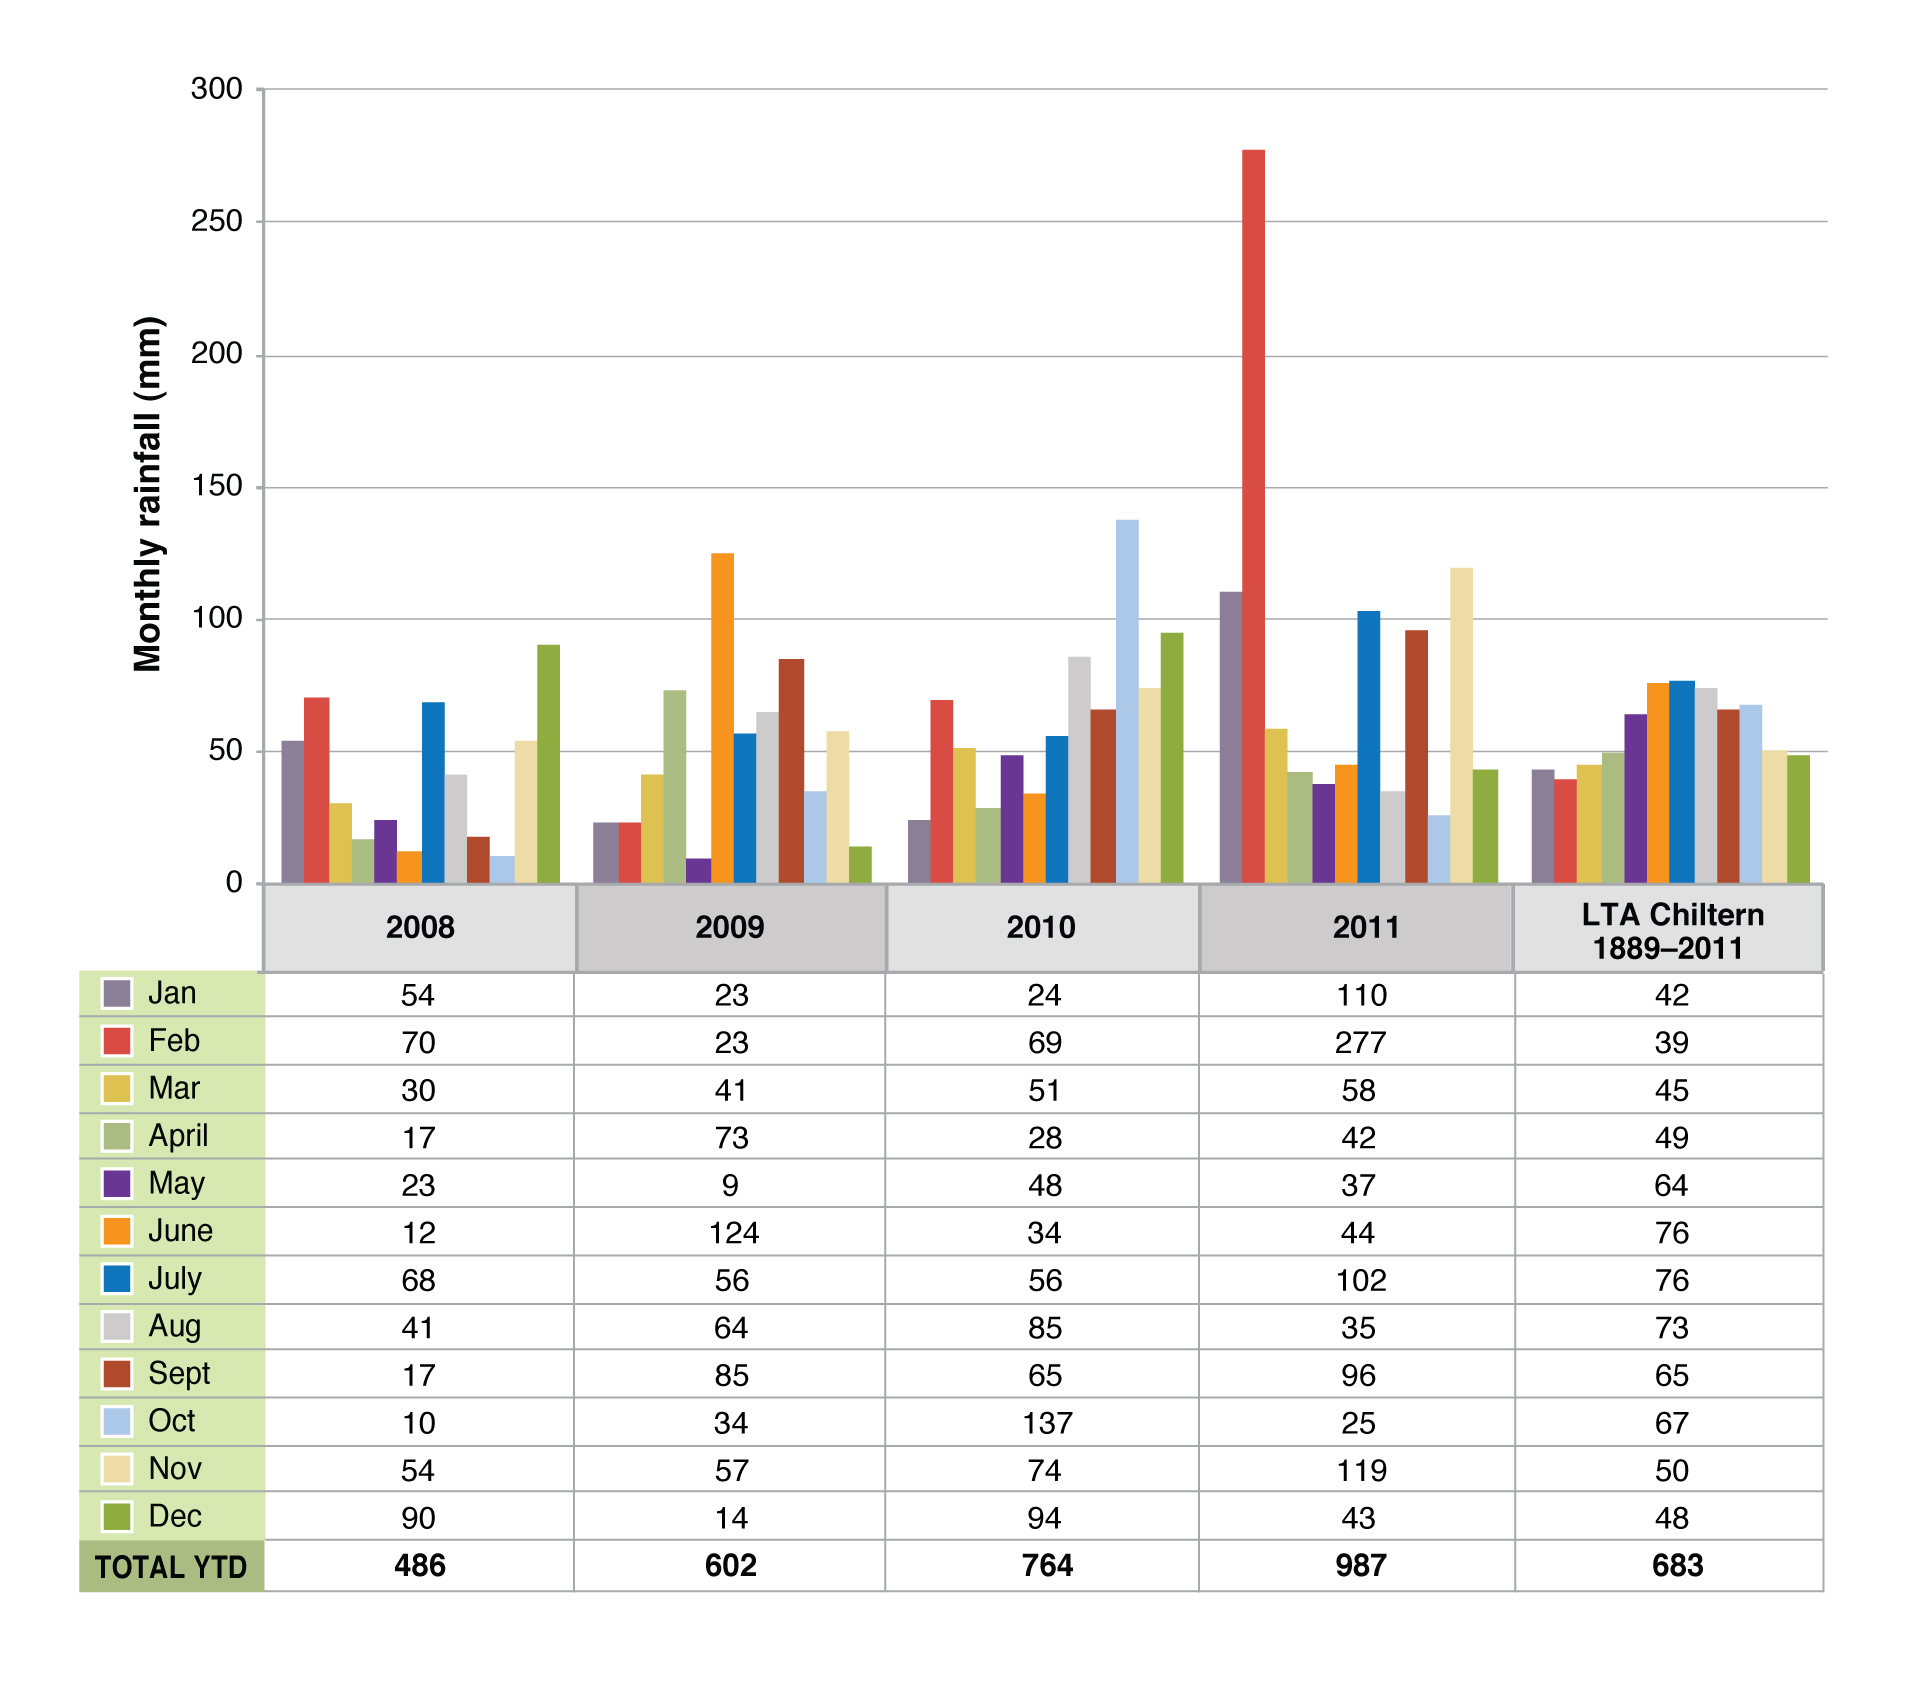
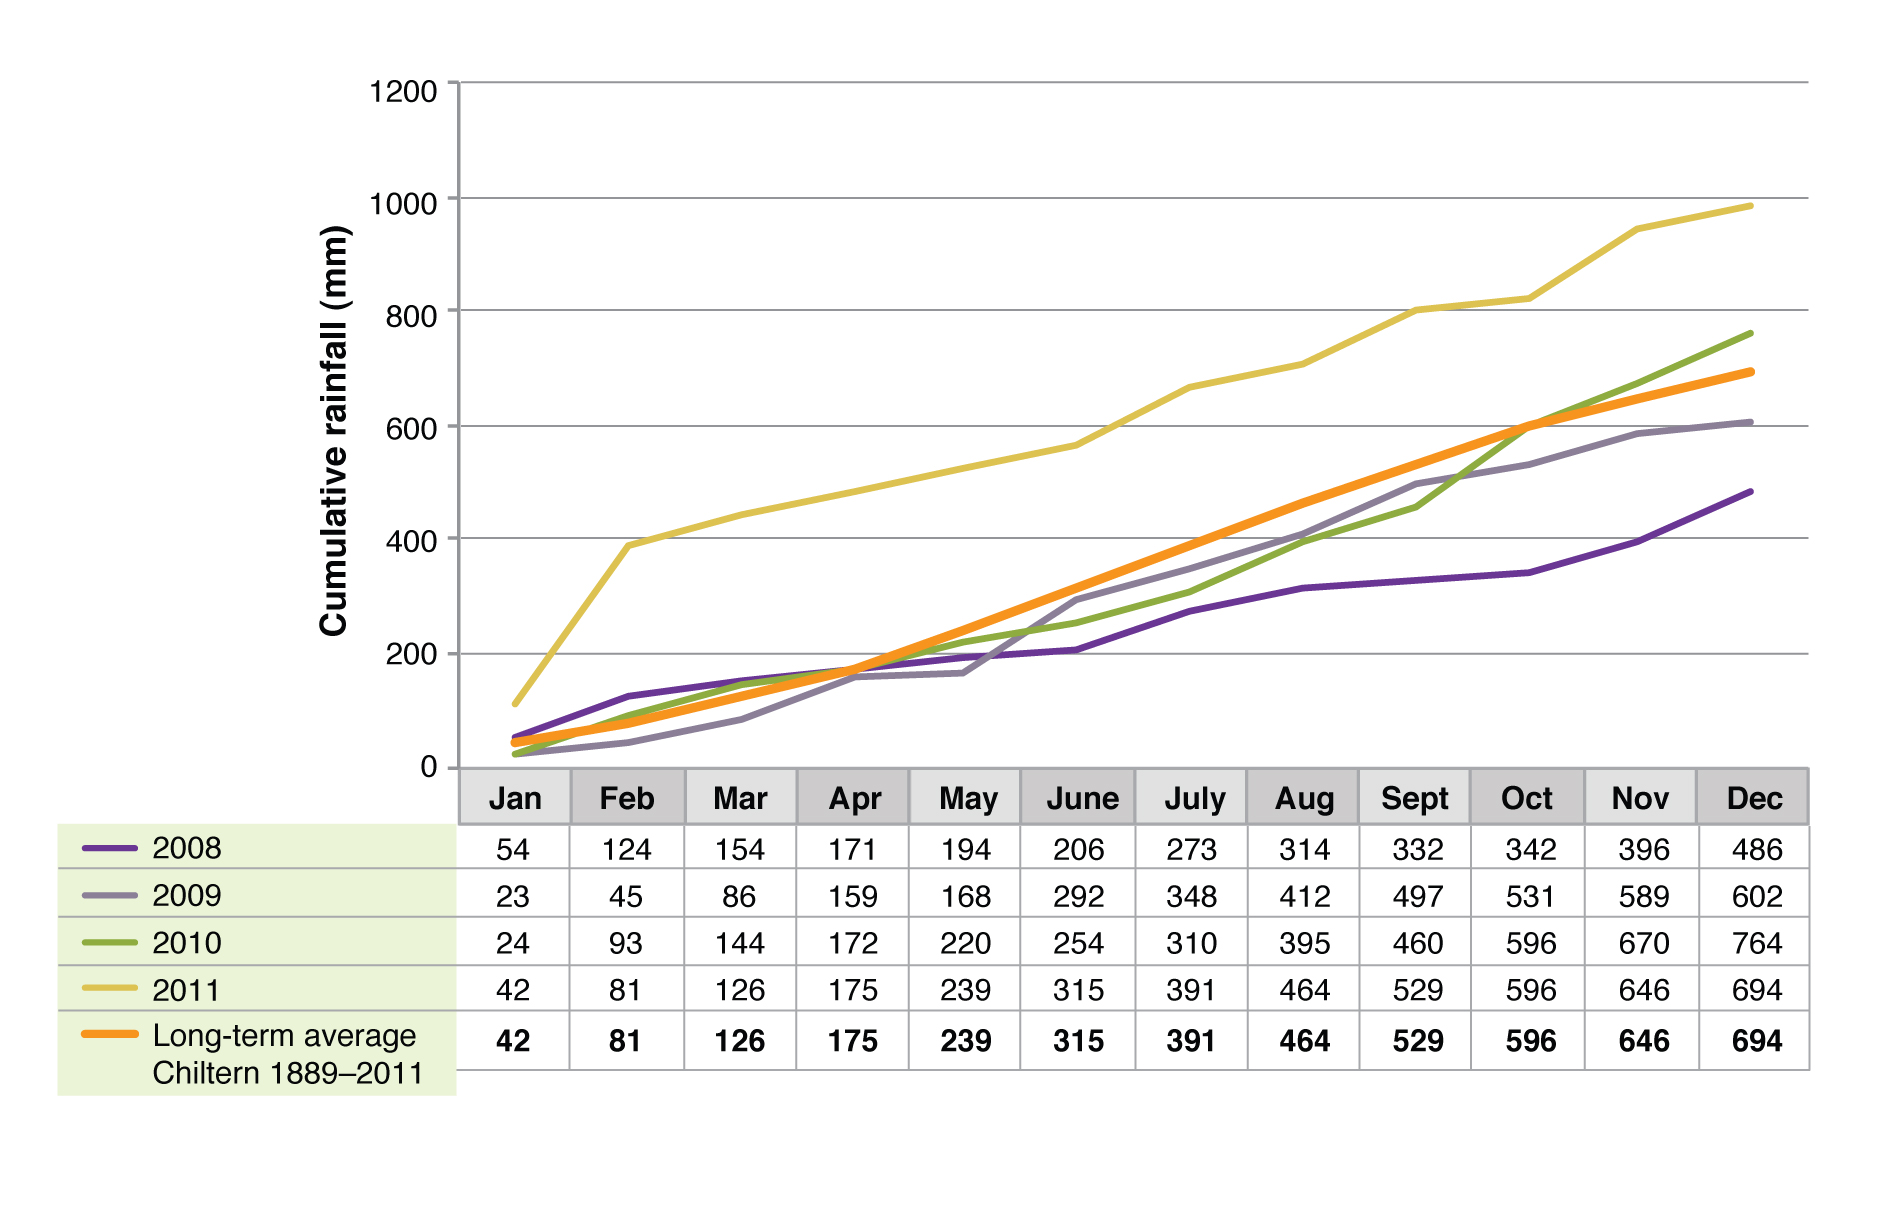
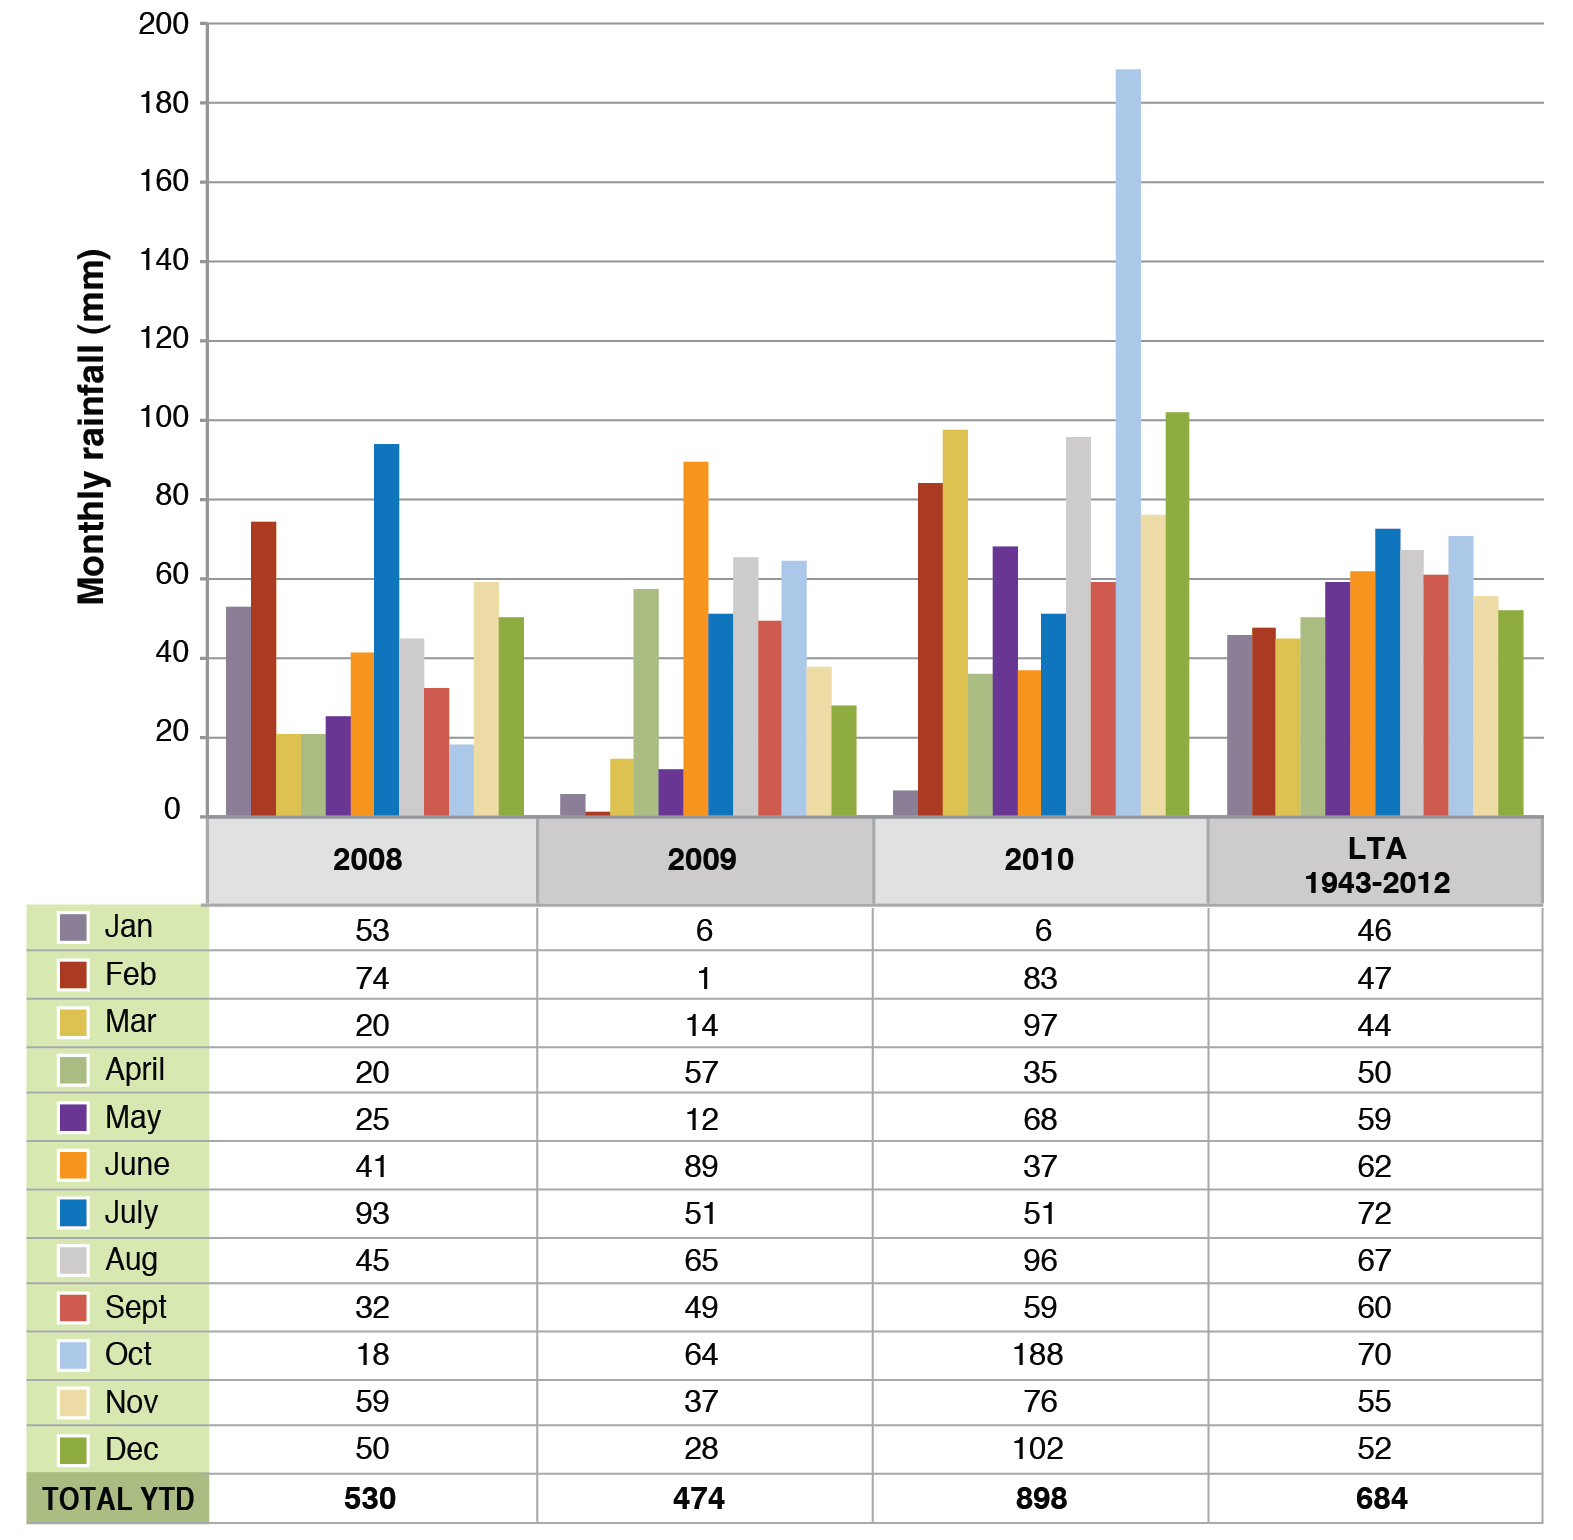
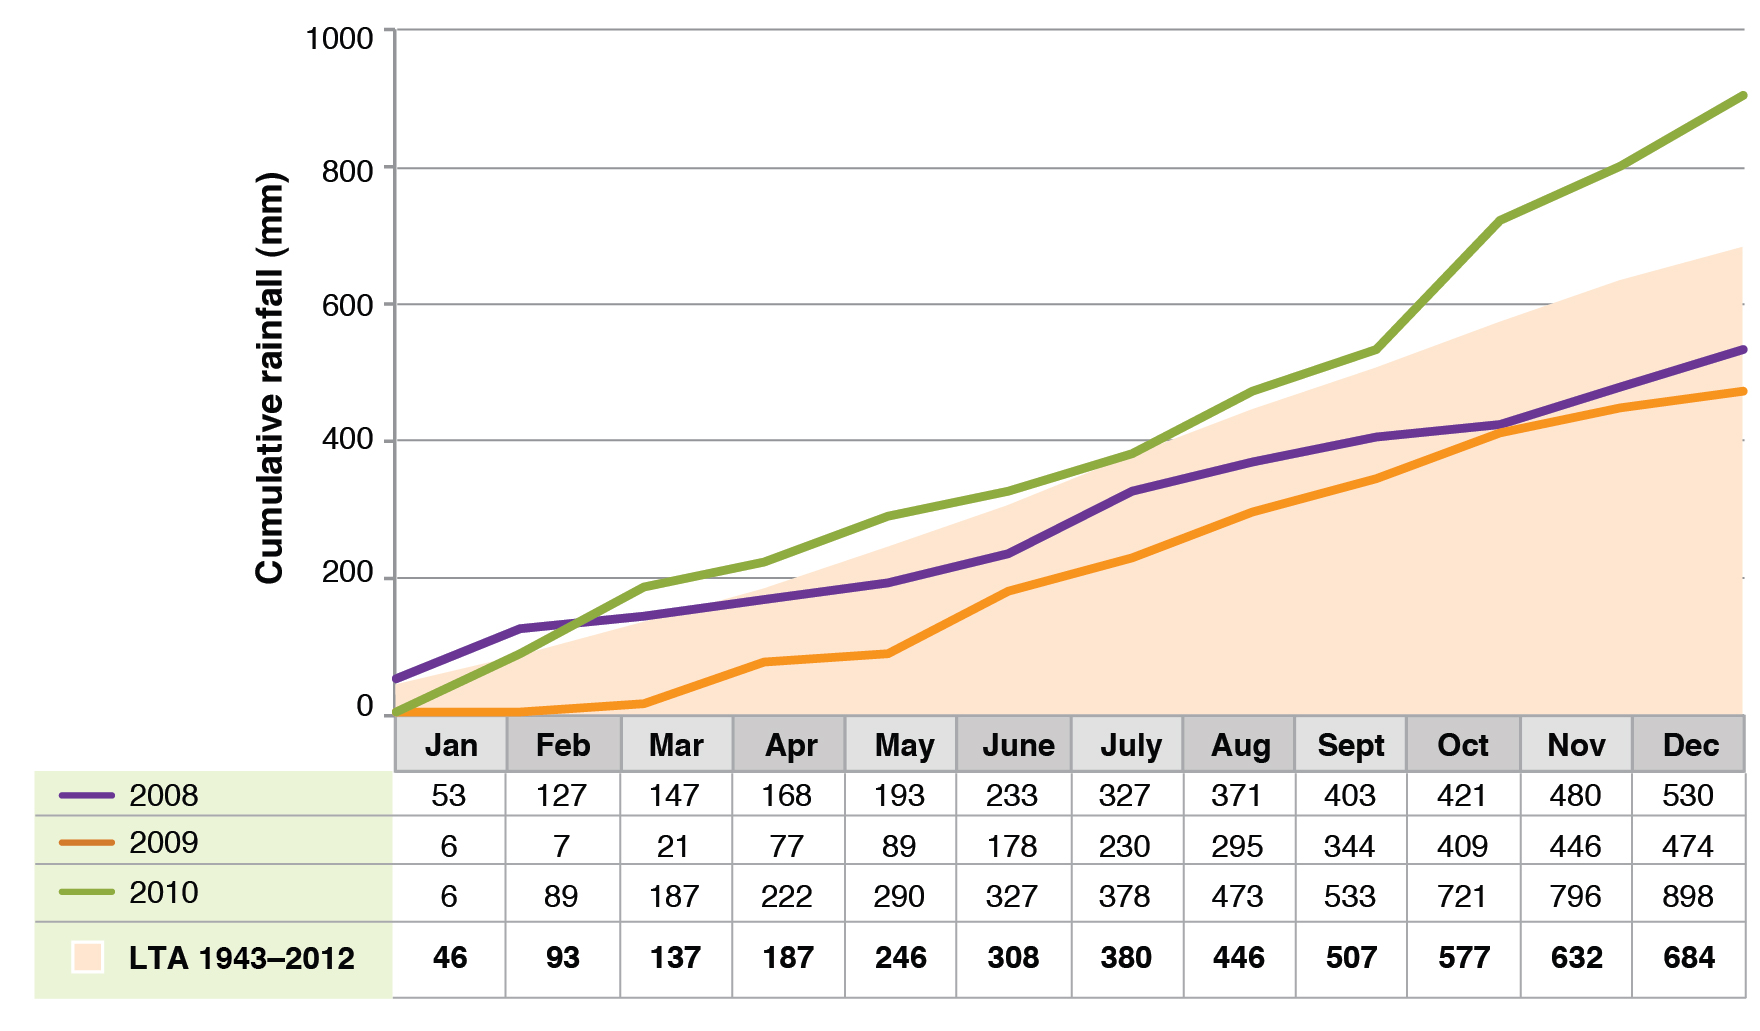
Figures 1 and 2 describe the rainfall during the Chiltern experiment. Annual rainfall during the experiment was below the long term average in 2008 (486 mm, decile 2) and 2009 (602 mm, decile 3), above average in 2010 (764 mm, decile 6) and 2011 (987 mm, decile 10). Seasonal rainfall deviated considerably from the long term averages across the years. Rainfall for Holbrook followed the same pattern and is presented in Figures 3 and 4.
Of particular note was the occurrence of heavy summer rainfall events in January 2011 (110 mm, decile 10) and February 2011 (277 mm, decile 10). The native grasses responded to these rainfall events, by increasing dry matter production and basal area. The rainfall in autumn periods for all years of the experiment was below average. The spring periods of 2008 and 2009 were notable in having months of below average rainfall.
|
|
|
|
|
|
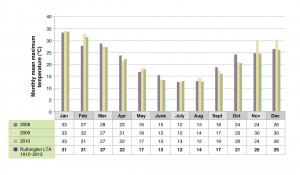
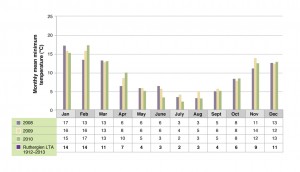
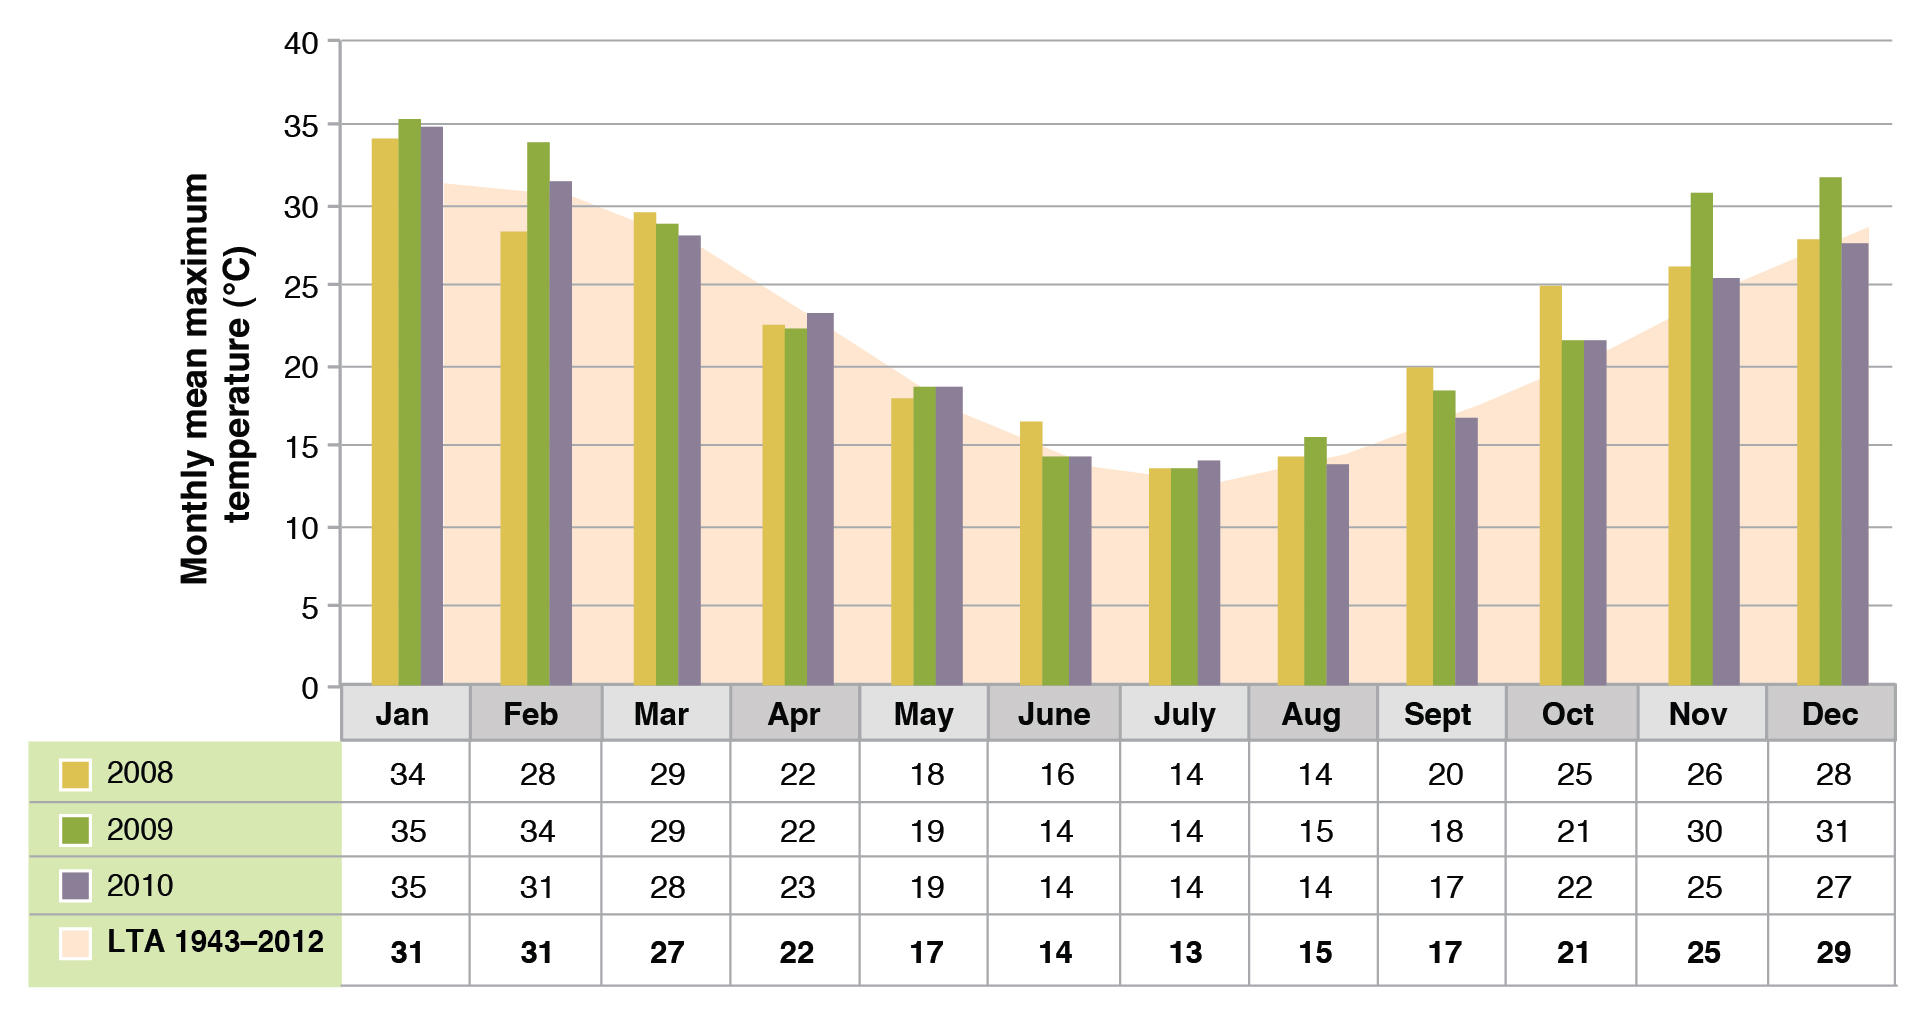
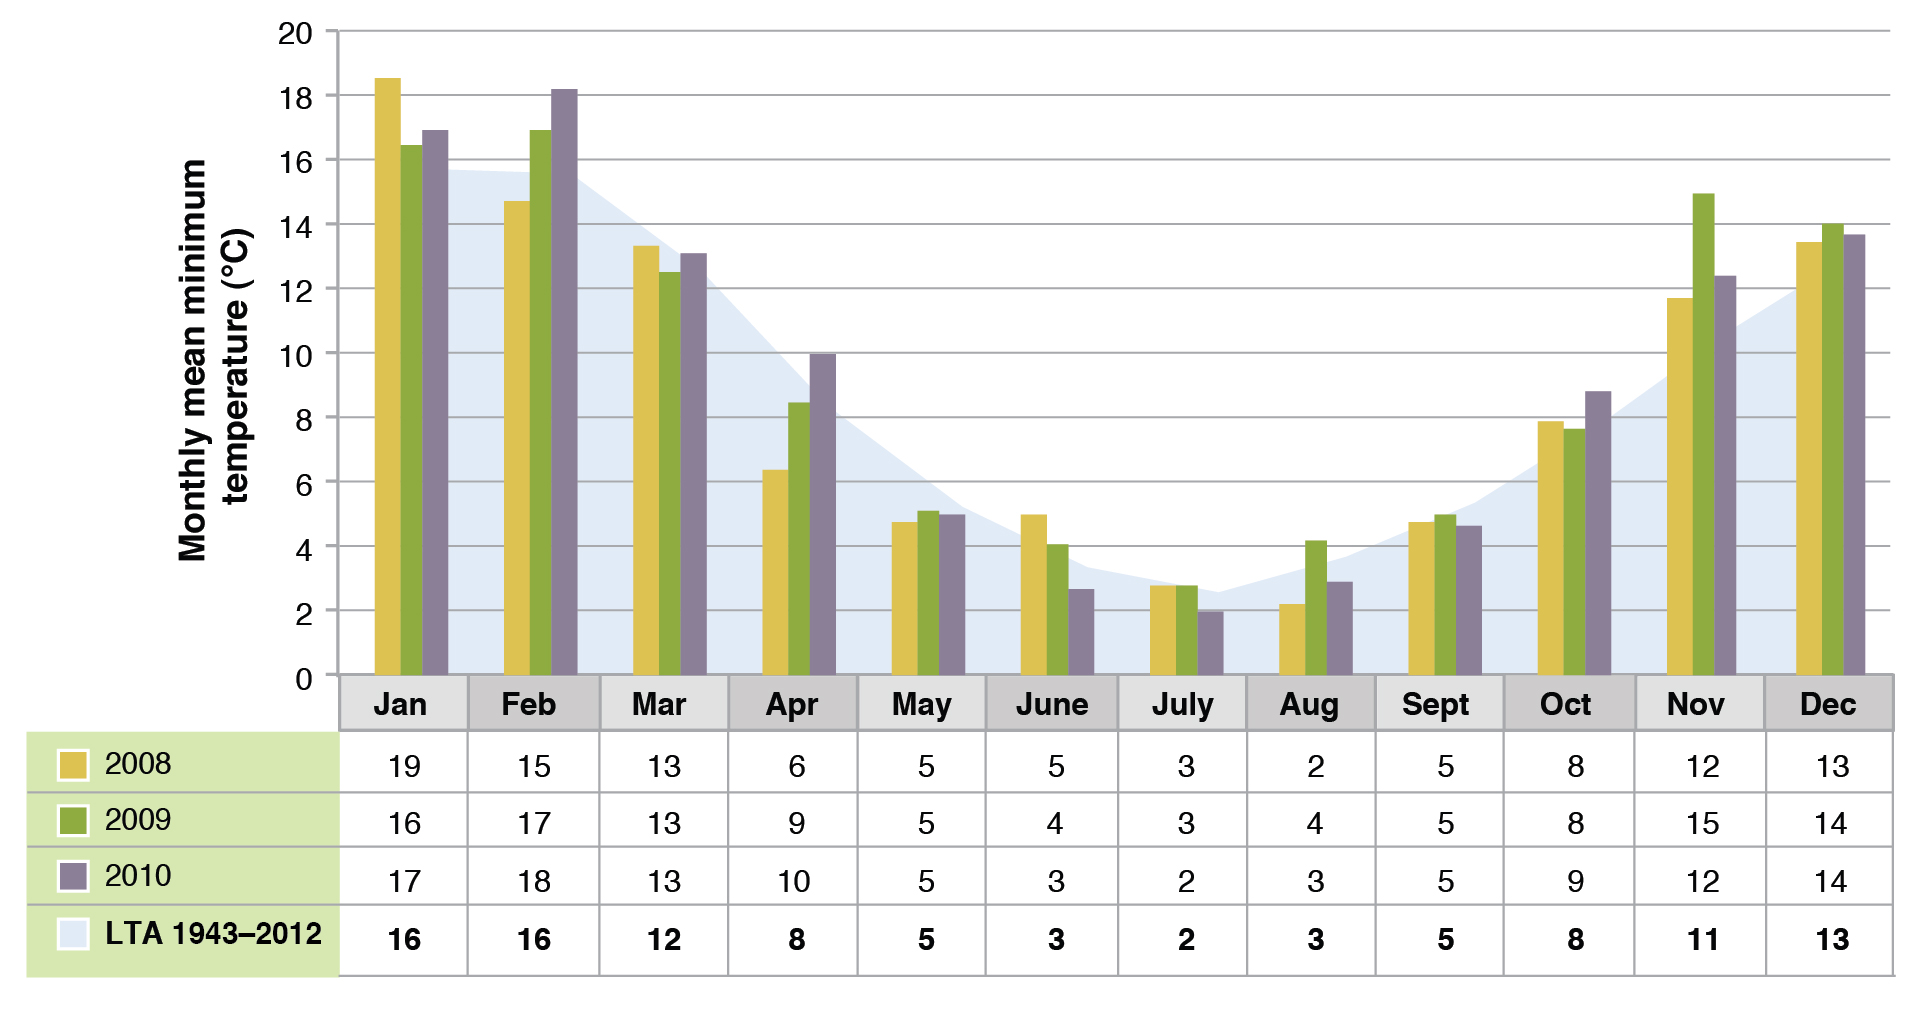
Figures 5 and 6 describe annual average maximum and minimum temperatures for the Chiltern experiment. Mean monthly maximum temperatures in spring 2009 were above the long-term (1889-2011) average. The monthly mean minimum temperatures during spring and summer were above the long term average in all years of the experiment. The monthly mean minimum temperatures during winter 2008, 2009 and 2011 were above the long term averages. The hottest temperature that was recorded at the field site was 44°C in late January and early February 2099. Whereas the coldest temperature, of -2°C, was recorded in July 2010. Temperatures for Holbrook are very similar to Chiltern and are shown in Figures 7 and 8.
|
|
|
|
|
|