EverGraze Exchange – Livestock Systems (Online)
This Online EverGraze Exchange provides information on the key factors driving livestock productivity and enterprise profitability. A process is included for evaluating your livestock system to identify opportunities for optimising pasture utilisation and long term profitability, whilst also staying within the boundaries of financial and environmental risk.
Summary
Achieving greater profit from perennial pastures requires efficiency in pasture consumption, capturing the benefits through higher stocking rates, higher per head production, lower supplementary feed expenses and greater overall livestock production per hectare. Factors affecting how far stocking rate can be increased include pasture utilisation and the impact on financial and environmental risks, time of lambing, timing of extra pasture growth, reproductive performance and the type of sheep or cattle enterprise being run.
To maximise the potential gain, producers must match livestock requirements to seasonal pasture production. Summer active perennial pastures modify the production profile and provide additional feed during summer, autumn or winter, providing opportunity to further improve profit.
This EverGraze Exchange draws from key research conducted at Hamilton (Vic), Albany (WA) and Wagga Wagga (NSW) EverGraze Proof Sites. Detailed information on this research can be found on the following pages:
- Sheep systems for maximising profit from perennials at Hamilton EverGraze Proof Site
- Flexibility in livestock systems is important for risk management in variable climates (Wagga Wagga EverGraze Proof Site)
- Adding 25% perennials will give the highest gross margin (Albany EverGraze Proof Site).
 |
 |
Introduction
Achieving greater profits from livestock grazing perennial pastures is at the most basic level about feedbase use efficiency. Pasture grown on farm is usually the cheapest source of energy and protein and the most profitable way to turn this into product is to improve utilisation, optimising the amount of clean wool, lamb or beef product per hectare, while minimising costs.
Stocking rate is the biggest driver of pasture utilisation. Potential stocking rates are determined by assessing your annual feed supply and demand, and its variability both within and between seasons. Supply factors are driven by climate (rainfall, the length of the growing season and its variation), soil condition and fertility , topography, and the types of pastures (summer vs winter activity) . Ground cover, feed on offer, fodder reserves and supplementary feeding thresholds for protecting pastures and managing risk will also help to set the boundaries to stocking rate and utilisation.
As well as adjustments to stocking rates, optimising pasture utilisation may involve changes to the enterprise setup in terms of lambing/calving times and enterprise mix, which will influence the timing of peak pasture supply and demand; and the degree of stocking rate flexibility to deal with climate variability. These changes need to be considered along-side target markets and associated turnoff weights, and inputs required to meet reproductive performance targets.
When considering changes to livestock systems it’s important to critically evaluate each option and its impact on profit/ha, not just $/head. It’s also important to consider the available resources, management expertise and what other associated business management changes may be required such as changes to marketing, as well as your interest and passion.
This Exchange covers the steps for evaluating your livestock system and considering where improvements to production or cost reductions could be achieved. Research and modelling from EverGraze and other projects is referenced to illustrate how the potential impact from change should be considered and can be evaluated.
Steps for considering changes to your livestock system
|
Defining the business
It is important to clearly scope and define the aims for your livestock enterprise. Going through this process assists in defining the marketing possibilities for product and the scope for change with regard to improvements that could influence your profitability and but also the boundaries defined by business and environmental risk.
Benchmarking your performance
Once the business/enterprise has been defined, use objective measures to benchmark the performance of the livestock system against similar enterprises. There are formal benchmarking services available that can assist in establishing current farm performance but this process can also be done by using your own farm data and analysing current farm performance indicators such as stocking rate, lambing and calving percentages. Benchmarks are available for some regions in the regional packages. Cost of production calculators are also available that can assist in establishing the financial cost of producing lamb, beef or wool. This comparison will inevitably lead to some consideration of the enterprise type and whether a change in enterprise can lead to improved profits.
Enterprise Selection
Enterprise selection is critical to profitability. Modelling studies (Young et al 2004, Young et al 2010 ) have shown significant improvements in profit by selecting the most profitable enterprise and optimising the production system. However, many benchmarking studies have also shown that profitability varies widely amongst enterprise types and that in any enterprise the top 20% of producers can achieve similar levels of profitability to those in other enterprises. This benchmarking information has given rise to the phrase, “It is not what you do, but how well you do it”. Furthermore swapping to a different enterprise does not necessarily generate more profit and producers should also consider carefully the costs involved in changing enterprise type which may require purchasing of new livestock, new approaches to marketing and the acquisition of new management skills or infrastructure. Therefore, selecting an enterprise should also be based on experience, skills, facilities, management expertise and personal interest and a passion for the enterprise. There may also be many ways in which to improve the productivity and profitability of an existing enterprise and some of these are detailed in the section below.
Setting Targets
The setting of targets is integral to the future measurement and assessment of performance of the livestock system. These targets should include;
- Production targets
- Stocking rate
- Reproductive performance
- Growth/turnoff weights against target markets
- Wool production and quality
- Environmental targets and boundaries for ground cover and feed on offer
- Limits on supplementary feeding costs relative to production targets
- Targets for labour efficiency
- Targets for animal health (e.g worm resistance) and livestock losses
- Limits on pasture management costs
It is important to set realistic targets that take into account the farm environment, climate, management history and attitude to risk. Targets should be reassessed annually and be staged if undergoing a steady program of improvement. This should be part of a regular ‘plan, do, act and evaluate’ cycle of business improvement. The EverGraze Exchange – Making on-farm strategic changes, provides worksheets and processes for assessing your own performance and making plans for change.
Determining stocking rate potential
Stocking rate is one of the key factors influencing profitability and sustainability. Low stocking rates compared to regional benchmarks lead to lower profitability. Stocking rates that are too high lead to unsustainable farming systems with low ground cover, erosion, loss of desirable species and erratic profitability (very low in low rainfall years, very high in good seasons). The optimum stocking rate that balances financial and environmental risk is usually 10-20% below the level that maximises gross margins.
Stocking rate needs to be closely matched with time of lambing/calving. It’s very difficult to run stocking rates that achieve optimum pasture utilisation, if the time of lambing/calving is out of sync with pasture production. This is discussed later.
Stocking rate potential, in the first instance will be determined by rainfall, season length, soils and topography and the corresponding feedbase (native pasture, improved perennials, annual pastures and/or crops). Research by Saul and Kearney (2002) indicated that for improved pastures across southern NSW, Victoria and Tasmania, around 70% of stocking rate potential could be attributed to growing season length (Autumn break to drying off at the end of spring). The potential stocking rate was also significantly influenced by soil fertility (measured by Olsen P) and paddock size. The potential stocking rates from this study are provided in Table 1. Farms and paddocks will vary substantially around these potential stocking rates based on their characteristics.
Table 1. Growing season length and potential stocking rate (Saul and Kearney 2002)
| Growing season length (months) | Potential stocking rate (DSE/ha) |
| 5 | 10 |
| 6 | 13 |
| 7 | 16 |
| 8 | 20 |
| 9 | 23 |
Sustainability indicators and benchmarks for determining pasture utilisation rates
Sustainability indicators can help to set the boundaries for achievable pasture utilisation rates, and provide a good visual guide for whether you are under or over-stocked throughout the season.
Visual indicators
The following pasture and soil degradation symptoms can result from over-stocking, under-stocking or if peak stocking rates are out of sync with pasture production:
- Low ground cover and exposed soil leading to wind and water erosion.
- Loss of perennial plants due to continuous over grazing without a recovery period – also leading to other problems such as soil salinity and acidity.
- Reduced feed quality and loss of sub clover due to under-stocking. Sub clover requires close grazing in spring and open spaces to germinate in autumn.
- Pugging and soil structure damage due to over-stocking in wet conditions, especially with cattle, leading to a breakdown in soil structure.
These symptoms can also result from uneven pasture utilisation if paddocks are not fenced to land class, very large paddocks or if they are continuously grazed. This is discussed more extensively in the EverGraze Exchange – The Nuts and Bolts of Grazing Management.
Ground cover and feed on offer benchmarks
Critical benchmarks for ground cover and feed on offer determine when stock need to be removed from pastures and containment fed to protect soils and species composition. This is most likely to occur during the late summer and through to the autumn break.
Minimum ground cover and feed on offer targets used at EverGraze Proof and Supporting Sites resulted in persistence of native and improved perennial pastures (when put in the right part of the landscape) on all sites, under a range of management regimes. For flat or undulating country, stock were removed at 70% ground cover and 800 kg DM/ha. For steeper country or on lighter soils, higher ground cover (80-90%) and feed on offer (1000 kg/ha) were targeted.
At higher stocking rates, or if peak stocking rates are out of sync with pasture production, critical benchmarks for feed on offer and ground cover will be reached more often (or for longer), resulting in higher supplementary feeding costs. On the other hand, if the benchmarks are never reached, it is likely that stocking rates are below the optimum. Another good indicator of under-stocking is the amount of feed carried from the previous spring through to the following winter. In winter rainfall regions, in most years, there should be a maximum 20% dead carry-over herbage by mid-June and minimal amounts of carryover dry feed present in pastures by mid-July. In these same environments, a rule of thumb for feed on offer at pasture hay off is that it should be around 3000kg DM/ha to provide sufficient dry feed for grazing over summer and autumn.
The MLA Feed Demand Calculator can be used to calculate the number of stock that can be run, and the potential requirement for supplementary feeding under a range of seasonal scenarios and assist in refining critical benchmarks for farms. Using the Summer Feed Budget Calculator in the EverGraze Feedbase Planning and Budgeting Tool, critical benchmarks can be set for the end of spring to ensure there will be enough pasture available at the autumn break. The Tool can also be used to calculate a winter feed budget to ensure that sufficient feed is available to meet livestock requirements.
The relationship between utilisation, stocking rate, profit, risk and supplementary feeding thresholds in a breeding enterprise
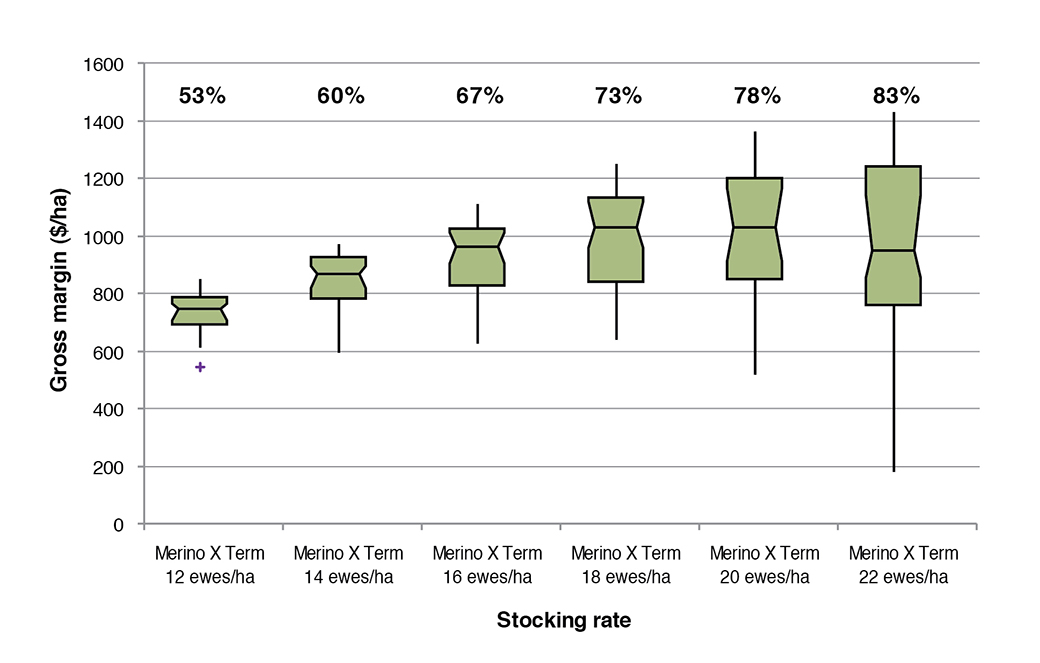
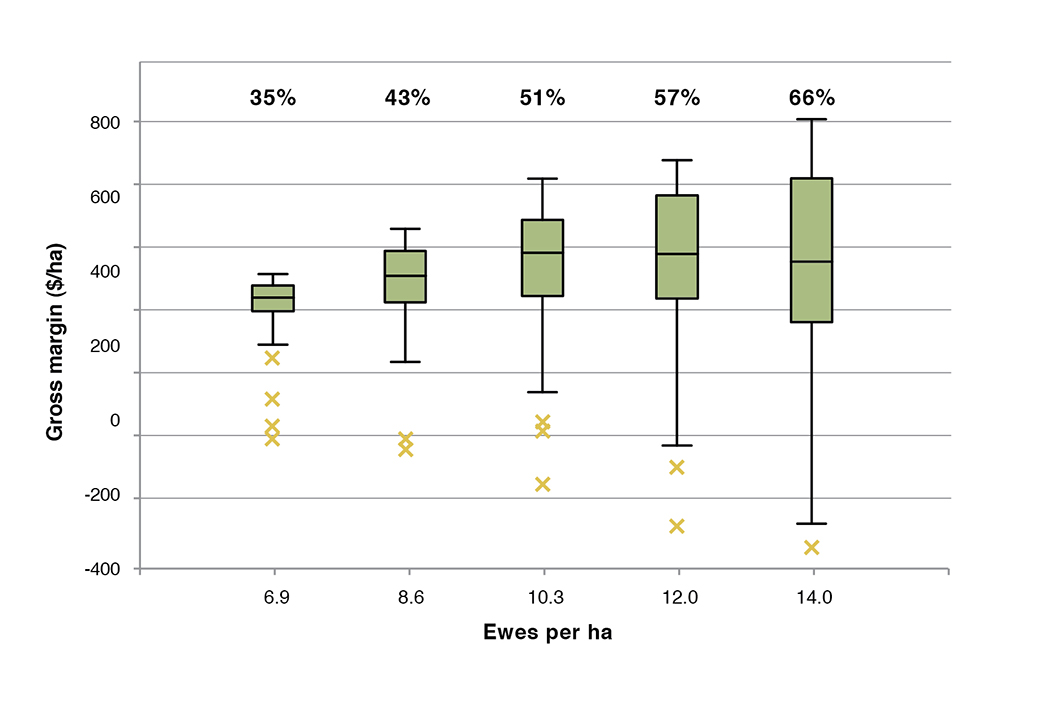
The optimum stocking rate and level of pasture utilisation will balance profitability with the risk of high supplementary feeding costs needed to meet reproductive performance targets (discussed later), target turnoff weights and stay above critical pasture and groundcover benchmarks. This relationship varies for different environments.
At the Hamilton and Wagga Wagga EverGraze Proof Sites, stocking rate and pasture utilisation was modelled against the variability in gross margins for 40 years of weather data (Figures 1 and 2). For the Hamilton site, as stocking rate for an August lambing system increased to 18 ewes/ha and 73% utilisation, average profitability increased. Beyond this point, gross margins became highly variable, the average profitability declined and targets for feed on offer in autumn and for supplementary feeding were more frequently exceeded. At Wagga Wagga (Figure 2), total rainfall is similar, but the season length is shorter than Hamilton, with much higher temperatures in late spring/summer causing pastures to dry off more rapidly. The incidence of failed autumns and springs is also higher. Therefore, in that environment, optimum pasture utilisation (for a September lambing system) is around 50% and 10.3 ewes/ha.
|
|
|
|
Sheep systems for optimising production from pastures
In a reproductive enterprise, livestock feed demand varies with stage of pregnancy and lactation and, as a consequence, varies throughout the year. Therefore, the timing of reproduction is important for matching peak demand with peak supply to achieve optimal pasture utilisation. This also needs to be considered in the context of target markets, turnoff weights and reproductive performance.
Reproductive performance for different sheep systems
The reproductive rate of sheep systems can be improved by increasing fertility (the number of ewes pregnant per ewe joined), prolificacy (the number of lambs born per ewe lambing) and survival (the number of lambs weaned per lamb born). The extra profit from increasing reproductive rate is a trade-off between the extra income achieved by having a flock with more surplus animals for sale and the extra costs associated with meeting the energy demands associated with more ewes pregnant or more ewes lactating.
Meeting condition score targets to optimise reproductive performance has been demonstrated to maximise profitability through field research and modelling conducted for the Lifetimewool and EverGraze projects.
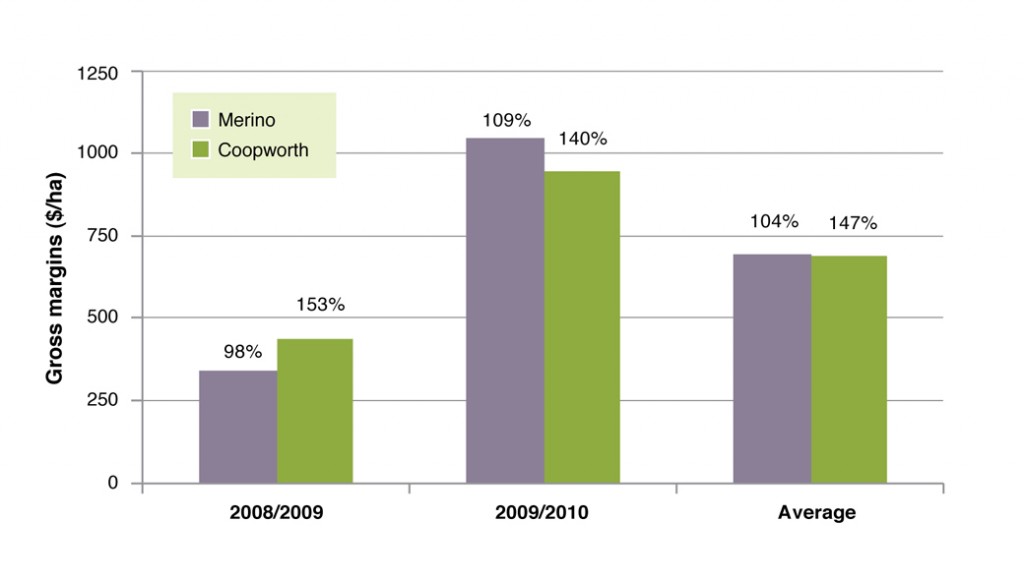
Target weaning percentages will vary with sheep system. Specialist prime lamb systems require higher reproductive performance to achieve the same profitability as Merino x Terminal or self-replacing Merino systems since a greater proportion of production comes from meat rather than wool. At the Hamilton Proof Site, the same gross margins were achieved for Merino x Terminal and Coopworth/composite prime lamb systems even though weaning percentages were much higher in the Coopworth/composite system (Figure 3).
These results were consistent with MIDAS modelling that has shown improved profit for each 10% increase in lambs weaned (Table 2). This modelling data shows the benefits of increasing reproduction are greater for meat focussed enterprises.
Table 2. Increase in profit ($/ha of pasture) achieved from producing an extra 10% lambs weaned for four flock/enterprise types on current (traditional south-west Victoria) pasture systems, and the Hamilton Proof Site high performance perennial ryegrass and the triple pasture systems (Young et al. 2004)
| Wool focused enterprise | Meat focused enterprise | |||
| Pasture System | Traditional wool | Wool/meat | Wool-meat terminal | 1st cross |
| Current |
8 |
17 |
26 |
23 |
| Perennial ryegrass |
14 |
28 |
40 |
30 |
| Triple |
13 |
30 |
44 |
27 |
Improvements to reproductive performance can be achieved by feeding ewes to meet Lifetimewool condition targets . EverGraze research has also shown that further improvements can be made through shelter for lamb survival, or by flushing ewes on green feed to increase ovulation and the resulting number of multiple births.
Time of lambing and target markets
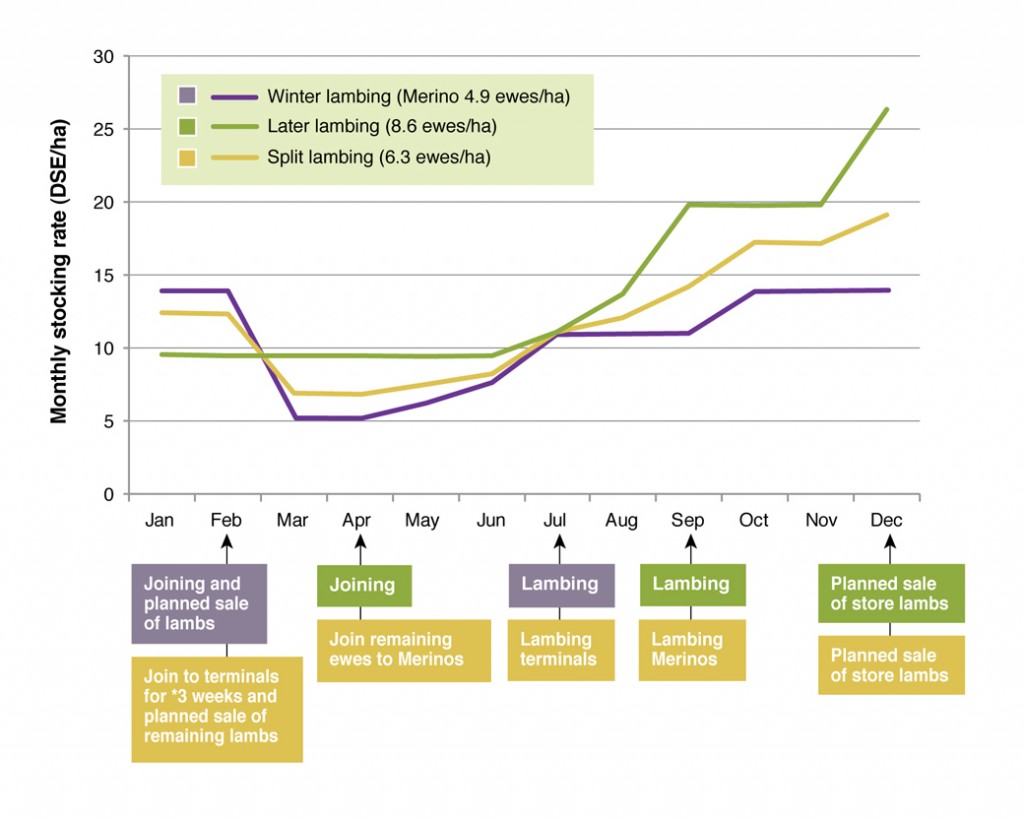
Ewe lamb systems have a relatively short lactation period (three to four months) when feed requirements increase three-fold. Figure 4 shows the stocking rate profile for a September lambing system compared to a July lambing system and a split lambing system (discussed later) at the Wagga Wagga EverGraze Proof Site. The mid-winter (July) stocking rate (DSE/ha) was similar with each lambing time, but varied over the year. Since peak demand for the later lambing system coincided with spring rather than winter, it carried nearly twice the ewes/ha as the Winter Lambing Merino, even though they had the same mid-winter DSE/ha.
Profitability with different lambing times is dependent on the feedbase, supplement costs, environment, target markets and whether stocking rates are set to potential. Proof Site research outcomes from Wagga Wagga, Hamilton and Albany considered these factors for their individual environments. Some of the key findings are described below.
Wagga Wagga
Modelling at the Wagga Wagga site (Robertson 2012) showed that on a feedbase consisting of 20% lucerne and 80% perennial grasses, a later lambing time resulted in higher profitability than a winter lambing system due to the ability to carry a higher number of ewes and therefore produce more wool and lamb per hectare. However, the higher number of ewes also meant that in drought years there was a higher risk of low gross margins due to higher supplementary feeding costs. Over the five experiment years (2006-2010), average gross margin was significantly less for the September lambing system than winter lambing, as consecutive failed springs (2006-2009) resulted in high supplementary feed costs and poor lamb sale weights for September lambing.
A split lambing system involved joining ewes to terminal sires for three weeks in February followed by a second joining (four weeks) to Merinos in April. Stocking rates were mid-way between the later lambing and earlier lambing systems, which meant supplementary feeding costs were lower than the later lambing system but there were more lambs to take advantage of lucerne in good seasons. While modelling using historical weather data (last 40 years) indicates the split joining would result in a lower average gross margin compared to running a higher stocking rate and lambing in September, split joining in the Proof Site experiment achieved the greatest margins as it was flexible enough to rapidly destock in a poor spring (selling July born lambs at weaning) while maintaining higher stock numbers in wetter springs and summers (by retaining both July and September born lambs). An all September lambing system, if using high stocking rates to optimise long-term average returns, can capitalise on good spring and summer conditions by retaining stock, especially if a significant portion of the farm has summer-active perennial species. However, this system is limited by its lack of ability to rapidly destock in a poor spring. If running a late-lambing system in an environment with significant spring rainfall variability, it is advisable to have a percentage of total stock numbers as tradable stock (eg. wethers, steers etc) to enable destocking in poor seasons.
Albany
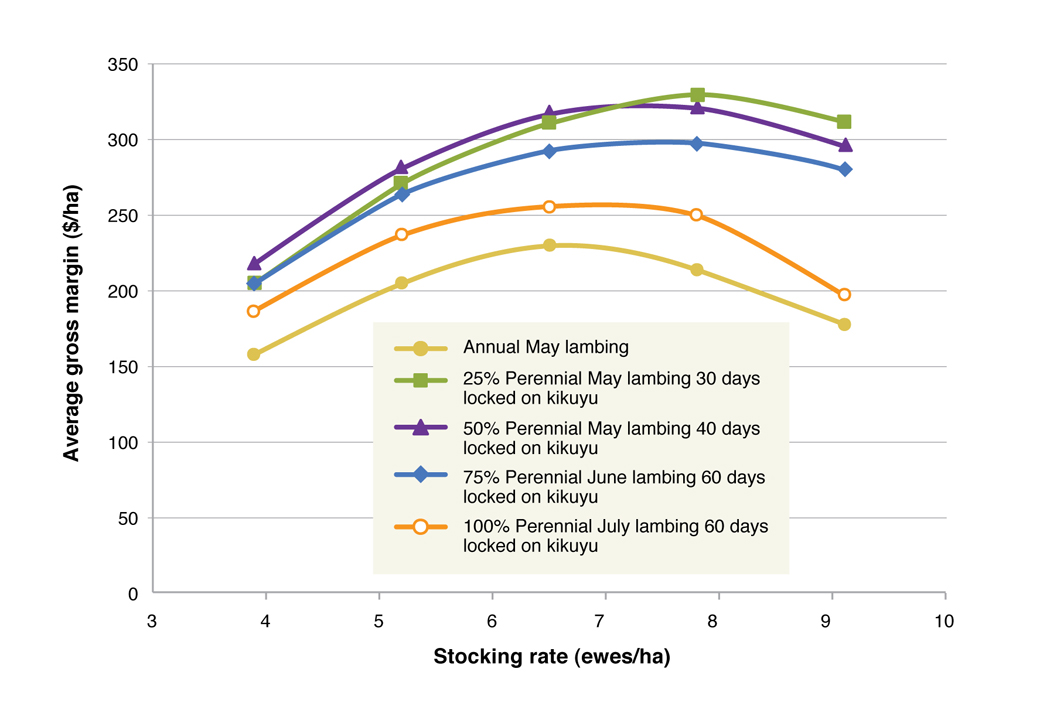
At the Albany Proof Site, optimum lambing time varied depending on the proportion of perennials in the system. Figure 5 shows the optimum lambing time and stocking rates for different proportions of perennials. With more perennials, a later lambing system was possible due to a longer growing season and lower winter growth rates compared to a system with more annuals. Having perennials in the system also reduced supplementary feeding costs due to the availability of kikuyu during autumn, resulting in higher Gross Margins. The Albany Proof Site team have recently completed modelling to illustrate the difference between meat- and wool-focussed enterprises.
Hamilton
At Hamilton , EverGraze ran Merino and Coopworth ewes joined to terminal sires with the objective of turning off store lambs (35kg) before Christmas. The ewes lambed in September for the first three years of the experiment because that was modelled to be the most profitable using MIDAS (Young, 2004). This was moved to mid-August in 2009 because it was difficult to get the majority of the progeny to the store weight target in the drier years experienced, which had been characterised by below average rainfall in October. Lambing in mid-August meant that the ewes were lambing four months before the end of the growing season which matched the guidelines proposed by Warn et al. 2006. A portion of the lambs were also able to be sold as finished lambs, while the remainder were sold as store lambs.
Changing the start time of lambing from 1st of August to 1st of July (sell lambs at 44 kg in mid-December) or 1st of September (sell lambs at 44 kg in mid-January) was modelled for the Merino x Terminal enterprise run on the Triple system at Hamilton (Warn 2011). This study showed that while lucerne in the Triple system extended the growing season compared to a Perennial Ryegrass only system, it could not do this in enough years (when 30% of the farm area was lucerne) to warrant a change in the time of lambing and allow enough finishing feed for lambs. In only about 60 per cent of the years was the growing season able to extend into January and 30% into February, with sufficient levels of feed on offer to finish lambs. Therefore, like in the Perennial Ryegrass system, July lambing was most profitable when selling older finished lambs with higher sale weights – even though there were slightly less ewes run per hectare (reducing wool income). So, strategically, this study found it was less risky to follow the time of lambing guidelines proposed by Warn 2006 and then take advantage of extra turnoff weights in the wet summer seasons. Under these circumstances gross margin per hectare could be increased through extra lamb weight and income per hectare.
Cattle systems for optimising production from pastures
Increasing Stocking Rate
For cattle systems, the principles for increasing stocking rate and pasture utilisation are similar to those for sheep systems. As stocking rate is increased, Gross Margins and Gross Margin variability increase until supplementary feeding increases to the point where Gross Margins begin to decline and environmental degradation risk increases.
Time of Calving
The optimal time of calving for a given region and cow-calf production system is more difficult to determine than for sheep systems as it is very dependent on the market targeted for the beef weaners/steers and is also strongly affected by the extended lactation of cows, where there is a high feed demand for six to seven months compared to three to four months for ewe-lamb systems. It is therefore more difficult to match feed supply and demand for cows and their offspring than for ewes and lambs.
Benchmarking studies have often shown spring calving as being more profitable than autumn calving (Lean 2005). However, modelling studies in south-west Victoria using results from the Beef CRC (Graham et al, 2009) ($361/ha autumn calving vs $358/ha spring calving) or from GrassGro modelling evaluating the impacts of climate change (Corrigan, 2012 ) ($252/ha autumn calving vs $267/ha spring calving) have shown little difference between the two systems of beef production. The reason for this is that while the autumn calving systems have increased supplementary feed requirements for calving cows, spring calving systems have increased feed requirements for young stock. It is worth noting that in the climate change study, spring born calves were taken through a second spring before being sold, while in the CRC study, ages and sale weights were similar for both autumn and spring born calves.
Figures 6-7 show the feed demand and feed supply for a self-replacing Angus cow herd near Hamilton. For the March calving herd, weaner calves were sold in December at nine months of age. For the August calving cows, calves were weaned, grown on and sold in December at 16 months of age. The green and orange lines show the total feed on offer and green feed on offer respectively while the feed demand for different classes of stock on the farm (mature cows, two year old cows, unweaned calves, replacement heifers) is shown in the bars along the bottom of the graph.
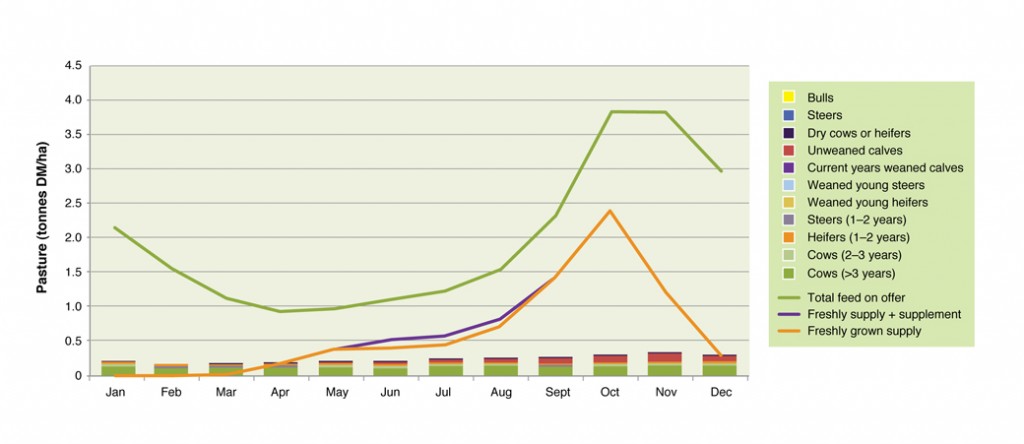
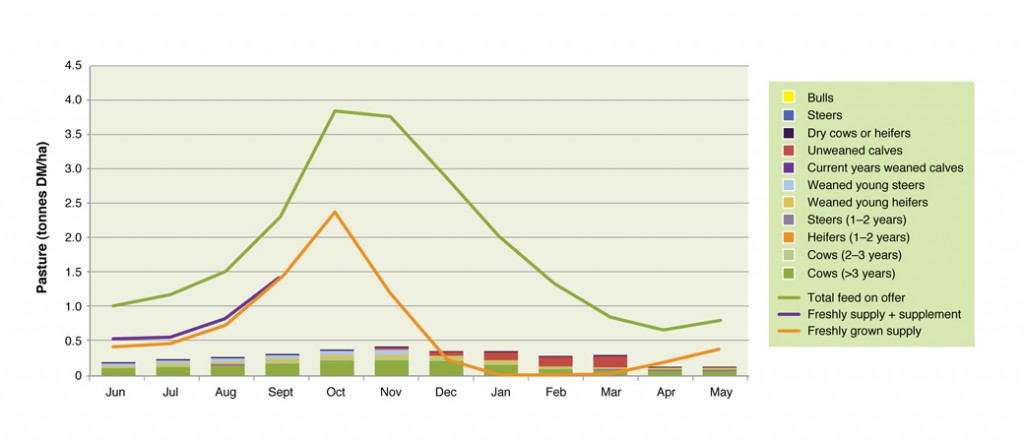
The pasture utilisation is greater for the spring calving cows but this is due to keeping the calves through a second spring. Effectively in spring, there are two groups of calves to eat the pasture whereas for the autumn calving herd, it is difficult to use the spring flush. It is important to note that the same level of pasture utilisation can be achieved for the autumn calving herd if store cattle are purchased or agisted in the August-December period.
Steer and heifer back-grounding
Very high rates of pasture production and liveweight gain per hectare can be achieved in back-grounding systems by matching stocking rates to pasture supply and ensuring sufficient feed on offer for high liveweight gains. Again, matching the period of back-grounding to the growing season of the pasture will optimise this type of enterprise. Results from the Hamilton Proof Site indicated that liveweight gain per day was critical to liveweight gain per hectare.
Changing pasture supply – growth and distribution
For both cattle and sheep systems, increasing pasture growth in autumn and winter can significantly improve the carrying capacity of the farm. Modelling of sheep systems has shown that feed produced at this time of year is of highest value for increasing profit.
Summer feed is also important and modelling of the addition of lucerne to beef and sheep systems shows increased profitability through opportunities to increase stocking rate, alter time of lambing/calving or through a reduction in supplementary feeding in autumn. Sheep systems can also gain through improvements in reproductive performance by flushing ewes on lucerne.
The advantages of including summer active perennials in EverGraze sheep systems are discussed extensively on the following pages:
- Lucerne reduces risk, provides options for livestock and prevents salinity (Hamilton EverGraze Proof Site)
- More lucerne increases production and profit (Wagga Wagga EverGraze Proof Site)
- Perennials provide outside growing season green feed (Albany EverGraze Proof Site)
- Perennials for finishing lambs (Albany EverGraze Proof Site)
For cattle, results from the Hamilton EverGraze Proof Site for a spring calving cow calf system showed that availability of summer active pastures during summer increased cow liveweight and ultimately birth weight and weaning weight of calves.
Conclusions
Increasing the productivity and profitability of livestock enterprises is about optimising pasture utilisation and reducing supplementary feed costs whilst managing and limiting potential negative effects of high stocking rates on feed on offer and ground cover. Optimisation also requires the adjustment of time of lambing/calving against desired turn off weights and the pasture supply/demand curve for the livestock system. Increasing reproduction can also increase production per hectare but management of nutrition must be adequate to support the increased survival and performance of offspring from such a strategy. The individual results of EverGraze Proof Sites (Hamilton , Wagga Wagga and Albany) should be consulted for further environment and region specific information.
Authors
Kate Sargeant, formerlly Agriculture Victoria, Benalla
Geoff Saul, Productive Sustainable Agricultural Services, Port Fairy, Victoria
Ralph Behrendt, Agriculture Victoria, Hamilton
Michael Friend, Charles Sturt University, Wagga Wagga, NSW
Paul Sanford, Department of Agriculture and Food, Albany, Western Australia
Further Information
- EverGraze Exchange – Making on-farm strategic changes
- Hamilton EverGraze research message: Sheep systems for maximising profit from perennials at Hamilton EverGraze Proof Site
- Wagga Wagga EverGraze research message – Flexibility in livestock systems is important for risk management in variable climates
- Albany EverGraze research message: Adding up to 25% perennials will give the highest gross margin
- Orange EverGraze research message: The effect of grazing intensity on production and profit from native pastures
- Warn L, Webb Ware J, Salmon L, Donnelly J, Alcock D (2006). Analysis of the profitability of sheep wool and meat enterprises in southern Australia. Final Report for Project 1.2.6. Sheep Co-operative Research Centre.
- Young (2004) MIDAS modelling for Hamilton EverGraze Proof Site
- Young (2010) MIDAS modelling of the Hamilton EverGraze Proof Site
- Warn L (2012) Hamilton EverGraze Proof Site: Report on the impact of changing management regimes on profitability
- Young, Bathgate A, Sanford P (2004) MIDAS insights on profitability utilising perennial plants on the south coast of WA.
- Sanford P (2013) EverGraze Tactical Management Regimes: GrassGro Simulations Albany
- Robertson S (2012) EverGraze: Tactical Management Regimes Report on Simulation Modelling at Wagga Wagga
- Graham J, Quinn H, Davies B, Griffith G (2009) Economics of alternative growth path, time of calving and breed type combinations across southern Australian beef cattle environments: grass finishing at the Victorian experimental site. Australian Farm Business Journal, 6 (1), 17-26.
- Saul G and Kearney G (2002), Potential carrying capacity of grazed pastures in southern Australia, Wool Technology and Sheep Breeding 50 (3), 492-498
- Dunstan (2012), Profitable Livestock Systems 2. Lamb Case Study Lismore Vic
- Corrigan (2012), Profitable Livestock Systems 2. Beef Case Study Penshurst Vic
