East Gippsland – Livestock systems and industry benchmarks
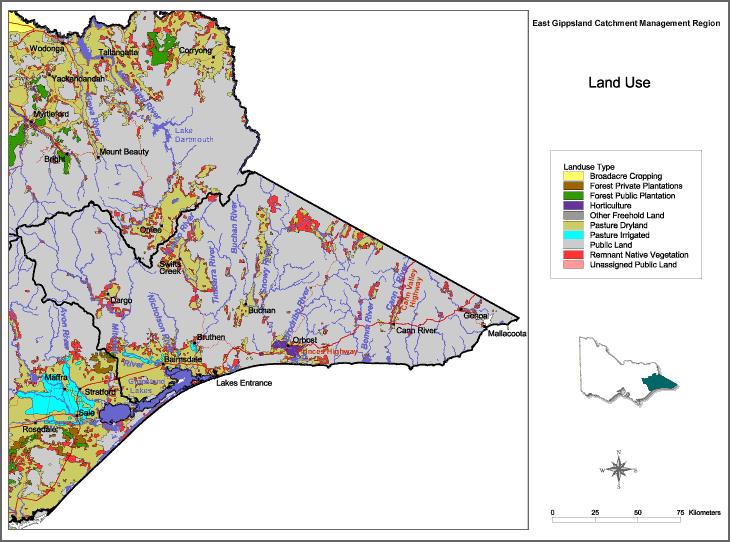
The majority of arable land in the East Gippsland region is dryland pastures used for the production of beef, lamb and wool (Figure 1). There are small pockets of rich alluvial valleys with irrigation that are utilized for horticulture and dairy.
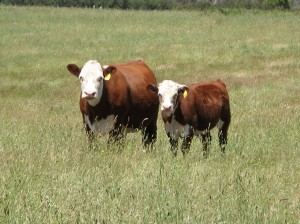
The majority of beef enterprises have breeding stock that produce weaners. Finished cattle are hard to produce due to the high variability in the seasons and pasture growth. Herds have traditionally calved in Autumn to have weaner cattle ready for the autumn weaner sales. However there are also many herds now turning towards a late winter calving to take advantage of the spring flush for both calf growth and increased joining rates of cows.
Sheep enterprises are a mixture of merino wool operations and prime lamb operations with winter lambing being the most common lambing time.
Key livestock issues in East Gippsland
Low feed quality in late spring and summer limits finishing ability
Variability in rainfall from late spring and summer across East Gippsland presents challenges as well as opportunities for livestock producers seeking to maintain minimum growth rates and condition in young stock for market or joining as well as for silage or hay-making activities.
October rainfall on average tends to be less reliable than November, which on average is the wettest month of the year. Producers need to have lucerne, silage or other supplements on hand in order to finish animals from October onwards, should rainfall be below levels to maintain quality into mid-late December when temperatures normally start to rise, resulting in more rapid curing of pasture.
Unreliable autumn breaks increases feeding costs
High variability and distribution of annual rainfall in East Gippsland means there really isn’t such a thing as an autumn break. Producers attempting to maintain growth rates in ewes and heifers in order to reach satisfactory joining weight/condition have to be prepared for less than average rainfall for extended periods. Supplementary feeding is often required to ensure nutritional requirements are met during critical periods in the production cycle.
Winter feed availability
Quantity of feed available in winter is often limiting. Although what is available is often of high value, generally the cold conditions limit the quantity of feed grown. This creates a large feed gap that needs to be filled. Autumn calving enterprises can struggle with conception rates if cattle are not fed to maintain correct condition for joining in winter especially if it follows a failed Autumn break and cows are in poor condition at calving. Condition of ewes at lambing is difficult to maintain when feed is limiting and can result in poor weaning percentages.
Limits to stocking rates
The above issues of feed availability in winter and unpredictable seasons limit the pasture growth through the season as well as the type of pastures that can be grown through the region. The result is that majority of farms run low stocking rates with the average stocking rate of participants in the 2012 Victorian Livestock Farm Monitor Project being 13 DSE per hectare. It could also be argued that the average stocking rate for the region falls well below this figure because even average farmers in the farm monitor program are likely to be ahead of the average of the district.
Lamb Survival
Research conducted nationally indicates that seventy percent of lamb mortality between birth and marking occurs within the first 48 hours after birth. The majority of these deaths are due to the starvation, mismothering, exposure (SME) complex. Key factors influencing lamb survival include the weight of the lamb at birth and the degree of wind-chill in the first three days after birth. The birth weight of the lambs is impacted by ewe condition and feeding during pregnancy.
In Gippsland survival rates of new born lambs can be severely reduced during winter and early spring. Ewe condition and lamb birth weights are often affected by low winter feed availability, lambing into bare paddocks with little shelter also increases the risk of exposure for lambs. On average, sustained periods (>3 days) of lethal sheep chill are not common. Research at Hamilton and Wagga show the benefits of improving shelter in different environments. The high risk months for sheep chill are July to September.
Predation – wild dogs
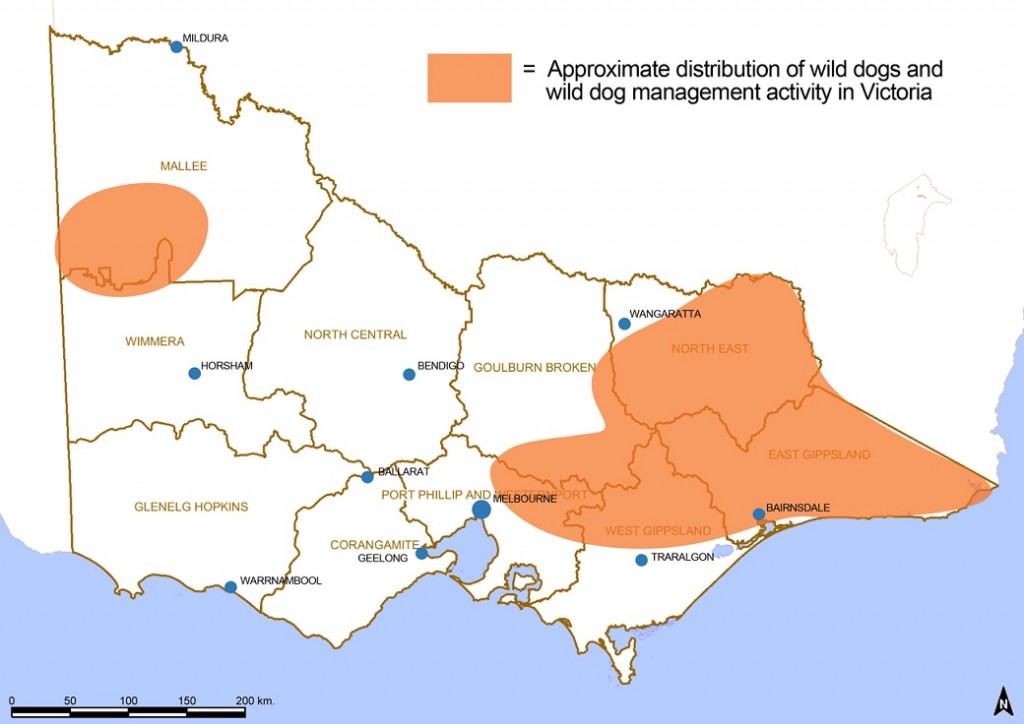
Wild Dogs are a high priority pest animal in Gippsland (Figure 2) and are declared ‘Established Pest Animals’ under state legislation. Wild dogs are generally distributed throughout forested areas of the Gippsland region, much of which is public land. In Gippsland wild dogs occur on public and private land, on coastal sand dune country to the high forested alpine country.
The economic and social impacts of wild dogs are well understood, with the major concern of landholders being losses in agricultural production through predation of livestock, mainly sheep but also cattle.
In additional to killing sheep, wild dog attacks reduce flock performance by reducing lambing percentages, the condition the flock and tenderness of wool.
Other impacts include a decline in farming profitability, particularly where enterprises have shifted from sheep to cattle.
East Gippsland Industry benchmarks
The data presented below is taken from the 2010/11 Livestock Farm Monitor Project that is available from the Agriculture Victoria website. Commentary is provided to put the results in context with other data and indicate what this means for your farm. Of the 35 in the survey, 12 were located in South Gippsland with the balance being located in East Gippsland. Farms cover the area from Warragul, Tarwin Lower, Woodside, Omeo and Orbost. Ranges for the farms are presented in Table 1.
Benchmarks should always be interpreted in the context of the data collected, and when comparing your own situation to the benchmarks, consideration should be given to variables such as climate, soils and enterprise setup.
Table 1. Range and average of farm area and livestock numbers in Gippsland
| Number of ha | Number of sheep | Number of cattle | Crop (ha) | |
| Range | 86 – 4,837 | 416 – 10,128 | 29 – 3,134 | 24 – 523 |
| Average | 880 | 3,323 | 552 | 40 |
Whole farm analysis
Table 2 presents a whole farm analysis of farms in the Gippsland section of the Livestock Farm Monitor Project. According to the analysis, the most profitable (top 20%) farms:
- Apply more P fertiliser
- Run a higher stocking rate (over 2.5 DSE/ha/100 mm rainfall) and still achieve at least the same per head production as lower stocked properties
- Achieve higher prices per kg wool or meat sold
- Spend more ($/ha) on pastures
- Run more stock per labour unit
- Have a larger exposure to prime lamb production (either as 1st or 2nd cross) rather than wool
Table 2. Comparison of average and top 20% of Gippsland farms (ranked on operating profit, $/ha) (35 Farms)
| Farm parameter | Average | Top 20% | |
| Area; ha | 691 | 558 | |
| Annual rainfall; 2010/2011 mm | 654 | 738 | |
| Stocking rate; DSE/ha | 13 | 18.1 | |
| Stocking rate; DSE/ha/100 mm rainfall | 2 | 2.5 | |
| Labour efficiency; DSE/labour unit | 5,259 | 68,886 | |
| Phosphorus application; kg P/ha | 6.1 | 10.7 | |
| Enterprise mix | Wool sheep % | 25 | 14 |
| Prime lambs% | 19 | 36 | |
| Cattle % | 53 | 49 | |
| Cropping % | 3 | 0 | |
Enterprise analysis
Wool sheep (self-replacing Merinos)
More profitable wool producing operations run a higher stocking rate, achieve the same production per head but with greater value for product sold which leads to higher profitability per head (Table 3). There is only a small difference in reproductive performance between the average and top 20%.
Table 3. Comparison of average and top 20% of Gippsland farms for wool sheep (self-replacing merinos) (35 farms)
| Farm parameter | Average | Top 20% |
| Stocking rate; DSE/ha | 11.1 | 13.2 |
| Marking; % | 73 | 77 |
| Wool; kg clean/head | 3.6 | 3.6 |
| Wool; kg clean/ha | 24.9 | 28.4 |
| Fibre diameter; micron | 18.6 | 18.3 |
| Net wool price; $/kg clean | $10.01 | $10.62 |
| Sheep sale price; $/head | $50 | $54 |
| Pasture costs; $/ha, ($/DSE) | $38 | $40 |
| Supplementary feed; $/ha, ($/DSE) | $42 | $53 |
| Animal health; $/ha, ($/DSE) | $19 | $22 |
| Gross Margin; $/DSE | $16 | $23 |
| Gross Margin; $/ha | $172 | $313 |
Prime lamb (merino, crossbred and composite ewes)
As for wool sheep, more profitable operations run a higher stocking rate, achieve the same production per head but with greater value for product sold which leads to higher profitability per head (Table 4). Greater emphasis is also placed on marking percentage. More profitable prime lamb enterprises spend more on pastures.
Table 4.Comparison of average and top 20% of Gippsland farms for prime lambs (35 farms)
| Farm parameter | Average | Top 20% |
| Stocking rate; DSE/ha | 15.1 | 19.9 |
| Marking; % | 102 | 113 |
| Lamb production; kg carcass weight/ha | 125 | 205 |
| Wool; kg/ha | 31 | 39 |
| Net wool price; $/kg clean | $3.95 | $3.44 |
| Average lamb price; $/kg carcass weight | $4.72 | $5.04 |
| Pasture costs; $/ha, ($/DSE) | $85 | $98 |
| Supplementary feed; $/ha, ($/DSE) | $33 | $34 |
| Animal health; $/ha, ($/DSE) | $27 | $33 |
| Gross Margin; $/DSE | $25 | $35 |
| Gross Margin; $/ha | $403 | $708 |
Beef Cattle
There was a mixture of spring and autumn calvers as well as traders in the beef dataset. As for other enterprises, higher profit was linked to higher stocking rate combined with higher sale prices and greater spending on pastures and supplements (Table 5). Beef production (kg/ha) is much higher in the top 20% due to higher stocking rates and this is combined with higher price received per kg of liveweight.
Table 5. Comparison of average and top 20% of Gippsland beef farms (35 farms)
| Farm parameter | Average | Top 20% |
| Stocking rate; DSE/ha | 15.5 | 23.1 |
| Marking; % | 89% | 89% |
| Beef production; kg liveweight/ha | 294 | 458 |
| Average sale price; $/kg liveweight | $1.72 | $1.92 |
| Pasture costs; $/ha ($/DSE) | $76 | $124 |
| Supplementary feed; $/ha, ($/DSE) | $29 | $29 |
| Animal health costs; $/ha, ($/DSE) | $18 | $33 |
| Gross Margin; $/DSE | $21 | $29 |
| Gross Margin; $/ha | $42 | $75 |
