Central Tablelands NSW – Climate
Rainfall
Annual averages and distribution
The Central Tablelands is a key livestock production area. Broadly located in the Upper Lachlan, Lachlan Slopes, Upper Macquarie and Mid Macquarie sub catchments, this region is often referred to as the High Rainfall Zone (HRZ), has a more-or-less uniform year-round rainfall distribution and an average annual rainfall of more than 600mm. Rainfall varies from 619 mm at Wellington to 867mm at Orange and up to 1000 mm at higher altitudes (Figure 1). The average annual rainfall at the Orange EverGraze Proof Site (located at Panuara) is 809 mm.
In summer, evaporation exceeds rainfall, reducing pasture growth and this is magnified at lower altitude where rainfall is lower and temperatures higher. In winter rainfall exceeds evaporation, but cooler temperatures slow pasture growth and this impact is greater at the higher altitudes.
|
|
Variability
Average rainfall figures are useful in explaining general limits on pasture production and livestock enterprise limitations but there is considerable variation from the average both between and within years. Because rainfall is the biggest driver of pasture production, it represents the most important climatic risk which producers need to understand and manage for. Pasture systems established and the accompanying management strategies need to reflect this potential variation as do the animal systems applied to them. While rainfall patterns in a district will follow a long term trend there is usually little relationship between rainfall received in one year and the next or even between autumn and spring. Variation in the amount of rainfall is only one aspect to consider, when it falls is also crucial. Autumn rainfall has a large effect on grazing systems due to its effect on feed availability in winter. Tools such as RainmanTM can help producers explore seasonal variation and when autumn breaks occur using localised weather data and may be useful for farm planning decisions. For long term planning, producers and advisers would be wise to seek out appropriate information and training on the predicted outcomes of climate change to make informed decisions.
A full set of seasonal rainfall figures for Mudgee, Orange and Wellington in the NSW Central Tablelands is available here. Figure 2 shows the trends for Orange.
|
|
|
|
|
|
| Figure 2. Annual, autumn, spring and summer rainfall variation at Orange (Graphs courtesy of DEPI Victoria) | |
Temperature
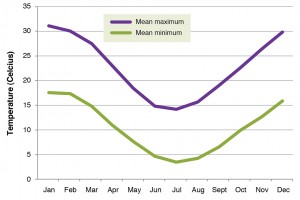
Temperature is a key driver of plant growth and development and small changes in temperature can translate to significant growth and water use differences. Extremes of temperature will not only impact on plants but can also affect livestock.
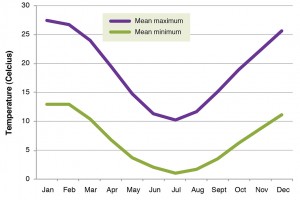
The climate around the Central Tablelands is strongly influenced by topography and the movement of cold air. During the cooler months, cooler air drops into the valleys and the concentration of this colder air increases the number of frosts in some areas. The frost period ranges from five to eight months of the year, significantly impacting pasture growth. The Central Tablelands is renowned for their mild summers and cool winters with snow falling in most years, increasing in frequency as elevation increases. There is a strong association between altitude and temperature. Figures 3 and 4 show the differences in maximum and minimum temperatures for Wellington and Orange. These towns are only 100 kilometers apart but with a difference in elevation of 617m, there are significant temperature differences over the entire season.
|
|
|
Long term temperature data available for Mudgee and Orange can be used to highlight the potential variation in maximum and minimum temperatures that are experienced in the region. Like rainfall, temperatures also vary from season to season. While the spread of results is not as big as that experienced with rainfall, it should be noted that a small variation in temperature has a big impact on water use and plant growth. Figure 5 shows the 1910-2012 trends for Orange. There is an interesting trend in Orange with increasing annual minimum temperatures. This may result in more favourable conditions for winter pasture growth. However, this data with its limited range of years, can in no way be used to demonstrate any shift in climatic conditions.
|
|
|
| Figure 5. Average maximum and minimum annual temperature at Orange (Graph courtesy of DEPI Victoria) | |