North West Slopes NSW – Climate
Rainfall
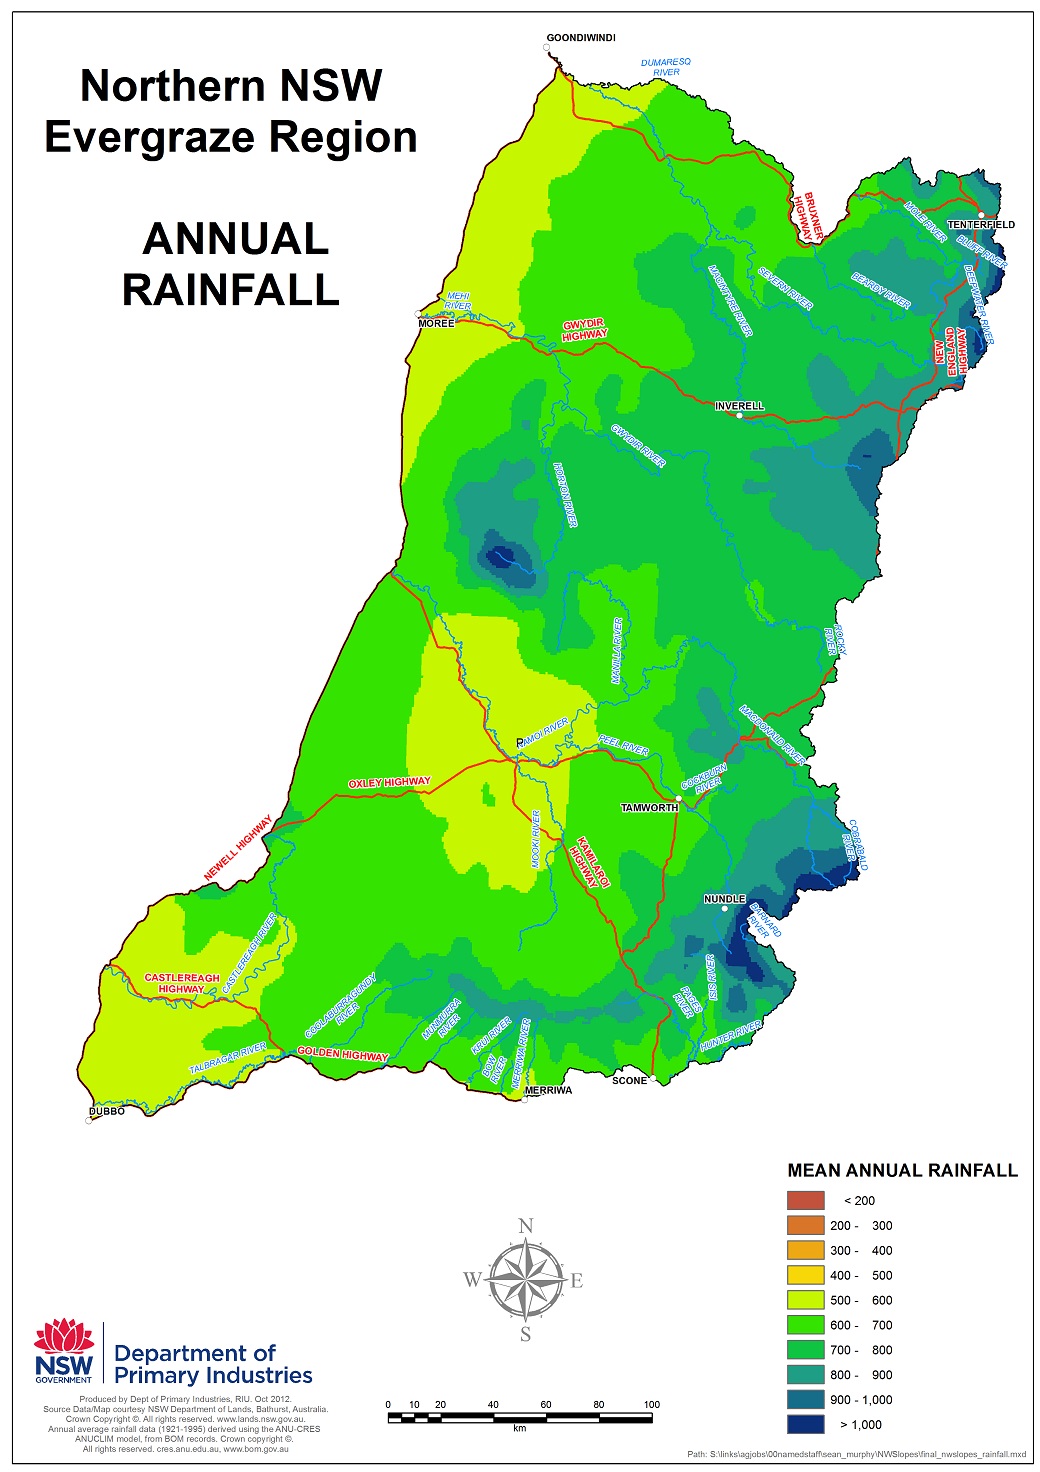
Geographical distribution
Rainfall is highest in the eastern escarpment becoming progressively lower towards the west and with declining elevation (Figure 1). The area is bisected by the 650 mm average annual rainfall isohyet, although rainfall is variable declining from >800 mm/year in the east to <500 mm/year in the west (Figure 1).
|
|
Pattern
Climatically, the area can be classified as sub-humid with a summer dominant rainfall distribution. The wettest months are December and January (Armidale January rainfall is 104 mm) and the driest, April, May or August (Tamworth April rainfall is 40 mm, Figure 2). Sixty-percent of rain falls from November to March, mainly as high intensity thunderstorms. With high evaporation rates in summer and large losses of water as a result of surface runoff, rainfall effectiveness is low.
Table 1. Mean monthly and total annual rainfall for major centres in the Northern NSW EverGraze region.
| Centre | Jan | Feb | Mar | Apr | May | Jun | Jul | Aug | Sep | Oct | Nov | Dec | Total |
| Tablelands | |||||||||||||
| Armidale | 104 | 86 | 65 | 44 | 43 | 53 | 48 | 48 | 52 | 67 | 82 | 88 | 780 |
| Bendemeer | 102 | 76 | 60 | 44 | 51 | 62 | 58 | 60 | 59 | 77 | 81 | 85 | 819 |
| Slopes | |||||||||||||
| Tamworth | 85 | 66 | 49 | 40 | 42 | 50 | 47 | 44 | 47 | 59 | 70 | 77 | 676 |
| Manilla | 86 | 67 | 54 | 39 | 41 | 44 | 42 | 39 | 41 | 58 | 66 | 74 | 651 |
| Barraba | 89 | 76 | 55 | 40 | 43 | 46 | 45 | 40 | 44 | 63 | 73 | 78 | 692 |
| Bingara | 92 | 90 | 63 | 42 | 50 | 50 | 52 | 45 | 46 | 67 | 69 | 78 | 743 |
| Yetman | 85 | 77 | 58 | 38 | 43 | 43 | 44 | 38 | 38 | 57 | 65 | 71 | 657 |
| Plains | |||||||||||||
| Gunnedah | 72 | 68 | 48 | 38 | 42 | 44 | 43 | 42 | 41 | 55 | 62 | 70 | 623 |
| Narrabri | 83 | 64 | 58 | 40 | 49 | 47 | 45 | 41 | 41 | 53 | 59 | 66 | 644 |
| Moree | 72 | 68 | 58 | 33 | 40 | 40 | 41 | 34 | 34 | 48 | 56 | 58 | 582 |
| Dubbo | 62 | 53 | 48 | 44 | 47 | 50 | 44 | 44 | 43 | 49 | 52 | 50 | 584 |
Seasonal variability
Average rainfall values are useful for explaining the general limits on pasture production and livestock enterprises but variability of rainfall both between seasons and years is a key feature of this region. Production levels in rain-fed pasture systems are directly correlated with the timing and amount of available soil water and the efficiency of its use. Therefore, rainfall variability is a fundamental risk, which producers need to understand and include in their management.
Long-term annual rainfall data show that the first half of the 20th Century (1900-1949) in most of eastern Australia was drier compared with the second half (1950-1999). Analyses of short and long term monthly and annual rainfall data for sites in Northern NSW (Warialda, Barraba, and Tamworth) indicated that since 2000, rainfall in Autumn has been substantially lower, and Spring-early Summer has been substantially wetter compared with the long-term mean (Figure 3). The dry Autumn periods were similar to that in the 1900–49 pattern, while the wetter periods were more representative of the 1950–99 climate (Figure 3). These abnormal weather patterns have profound implications for livestock production, since adequate May rainfall is required for the germination and growth of annual, winter-growing legumes and late sown cereal forage crops and November to December is a critical period for sowing and establishing tropical perennial grass pastures and the growth of summer-growing native perennial grasses.
Pasture systems and their accompanying management strategies need to reflect this potential variation as do the animal systems applied to them. Tools such as RainmanTM can help producers explore seasonal variation and may be useful for farm planning decisions. For long term planning, producers and advisers would be wise to seek out appropriate information and training on the predicted outcomes of climate change to make informed decisions.
Graphs for seasonal rainfall are available for Tamworth, Armidale and Gunnedah.
 |
 |
 |
 |
|
Figure 3. Variation in seasonal rainfall for Tamworth, Northern NSW for 1889-2009 (Graphs courtesy of Vic DEPI). |
|
Temperature
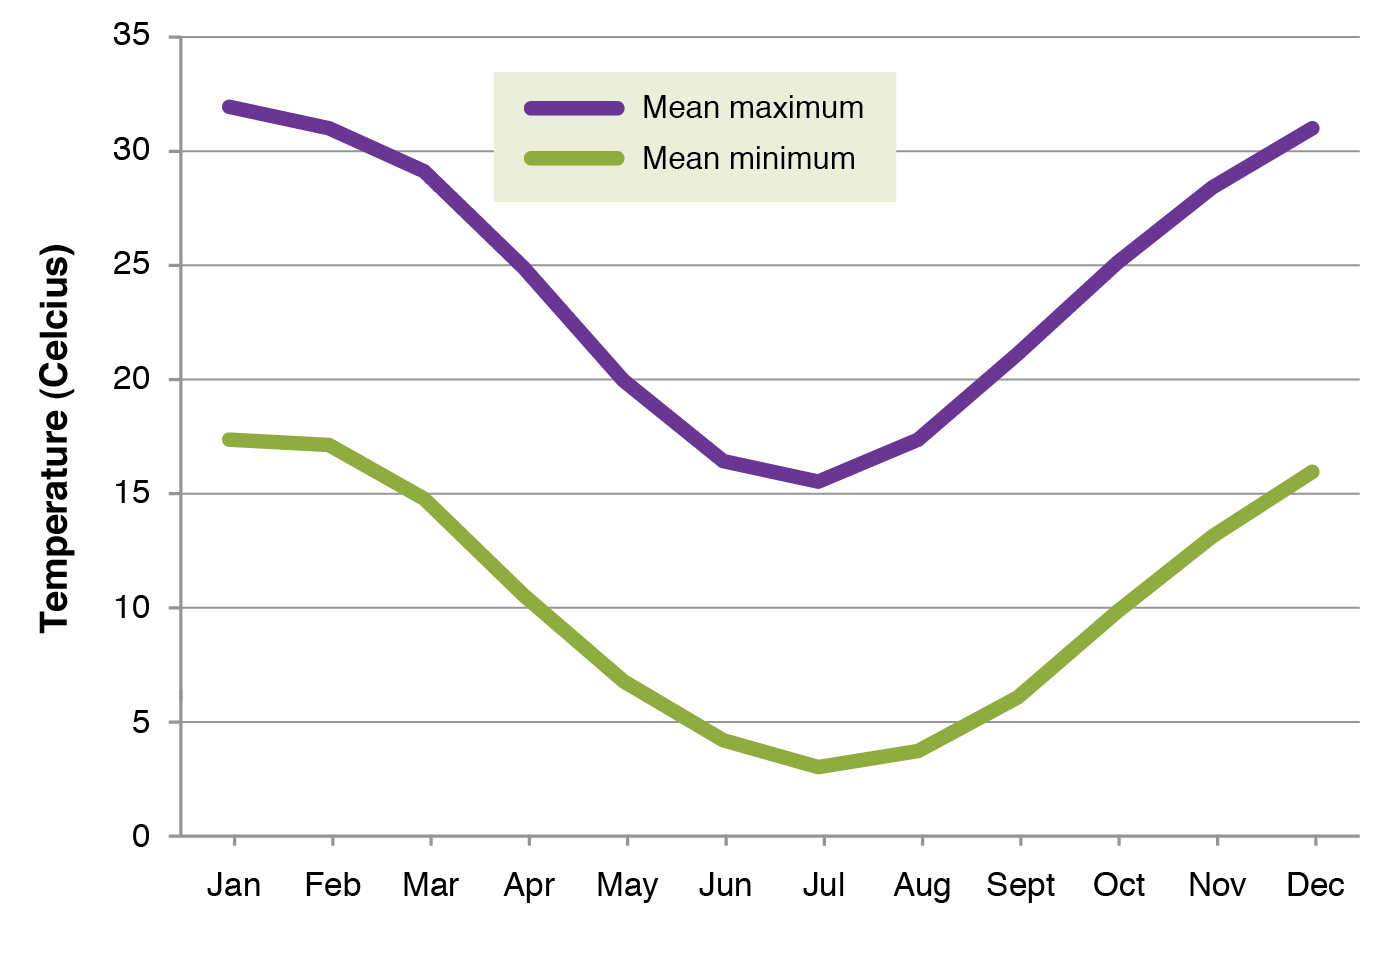
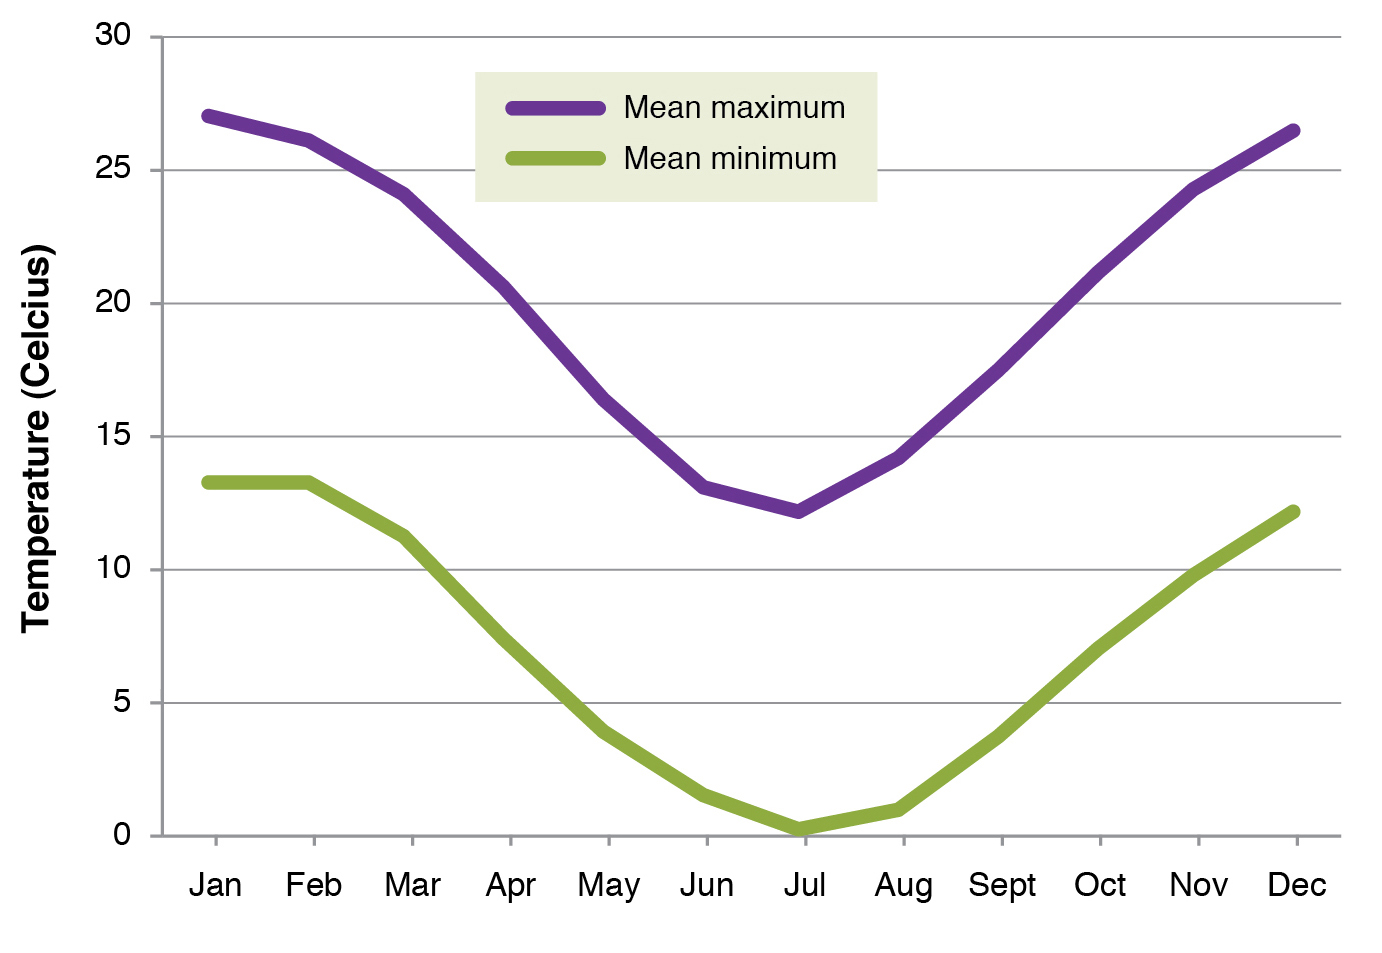
Frosts occur throughout the region from mid-April to September, with the mean daily minimum temperature <0°C in July for the higher elevations on the Slopes and Tablelands, and ranging up to about 6°C at lower elevations (Figures 4 and 5). January mean daily minimum temperatures range from about 12°C to 22°C. Mean daily maximum temperatures in January range from 34°C in the west to 26°C on the Tablelands and from 16 to 12°C in July. Although soil moisture may be limiting, high summer temperatures and rainfall generally provide good conditions for the growth of the warm-season native perennial grasses, the main species of the native and natural pastures in the region. Grasses continue to grow until autumn when decreasing temperatures and frost slow their growth.
Few sites that have reliable long term temperature data are available for this region which presents a few challenges when trying to understand long-term climate interactions. Two good data sets are from Gunnedah and Inverell, which span 100 years and these data can be used to highlight the variability between years of mean maximum and minimum temperatures in the region. While variation does not appear to be large, it should be noted that a small variation in temperature can have a big impact on water use and plant growth. The trends in these data are broadly associated with the variation in annual rainfall over the same period, with higher maximum temperatures associated with drier conditions, and higher minimum temperatures associated with wetter conditions seen in the first and second half of last century, respectively.
|
|
|
Evaporation
Evaporation is high in summer and it also increases westward ranging in January from 150 mm in the east, up to about 200 mm in the west. Winter values are considerably lower: about 40 mm in the east in July and 45 mm in the west. Another way of comparing moisture availability is to use the average seasonal moisture index. This index relates potential plant growth to moisture availability after taking into account rainfall, evaporation and soil moisture, with indices ranging from 1, where moisture supply is non-limiting for growth, to zero. Values for the average seasonal moisture index are about 0.8 in the eastern part of the region for both summer and winter, whilst in the west they range from 0.6 in winter to 0.4 in summer. Hence, soil water availability for plant growth is about equal in both summer and winter on the Tablelands, while on the Slopes the probability of soil water being available is slightly higher in winter than in summer.
