Broadford Grazing Experiment
Download the Broadford Grazing Experiment presentation
Summary
A grazing experiment conducted by the Agriculture Victoria from 1994-2003 in north-eastern Victoria demonstrated the benefits of rotational grazing and appropriate fertiliser use on both profitability and sustainability. Correcting soil phosphorus deficiencies had a bigger impact on improving pasture growth than changing grazing method. However, rotationally grazing the pasture instead of continuous grazing allowed stock carrying capacity to be increased by up to 20 per cent while simultaneously improving persistence of phalaris. Other benefits included less broadleaf weeds, more ground cover over summer and autumn, reduced drought feeding costs, drier soil profiles, reduction of sheep camps, and lower maintenance rates of phosphorus fertiliser.

What was done
In 1994, an experiment to compare the effect of two rates of phosphate (P) fertiliser [high (H) and low (L)] and tactical rests on persistence of phalaris and cocksfoot were established at Broadford. The experiment was expanded in 1998 to determine the effect of three different grazing methods under the high and low phosphorous applications on stocking rate and wool production. Each treatment was replicated – three replications for low phosphorus (LP), four replications for high phosphorus (HP) – to give 21 paddocks of 0.65 ha.
The site
- Sedimentary hill country.
- Climate – Mediterranean. Average temperatures – January: 29°C max/13°C min, June: 13.8°C max/3.8°C min.
- Pasture sown to Sirosa phalaris/Porto cocksfoot/Trikkala subclover in 1987.
- Originally one paddock. Divided into 0.65 ha plots in 1994.
- The long-term annual rainfall for the district is 625 mm. Throughout the experiment, three low rainfall years were experienced – 1994, 1997 and 2002 (Table 1).
Table 1. Annual rainfall
| Year | 1994 | 1995 | 1996 | 1997 | 1998 | 1999 | 2000 | 2001 | 2002 |
| Rainfall (mm/yr) | 390 | 654 | 737 | 391 | 540 | 629 | 716 | 461 | 305 |
Grazing treatments
From 1998 to 2003, three grazing methods were compared. Each treatment was grazed with Merino wethers. Wethers were shorn in spring. Minimal supplementary feeding was required on any treatment until the drought in 2002-2003.
Continuous grazing
Sheep had access to the whole plot, all of the time. Continuous hard grazing favored sub clover and broadleaf weeds over the grasses. These plots had small phalaris plants, large sheep camps and were very bare each autumn.

Simple time-based rotation (four paddocks)
Each permanently divided paddock was grazed for two weeks and rested for six weeks, except in spring, when the rotation sped up to one week grazing and three weeks rest. This allowed the phalaris to increase in size but broadleaf weeds and stock camps were still obvious. This treatment carried up to 10 per cent more stock than Continuous grazing but only in the HP treatment.

Intensive rotation based on phalaris leaf stage (20 paddocks)
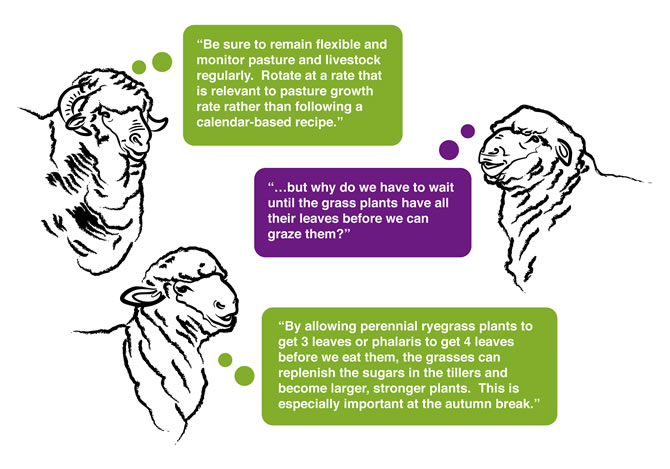
Plots had a maximum of 20 paddocks divided by electric fencing. Pasture rest periods were adjusted according to pasture recovery rates. The speed of the rotation aimed to allow phalaris plants to regrow to the four-leaf stage before grazing, thereby allowing the plant to replenish carbohydrate stores (see Grazing Management On-Farm Options for an further details of these principles).
The rest period varied from 20 days in spring, to 70 days in summer (Table 2). Individual paddocks were grazed for a maximum of 3-4 days throughout the year.
Table 2. Rest intervals in the Intensive rotation treatment at Broadford
| Summer | Autumn | Winter | Spring |
| 70 days | 30-50 days | 40-60 days | 20 days |
Grazing according to phalaris leaf stage dramatically improved the size of the phalaris plants, and the amount of ground cover. There were virtually no broadleaf weeds or stock camps, and up to 20 per cent more stock could be carried compared with Continuous grazing under both LP and HP.

Fertiliser treatments
Annual fertiliser applications (1994-2000) were:
- Low P (LP) – 6 kg P/ha (70 kg/ha single Superphosphate)
- High P (HP) – 25 kg P/ha (270 kg/ha single Superphosphate)
After 2000, applications of 6 kg P/ha/year continued to be applied to low P plots, while high P plots received a maintenance rate of 10 kg P/ha/year (based on 0.6 kg P/DSE/ha for the Continuous grazed plots). Average top-soil fertility for the site is presented in Table 3.
Table 3. Soil fertility of the topsoil and subsoil at the Broadford Grazing Experiment site
| Topsoil (0-10 cm) | 1994 | 2001* |
| Olsen Phosphorus ( mg/kg) | 4 | 6 (LP) |
| 13 (HP) | ||
| CPC Sulphur (mg/kg) | 2.2 | 8.7 |
| Skene Potassium (mg/kg) | 157 | 181 |
| Organic carbon (%) | – | 2.8 |
| pH (Ca Cl2) | 4.6 | 4.5 |
| Avail. Aluminium CaCl2 (mg/kg) | 1.9 | 4.8 |
| Sub-soil (30-40 cm) | ||
| pH (Ca Cl2) | 5.0 | 4.8 |
| Avail. Aluminium CaCl2 (mg/kg) | <1.0 | 2.2 |
| * Average of all treatments |
What was found?
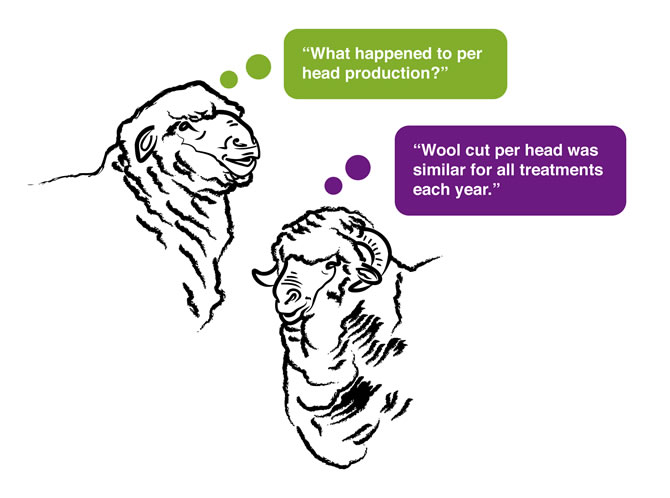
Per head production

Sheep liveweight and fat score were monitored monthly throughout the experiment. Stocking rate adjustments were made, if necessary, primarily in winter with the aim of maintaining similar liveweight across treatments. In years 1 and 2 there were no significant differences in the annual average sheep liveweight between treatments (Table 4). In year 3, average annual liveweight of Continuous grazed sheep was significantly heavier than sheep in both rotations by 1.9 to 2.8 kg. In year 4, the average annual liveweight of Continuous grazed sheep was significantly heavier than Simple rotation sheep, which were heavier than the Intensive rotation sheep. The differences in weights were relatively small (1.5 – 2.8 kg). This trend was due to differences in peak spring weights rather than to differences in minimum weights reached during autumn/winter. Stocking rate was increased on Continuous grazing paddocks in response to these higher liveweights in winter 2000 and 2001 but there was a lag time in evening up sheep weights. In year 5, there was a similar pattern with liveweights between grazing treatments as in year 4, except differences were 3.5 – 6.7 kg. Sheep in Continuous grazing plots were able to make rapid weight gain in spring due to the higher clover content of the heavily grazed Continuous grazed pastures.
Per head wool production, fibre diameter and staple strength were also measured. There were no significant differences in wool cut per head between treatments. Staple strength of wool from sheep in the Intensive rotations (LP and HP) was significantly higher than other grazing treatments in 2000 only.
Table 4. The effect of different grazing methods on average annual liveweight as measured from October (off shears) – September each year.
| Grazing system | |||||
| Year 1 1998 | Year 2 1998/99 | Year 3 1999/2000 | Year 4 *2000/2001 | Year 5 **2001/2002 | |
| Continuous grazed | 51.4 | 58.5 | 64.9 | 54.5 | 59.7 |
| Simple rotation | 51.8 | 58.3 | 63.0 | 53.0 | 56.5 |
| Intensive rotation | 51.7 | 57.1 | 62.1 | 51.7 | 53.0 |
| l.s.d (p =0.05) | 0.8 | 1.4 | 1.7 | 0.9 | 1.7 |
| n.s | n.s | ||||
n.s =not significant
* In 2001, sheep were replaced with a mob of young wethers with finer fibre diameter and lower fleece weights.
** In 2001-2002, stocking rate wasn’t adjusted as other wool fibre profile work was being undertaken. Hence weights across treatments varied the most in that year.
Per hectare production
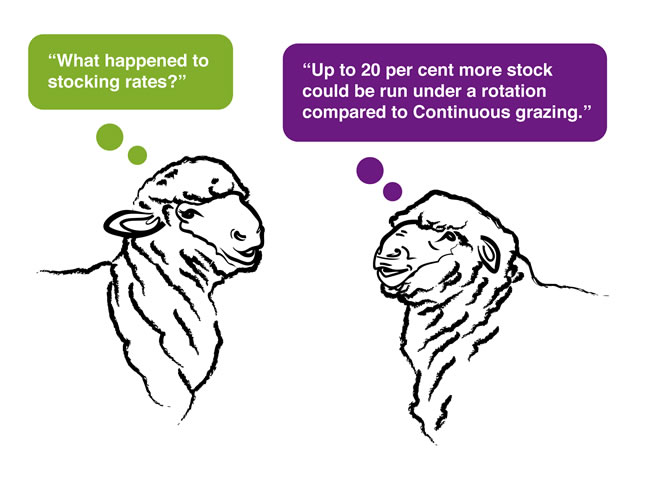
Stocking rates
Stocking rates were adjusted in winter only.
Increases in stocking rate occurred from 1994-1996 in response to both phosphorus rates. Additional stocking rate increases were achieved when the grazing changed from Continuous grazing to either a Simple rotation or Intensive rotation in 1998.
By 2001, the LP Intensive rotation was able to carry 20 per cent more stock than the LP Continuous grazed and LP Simple rotation treatments.
By 2001, the HP Intensive rotation treatment was able to carry 13 per cent more stock than the HP Continuous grazed treatment and 5 per cent more stock than the HP Simple rotation treatment.
HP plots carried significantly more stock than LP in all years except 2002, when stocking rates in all plots were reduced in July to 7.5 wethers/ha. LP Intensive rotation carried significantly more stock than LP Simple and Continuous grazed treatments in all years except 2000. Both HP Simple and Intensive rotations carried significantly more stock than Continuous grazed plots in 1998, 1999 and 2002.
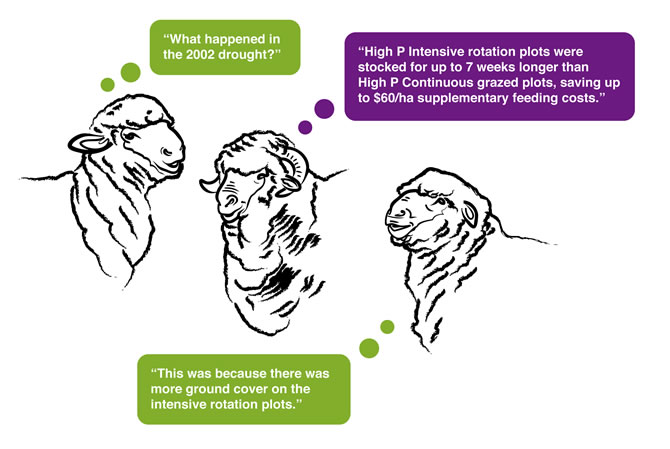
Stocking rates were reduced on all treatments to 7.5 wethers/ha in July 2002 due to a poor autumn break. Continued dry conditions through the year meant stock had to be removed and put in a sacrifice paddock when each plot reached 70% ground cover. The Continuous grazed plots were the first to be destocked from 3/12/2002. By 28/1/03 all plots had been destocked (Table 5).

Table 5. Additional drought feeding costs for Continuous grazing compared to simple and intensive rotations due to earlier destocking
| Additional days sheep off Continuous grazed plots | Additional grain (kg/hd) | Additional cost ($/hd) | Additional cost ($/ha) |
| 31 | 18 | $5.40 | $41 |
Assumptions: Full feeding 570 g/hd/day, 7.5 wethers/ha, $300/tonne grain
Wool production
Increased stocking rates were achieved with fertiliser and grazing management without compromising per head wool production. Therefore, per hectare wool production varied according to the stocking rate in each treatment, and was highest in the HP Intensive rotation treatment (Table 6).
Table 6. The effect of fertiliser application and grazing systems on wool production per hectare
| Greasy wool (kg/ha) | |||||
| 1998 | 1999 | 2000 | 2001 | 2002 | |
| Low P/Continuous grazed | 69 | 67 | 77 | 7 | 83 |
| Low P/Simple rotation | 67 | 69 | 83 | 79 | 88 |
| Low P/Intensive | 70 | 74 | 97 | 92 | 101 |
| High P/Continuous grazed | 95 | 85 | 92 | 94 | 85 |
| High P/ Simple rotation | 96 | 95 | 107 | 98 | 116 |
| High P/Intensive rotation | 99 | 100 | 116 | 102 | 110 |
Crunching the numbers
The extra income and costs from the different combinations of fertiliser and grazing systems have been compared with the scenario of nil fertiliser and continuous grazing. A number of measures have been used to analyse the profitability and feasibility of the different investment options demonstrated at Broadford.
Assumptions
Prices – Average 10 year 21 micron wool prices (2003-2013) used.
Costs – 2013 costs used for shearing, animal health, stock purchases and fertiliser.
Interest rate of 10% used in cash flow analysis.
Gross margins ($/ha)
Gross margin is calculated by adding all the income from the sheep enterprise and subtracting all variable costs associated with that enterprise. It does not include any capital costs.
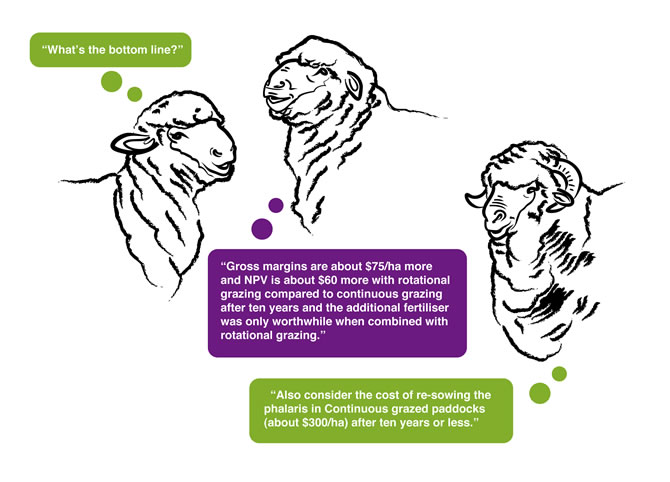
Increasing soil fertility allowed more stock to be run and therefore generated higher gross margins. The peak stocking rate was achieved in 2001 for all treatments. The gross margin for 2001 is shown in Table 7.
At LP, the Intensive rotation had a higher gross margin than both Continuous grazing and the Simple rotation. At LP the stocking rate for the Simple rotation and Continuous grazed treatment were similar.
At HP, the Intensive and Simple rotations both had higher gross margins than the Continuous grazed treatment.
Cumulative cash flow (CCF)
The CCF is addition of annual cash flow over the ten years of the analysis. It includes extra capital required to purchase extra sheep and apply extra fertiliser. Interest on capital has been included.
The impact on cumulative cash flow is shown in Figure 2. Fertiliser treatments started in 1994 in a drought year. The grazing systems were implemented in 1998. 1997 was a dry year and stocking rates were reduced in 2002 due to drought conditions.
All treatments “broke even” with the nil fertiliser scenario by year five or six. Extra fertiliser and stock purchase meant HP treatments had higher peak debt than LP.
By 2002, the HP Simple and Intensive rotations had the highest CCF. The LP Intensive rotation had higher CCF than the LP Continuous and LP Simple rotation, and was not far behind the HP rotations.
Cost of infrastructure such as fencing and water were not included in this analysis due to large variation in necessity of these investments for different farms. You can do your own cost analysis using the EverGraze Pasture Improvement Calculator. The Orange EverGraze Proof Site also provides an economic analysis of capital inputs for grazing systems.
The Net Present Value (Table 7) is simply the value of a future sum of money (the CCF) converted to today’s dollars using a discount rate. The LP and HP Intensive rotations had the highest NPV’s due to the higher stocking rates carried.
The Internal rate of return (IRR) is a measure used to look at the average annual return on capital invested. For the ten years analysed, the LP treatments had higher IRR’s (Table 7), but all options had relatively high IRR’s.
It is important to consider that the pastures in the Continuous grazed treatments had declined to a point that they would need to be resown by the end of the experiment, so this would be an additional cost beyond 2002.

Table 7. Comparison of gross margins, internal rate of returns and net present values of the six treatments
| Treatment | Gross margin$/ha (at highest stocking rate achieved in 2001) | Internal rate of return | Net present value ($/ha) |
| LP Continuous | 396 | 36% | 163 |
| LP Simple | 396 | 37% | 179 |
| LP Intensive | 475 | 39% | 216 |
| HP Continuous | 460 | 18% | 121 |
| HP Simple | 496 | 21% | 168 |
| HP Intensive | 535 | 21% | 184 |
Pastures
Growth

Pasture growth was measured each month using pasture cages. A summary of the monthly pasture growth rates for each treatment, from 1999-2002, is shown in Table 8. Annual pasture production for each treatment is shown in Figure 4.
In general, pasture growth was highest in the intensive rotation treatments, but significant differences varied with month and year.
Higher growth rates in the rotationally grazed treatments were due to the dramatic change in composition to a greater mass of perennial grass.
Table 8 – Average pasture growth rates of grazing and fertiliser treatments (kg/ha/day, 1999-2002)
| Jan | Feb | Mar | Apr | May | Jun | Jul | Aug | Sep | Oct | Nov | Dec | |
| LP Set | 7 | 5 | 3 | 31 | 14 | 11 | 11 | 16 | 37 | 65 | 15 | 5 |
| LP Simple | 6 | 6 | 5 | 32 | 17 | 12 | 14 | 19 | 39 | 79 | 23 | 7 |
| LP Intensive | 9 | 4 | 9 | 38 | 25 | 21 | 16 | 23 | 44 | 79 | 39 | 10 |
| HP Set | 7 | 7 | 4 | 34 | 22 | 15 | 19 | 26 | 55 | 83 | 21 | 6 |
| HP Simple | 10 | 6 | 8 | 36 | 20 | 15 | 17 | 27 | 51 | 99 | 32 | 7 |
| HP Intensive | 8 | 8 | 10 | 35 | 26 | 19 | 18 | 29 | 48 | 86 | 37 | 9 |
| Average across all systems | 8 | 6 | 7 | 34 | 21 | 16 | 16 | 23 | 45 | 82 | 28 | 7 |

Botanical composition
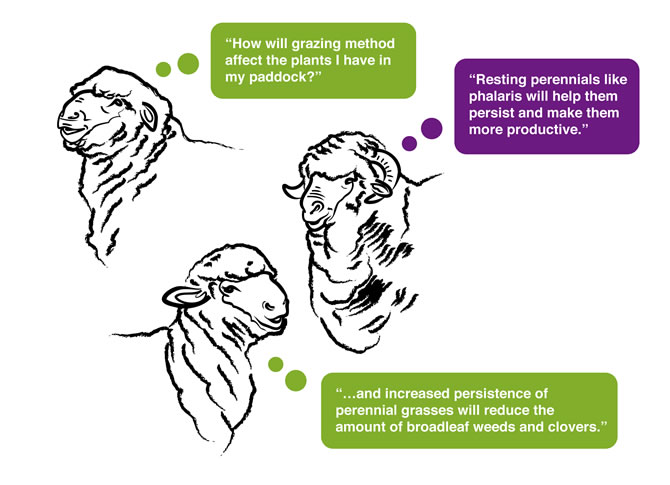
When grazing treatments were implemented in 1998, there were minimal differences in botanical composition between plots. Over the duration of the experiment, phalaris declined in Continuous grazed plots and increased in Intensive rotation plots.
Figure 4 shows the difference in overall pasture composition between treatments in 2001. Clover and capeweed were significantly higher in Continuous grazed plots compared to both rotations since these plants are best able to cope with continuous, hard grazing. There was no significant difference in annual grasses between grazing treatments.

 whereas intensive rotation plots were made up of phalaris and sub clover (right)")
Phalaris persistence
Basal cover (tiller density) was measured as the number of phalaris tiller bases beneath grid intersects on a 1m2 grid. This was measured each October.
Figure 5 shows the basal cover was maintained over time in the rotation treatments, but declined with time in the Continuous grazed treatments. Basal cover was always greatest in the rotation treatments.


Pasture quality
Crude protein (CP), digestible dry matter (DDM) and neutral detergent fibre (NDF) were measured each month over a 12-month period.
CP and DDM were consistently highest in the HP Continuous grazed pastures. This reflects the high clover percentage and a tendency for plants to remain in the early growth stages in this treatment. However, pasture protein levels in the rotation treatments were also adequate and above animal requirements when pastures were green.
NDF was consistently highest in the intensive rotation treatments reflecting the dominance of grasses in these pastures.
Ground cover
Ground cover was maintained well above target levels in the Simple and Intensive rotation grazing treatments. In the Continuous grazed treatments, ground cover was lower each autumn due to the dominance of annual species such as sub clover and capeweed, even though the stocking rate was less than the other treatments. This poses a significant risk of soil erosion, particularly in hill country. The higher content of perennial species in the rotationally grazed plots the more even grazing were responsible for the better ground cover throughout the summer period.
During the 2002/03 drought, plots were progressively destocked when they reached 70% ground cover. Higher ground cover on the rotationally grazed plots meant they remained stocked for up to seven weeks after the Continuous grazed plots were destocked. Ground cover on Continuous grazed plots continued to decrease through the summer due to the dominance of annual species in these pastures. The dominance of perennial species and a greater pasture mass prior to destocking allowed the HP Intensive rotation plots to maintain higher ground cover throughout the summer and into the autumn.

 but declined sharply in the annual dominant continuous grazed treatments (right) in the drought")
Soil
Nutrient distribution
Phosphorus (P), potassium (K), nitrate (NO3), and ammonium (NH4) were measured on a 20 metre grid across paddocks in autumn, 2002.
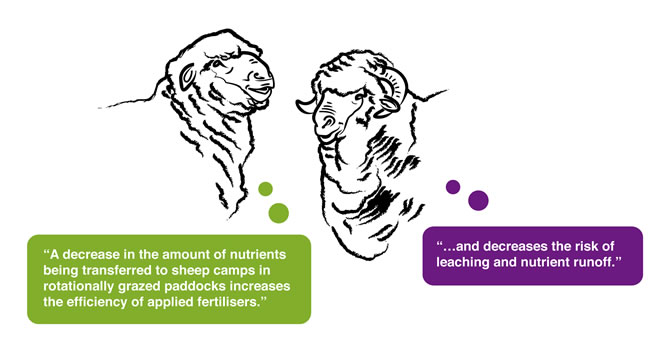
Continuous grazing resulted in transfer of plant nutrients towards sheep camp areas while nutrients were more evenly distributed in Intensive rotation paddocks (Figures, 9, 10 and 11). The distribution of nutrients was significantly correlated with the distribution of faeces meaning that differences were a result of stock transfer.
There were also significant differences in overall nutrient concentrations (P<0.05) such that the HP Intensive rotation had on average 5 mg/kg higher Olsen P compared to the set stocked treatment (Figure 9). Continuous grazed plots had the highest NO3 and NH4, probably due to a higher amount of nitrogen fixing clover in these plots.
Topography and the location of neighbouring stock influenced the location of high nutrient areas.
P application rate did not affect nutrient distribution.
The high concentrations of P, NO3 and NH4 in some areas of Continuous grazed plots increase the risk of nutrient loss into waterways via leaching or run-off.
|
|
|


Maintenance fertiliser requirements
More DSE’s were carried on the Intensive rotation plots compared to the Continuous grazed plots for the same input of P fertiliser.
Estimated maintenance rates of P are 0.4 kg P/DSE/ha for the Intensive rotation plots and 0.6 kg P/DSE/ha for the Continuous grazed plots.
Root growth and water use
In an earlier experiment (1997), root density was compared between HP and LP Continuous grazed and Simple rotation treatments. Root density at depth was greatest in the HP, Simple rotation treatment (Figure 10).
Soil moisture was measured using a Gopher moisture probe. Intensive rotation plots had the driest profile, followed by Simple rotation and Continuous grazed. A drier profile indicates that the plants are using more of the available water, and deep drainage is less likely to occur, helping to prevent dryland salinity. A greater root density in the rotation plots is thought to be responsible for the drier profiles in these treatments.

Organic carbon and soil microbial populations
Microbial activity and soil organic carbon levels were measured on the site in 2001.
- There were no significant differences in microbial activity between grazing treatments.
- A significantly greater amount of microbial activity was found in HP treatments compared to LP treatments (Figure 11).
- No differences in soil organic carbon levels were found between any treatments.

Putting the research into practice – improving the productivity and persistence of perennial pastures with grazing management
Getting started
If you like the idea of rotational grazing, there are a few things that you need to consider when getting started.
- Map the farm and identify pastures, soils, slopes and aspects which have different seasonal production and management requirements. Different areas can be classified into production zones which may need to be strategically grazed and rested at different times of year, depending on the aims.
- Consider what you want to get out of your grazing system for each production zone. Tailor the system to your needs. Do you need to improve persistence? Get rid of weeds? Increase growth? Increase utilisation? If increasing pasture growth is what you are aiming for, make sure soil fertility isn’t limiting – take a soil test.
- It’s important to get stocking rate right – always leave at least 800 kg DM/ha and 70% ground cover to help growth and perennial persistence. Manage ewes to condition targets according to Lifetimewool guidelines. Calculate current and potential stocking rate for the whole farm and make adjustments to optimise utilisation.
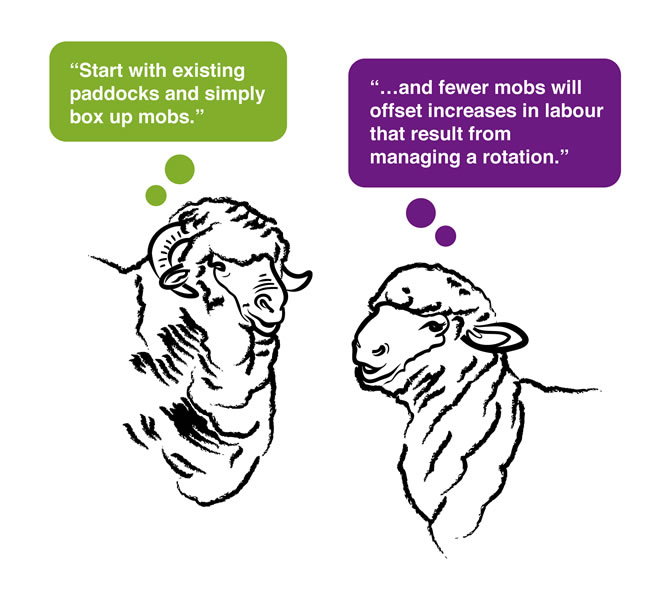
- List the mobs that can be boxed up at the start of each season. Start simple by rotating them around their existing paddocks before deciding on any fencing and water investments.
- Plan ahead, monitor pastures and livestock regularly and respond early to changing conditions. Resting perennial grasses is the key to improving their persistence and performance. Tailor the length of the rest period to the growth of the preferred perennial grass species throughout each season. Use the EverGraze Feedbase Planning and Budgeting Tools to plan ahead and calculate grazing periods.
- Be flexible. Sometimes you will need to compromise to meet both livestock and pasture requirements. Animals may need to be moved onto pastures before they are ready to be grazed to meet livestock production requirements. If pastures start to get too grass dominant (>80% grass), you need to graze paddocks harder – increase stocking rate, reduce rest periods or set stock for a while to encourage clover growth. It is best to set stock for lambing.
|
|
|


Setting up a rotation in the EverGraze Feed Budget and Rotation Planner
The EverGraze Feedbase Planning and Budgeting Tools can be used to set up rotations based on the amount of feed available and your stock requirements. The Feed Budgeting and Tactical Management page provides information and examples for using the tool. Examples for allocating mobs to paddocks and setting up a rotation plan are provided below.
Allocating mobs to pastures using the EverGraze Feed Budget and Rotation Planner.
Setting up a rotation using the EverGraze Feed Budget and Rotation Planner.
Acknowledgments
The Broadford Grazing Experiment was funded by Agriculture Victoria, the National Landcare Program and Australian Wool Innovation. Incitec Pivot also provided support for the research. The content of this page was originally printed as a brochure and was updated by the national EverGraze project, a Future Farm Industries CRC research and delivery partnership.
 |
 |
The Broadford Grazing Experiment team would like to thank Bob and Karen Webster for allowing this experiment to take place on their property and for all their support with the research over the 10 years.
Project Leader: Lisa Warn.
Project Staff: Pat McVeigh, Allan Semmler, Gary McLarty, Heather Frame, Jane Court, Kate Sargeant.
First published 2000 by Agriculture Victoria. Revised and reprinted in 2003 and 2013 by the National EverGraze Project, Future Farm Industries CRC.
© State of Victoria, Department of Primary Industries, 2013
Further Information
- Grazing Management On-Farm Options
- EverGraze Action – Grazing Phalaris for production and persistence
- Making More from Sheep – Pastures Module
- More Beef from Pastures – Pasture Utilisation Module
- Warn L, Frame H (2002), Effects of grazing method and soil fertility on stocking rate and wool production, Wool Technology and Sheep Breeding 50:3.
- Frame H, Warn L, McLarty G (2002), Effects of grazing system and phosphorus application on pasture quality, Wool Technology and Sheep Breeding 50:3.
- Sargeant K, Warn L, McLarty G (2006), Winning the war against bare ground and broadleaf weeds with grazing management – results from the Broadford Grazing Experiment 1998-2003, Grasslands Society of NSW Annual Conference
- Sargeant K (2012) Grazing management principles – how to get the most out of your pastures with grazing management, Grasslands Society of Southern Australia Annual Conference Proceedings.
- Saul (2011) Grazing management – sorting fact from fiction Grasslands Society of Southern Australia Annual Conference Proceedings.
- Orange EverGraze Proof Site – grazing management and land class fencing of native pastures
- Albury-Wodong EverGraze Proof Site – integrated management of native pastures and phalaris
- Long Term Phosphate Experiment – the costs and benefits of phosphorus fertiliser
